194.
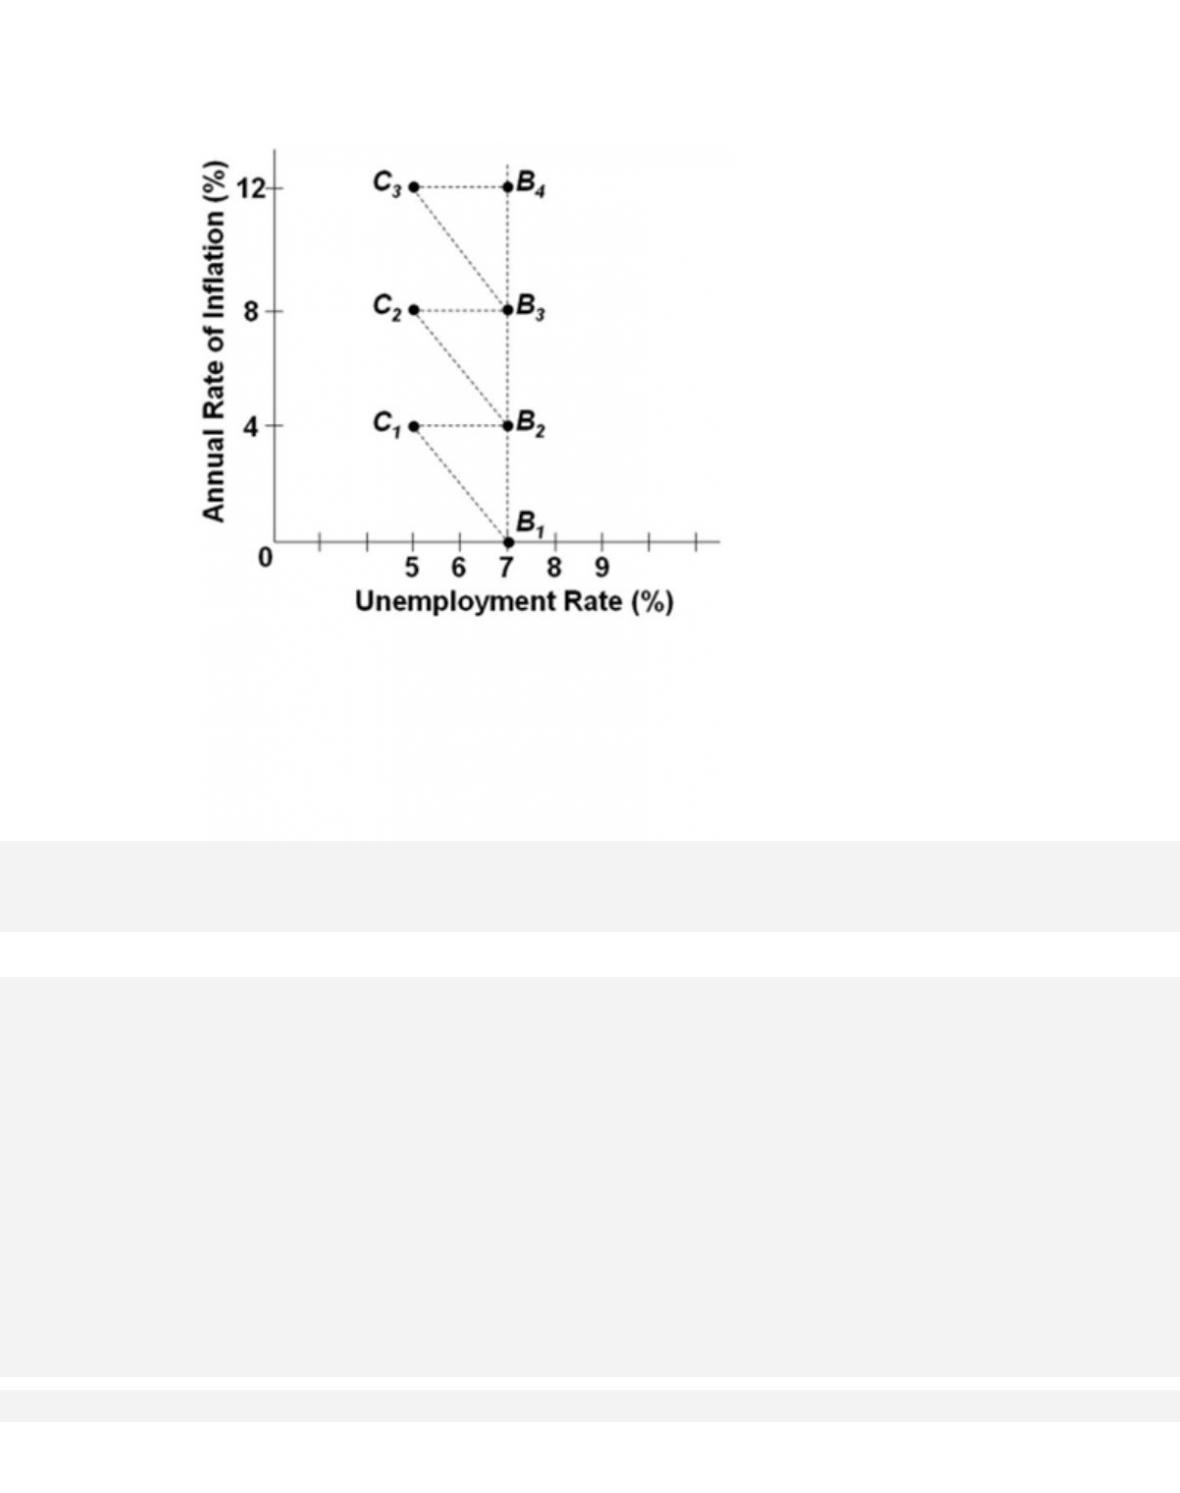
Refer to the graph. What events would tend to temporarily move the economy from point B2
to C2?
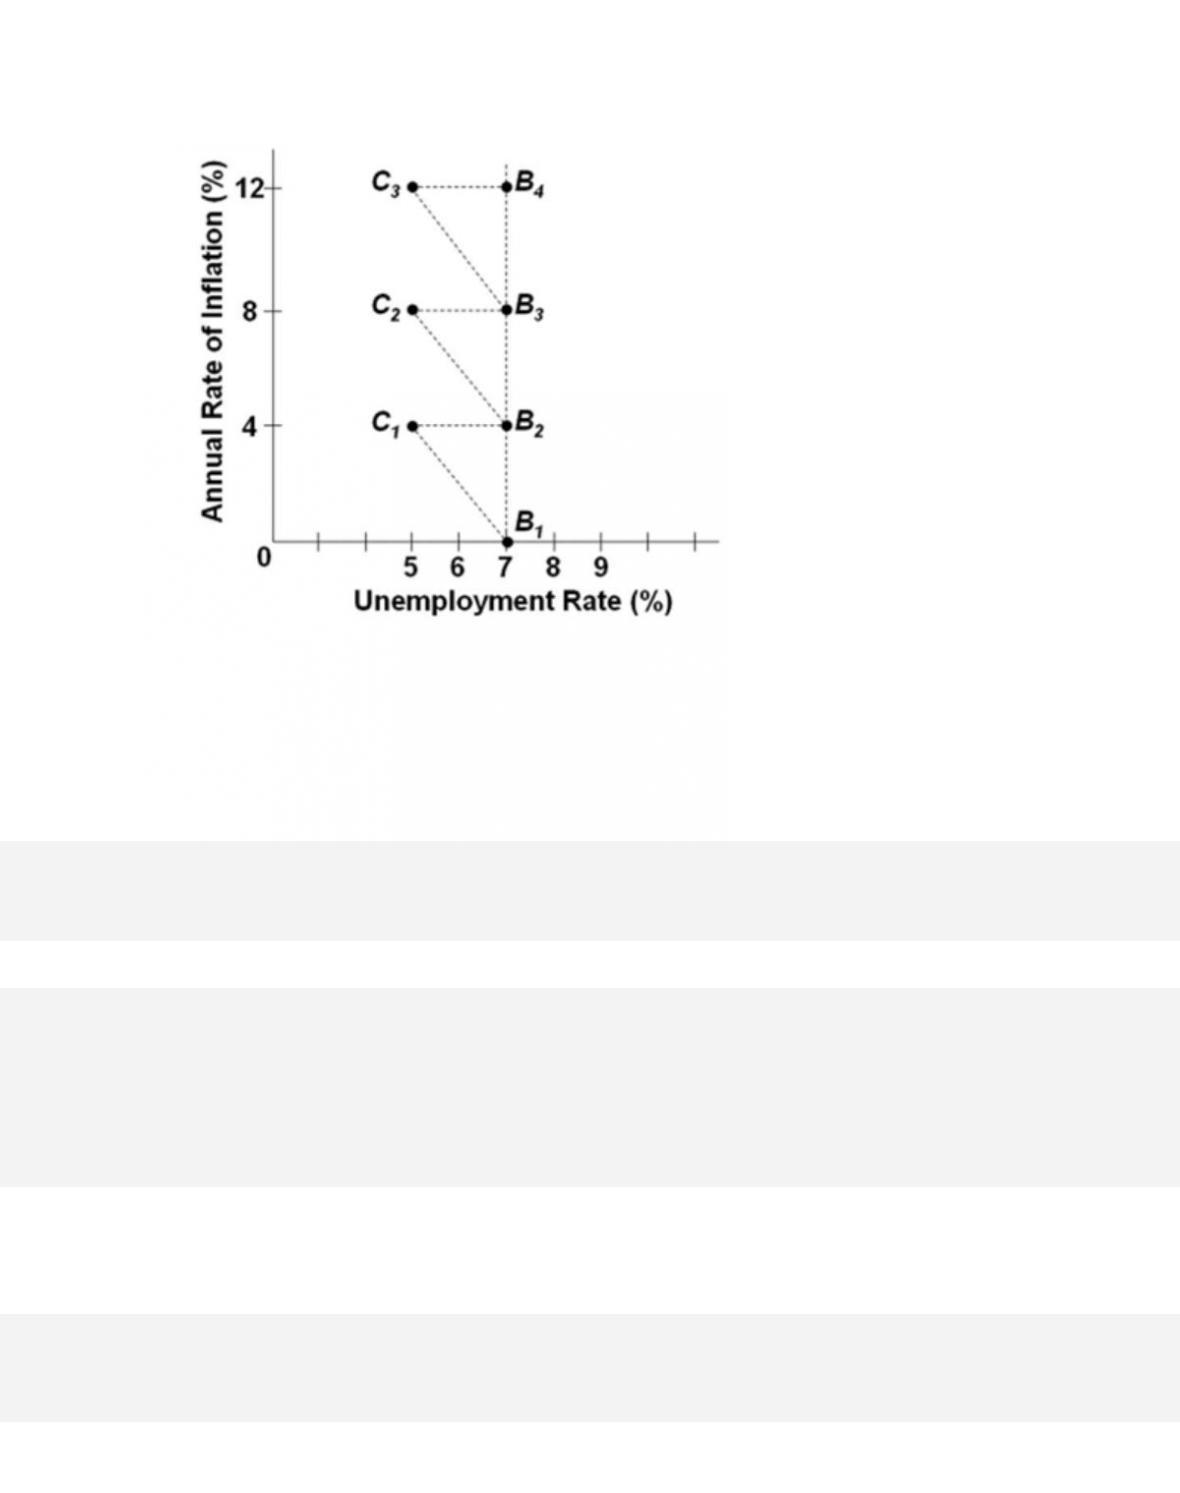
195.
Refer to the graph. The economy is at point B2, and then aggregate demand increases. In the
short run, the economy will
196.
The automatic adjustment mechanism that makes the economy move toward the long-
run Phillips Curve is

38-123
Copyright © 2018 McGraw-Hill Education. All rights reserved. No reproduction or distribution without the prior
written consent of McGraw-Hill Education.
B.
inflation expectations and wage adjustments.
C.
contractionary fiscal or monetary policy.
D.
increases in productivity over time.
197.
The long-run Phillips Curve is vertical at
198.
In the short run, if the actual rate of inflation falls lower than the expected rate, then

199.
The short-run Phillips Curve assumes an unchanging
200.
If the expected rate of inflation rises, then the short-run Phillips Curve will
201.
When the rate of inflation is decreasing, this economic condition is called

38-125
Copyright © 2018 McGraw-Hill Education. All rights reserved. No reproduction or distribution without the prior
written consent of McGraw-Hill Education.
Learning Objective: 38-04 Discuss why there is no long-run trade-off between inflation and
unemployment.
Test Bank: II
Topic: The Long-Run Phillips Curve
202.
Based on the Phillips Curve, when the actual rate of inflation is greater than the
expected rate, the unemployment rate will
203.
Disinflation can be explained by the Phillips Curve analysis as resulting from a
situation where the actual rate of inflation is initially less
than the expected rate, causing the
unemployment rate to

38-126
Copyright © 2018 McGraw-Hill Education. All rights reserved. No reproduction or distribution without the prior
written consent of McGraw-Hill Education.
unemployment.
Test Bank: II
Topic: The Long-Run Phillips Curve
204.
The short-run Phillips Curve intersects the long-run Phillips Curve at the
205.
Assume contracts between workers and employers that call for an increase in the wage
rate of 5 percent are based on an expected
inflation rate of 3 percent. Should inflation
actually be 6 percent, then
206.
The analysis of the short-run and long-run Phillips Curve suggests that an increase in
aggregate demand

38-127
Copyright © 2018 McGraw-Hill Education. All rights reserved. No reproduction or distribution without the prior
written consent of McGraw-Hill Education.
employment.
D.
does not influence real output and employment in the short run or the long run but only the
price level.
207.
Year
Price Index
1
100
2
110
3
120
4
130
Refer to the table. What would be the annual inflation rates in Years 2, 3, and 4,
respectively?
208.
Year
Price Index
1
100
2
110
3
120

4
130
Refer to the table. Calculating the annual inflation rates would indicate that this economy is
experiencing
209.
Which is a basic proposition of supply-side economics?
210.
Supply-side economists contend that the system of taxation in the United States

38-129
Copyright © 2018 McGraw-Hill Education. All rights reserved. No reproduction or distribution without the prior
written consent of McGraw-Hill Education.
Blooms: Understand
Difficu l t y : 02 Medium
Learning Objective: 38-05 Explain the relationship between tax rates, tax revenues, and
aggregate supply.
Test Bank: II
Topic: Taxation and Aggregate Supply
211.
Supply-side policies can be described in terms of the aggregate demand and aggregate
supply model as an attempt to shift
212.
A Congressional representative who calls for a decrease in tax rates in order to
increase saving, work effort, and economic growth
would most likely be advocating
213.
In an aggregate demand-aggregate supply framework, fiscal policy that emphasizes
cutting taxes as a means of improving incentives to
work, save, and invest would be
characterized primarily as a

214.
Which action will tend to decrease aggregate supply, according to supply-side
economists?
215.
Assume that a person saves $50,000 and earns 7 percent annual interest. If the marginal
tax rate is 36 percent, then the after-tax interest
earnings will be

38-131
Copyright © 2018 McGraw-Hill Education. All rights reserved. No reproduction or distribution without the prior
written consent of McGraw-Hill Education.
Learning Objective: 38-05 Explain the relationship between tax rates, tax revenues, and
aggregate supply.
Test Bank: II
Topic: Taxation and Aggregate Supply
216.
Assume that a person earns $600 per day at a certain job. If the marginal tax rate is cut
from 40 percent to 30 percent, then this person’s
after-tax daily earnings will
217.
One central idea in supply-side economics concerning budget deficits is illustrated by
the
218.
According to the Laffer Curve, a cut in the tax rate from above the maximum-revenue
rate to a rate lower than the maximum-revenue rate
will
38-132
Copyright © 2018 McGraw-Hill Education. All rights reserved. No reproduction or distribution without the prior
written consent of McGraw-Hill Education.
C.
decrease tax revenues.
D.
have no effect on tax revenues.
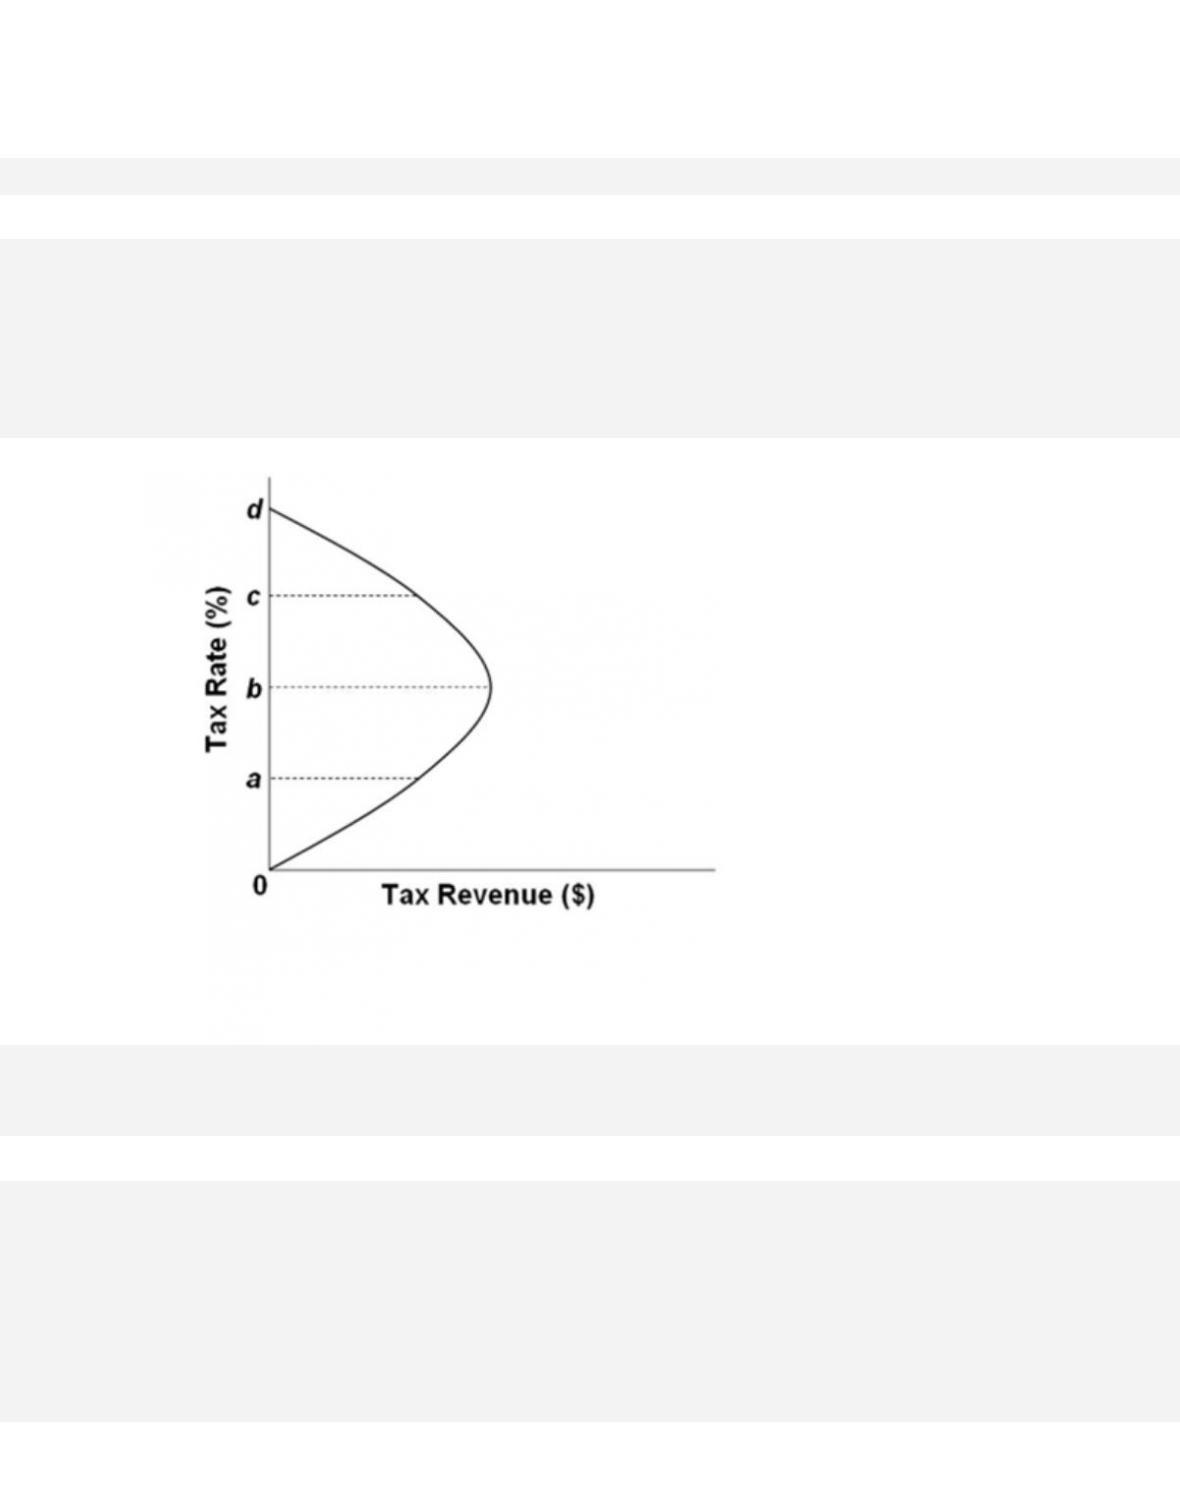
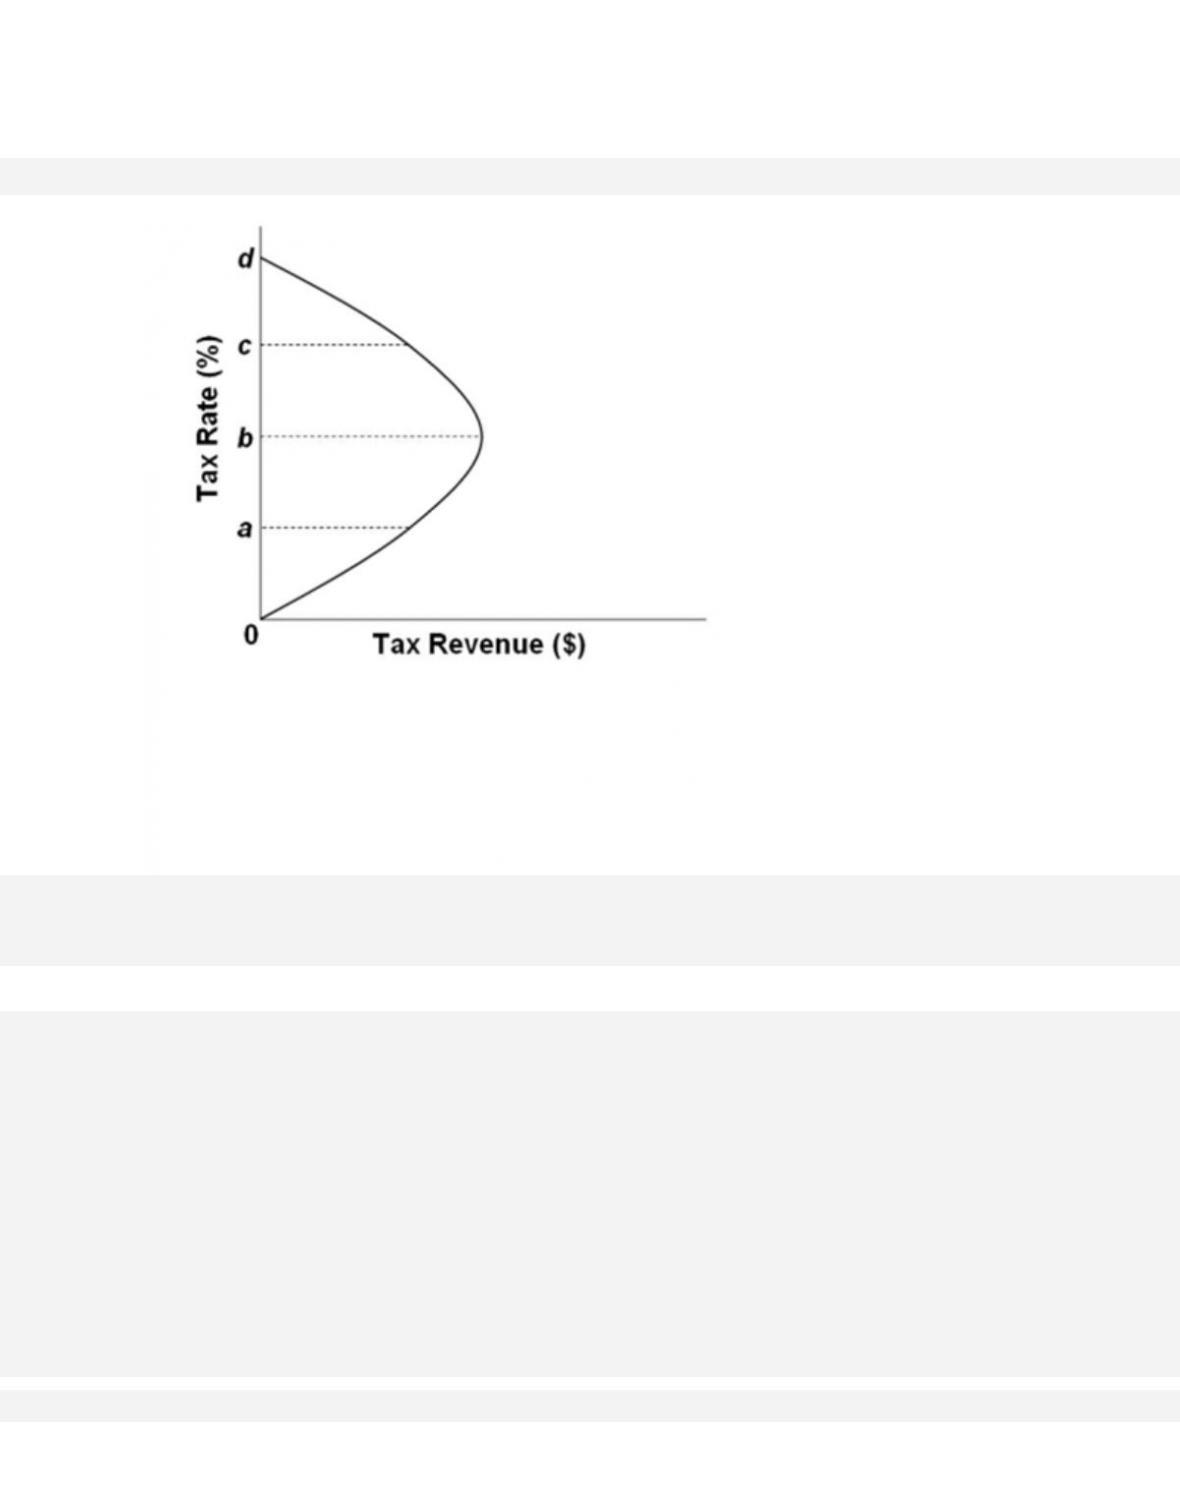
219.
The graph describes the notion that as tax rates rise from zero percent, tax revenues will
38-133
Copyright © 2018 McGraw-Hill Education. All rights reserved. No reproduction or distribution without the prior
written consent of McGraw-Hill Education.
Topic: Taxation and Aggregate Supply
Type: Graph
220.
Refer to the graph. If tax rates are between b and d, then supply-side economists are of the
opinion that a(n)
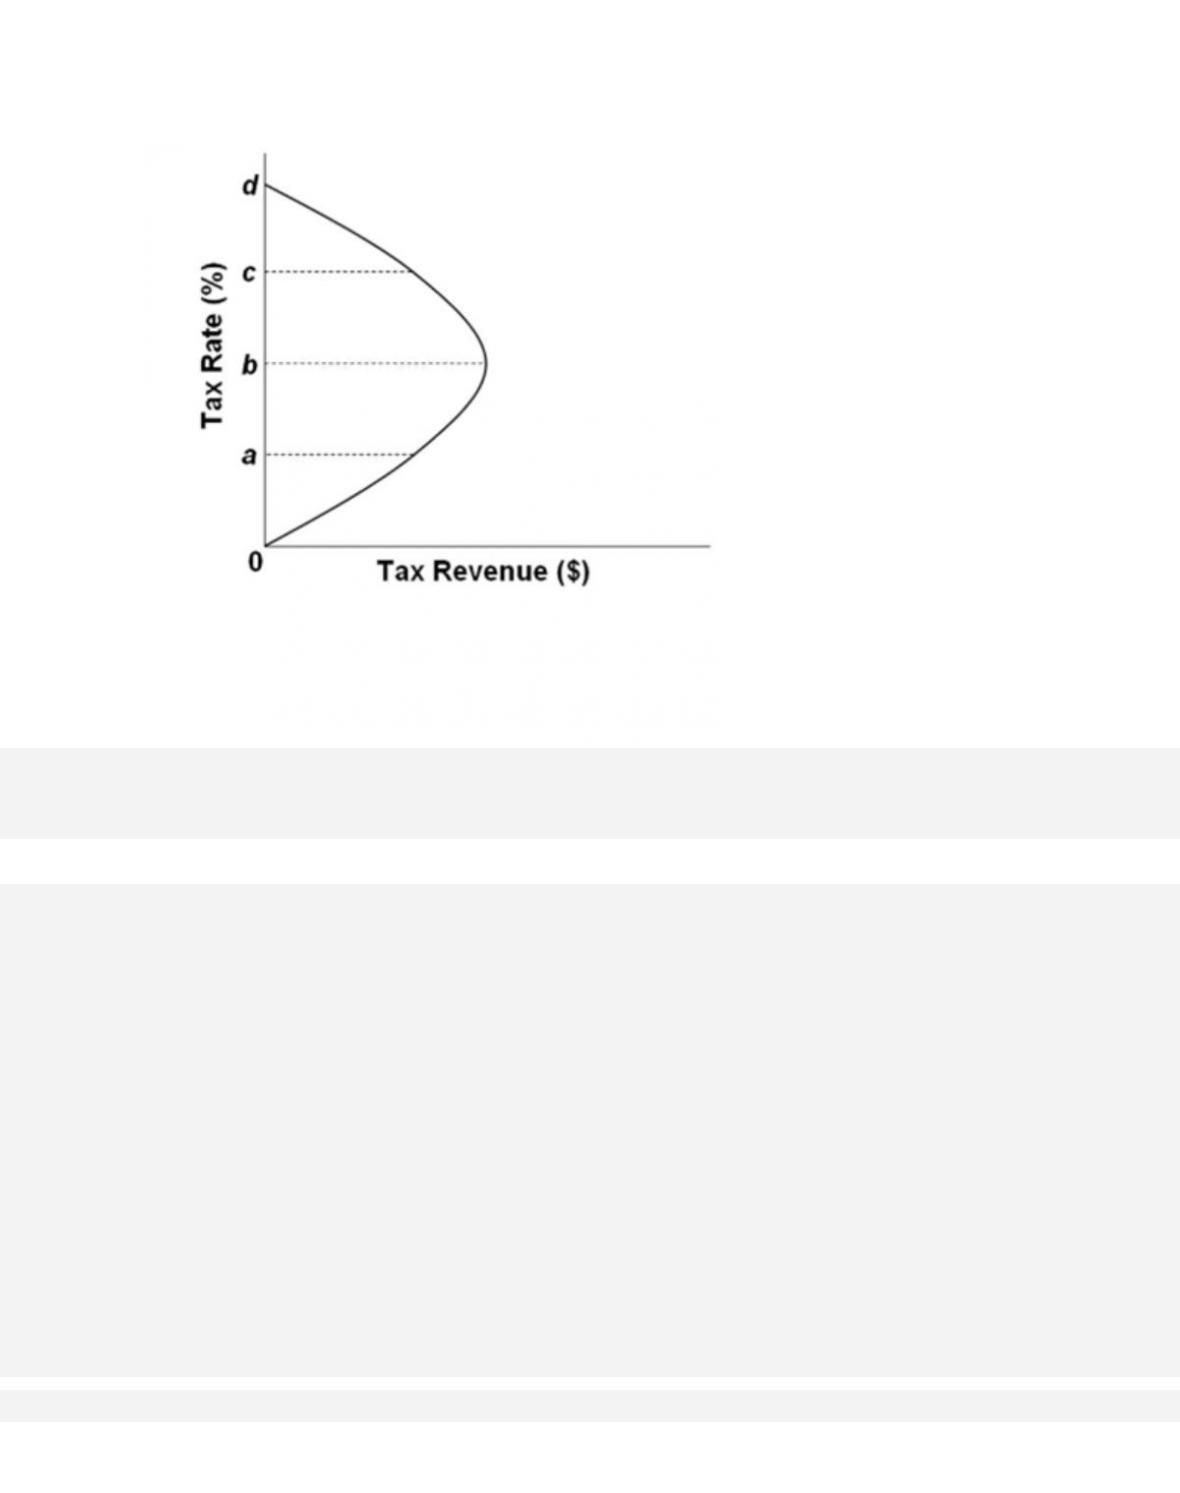
221.
Refer to the graph. Critics of supply-side economics would argue that tax rates are currently
between

222.
Refer to the graph. A movement from point C to point D on the Laffer Curve represents
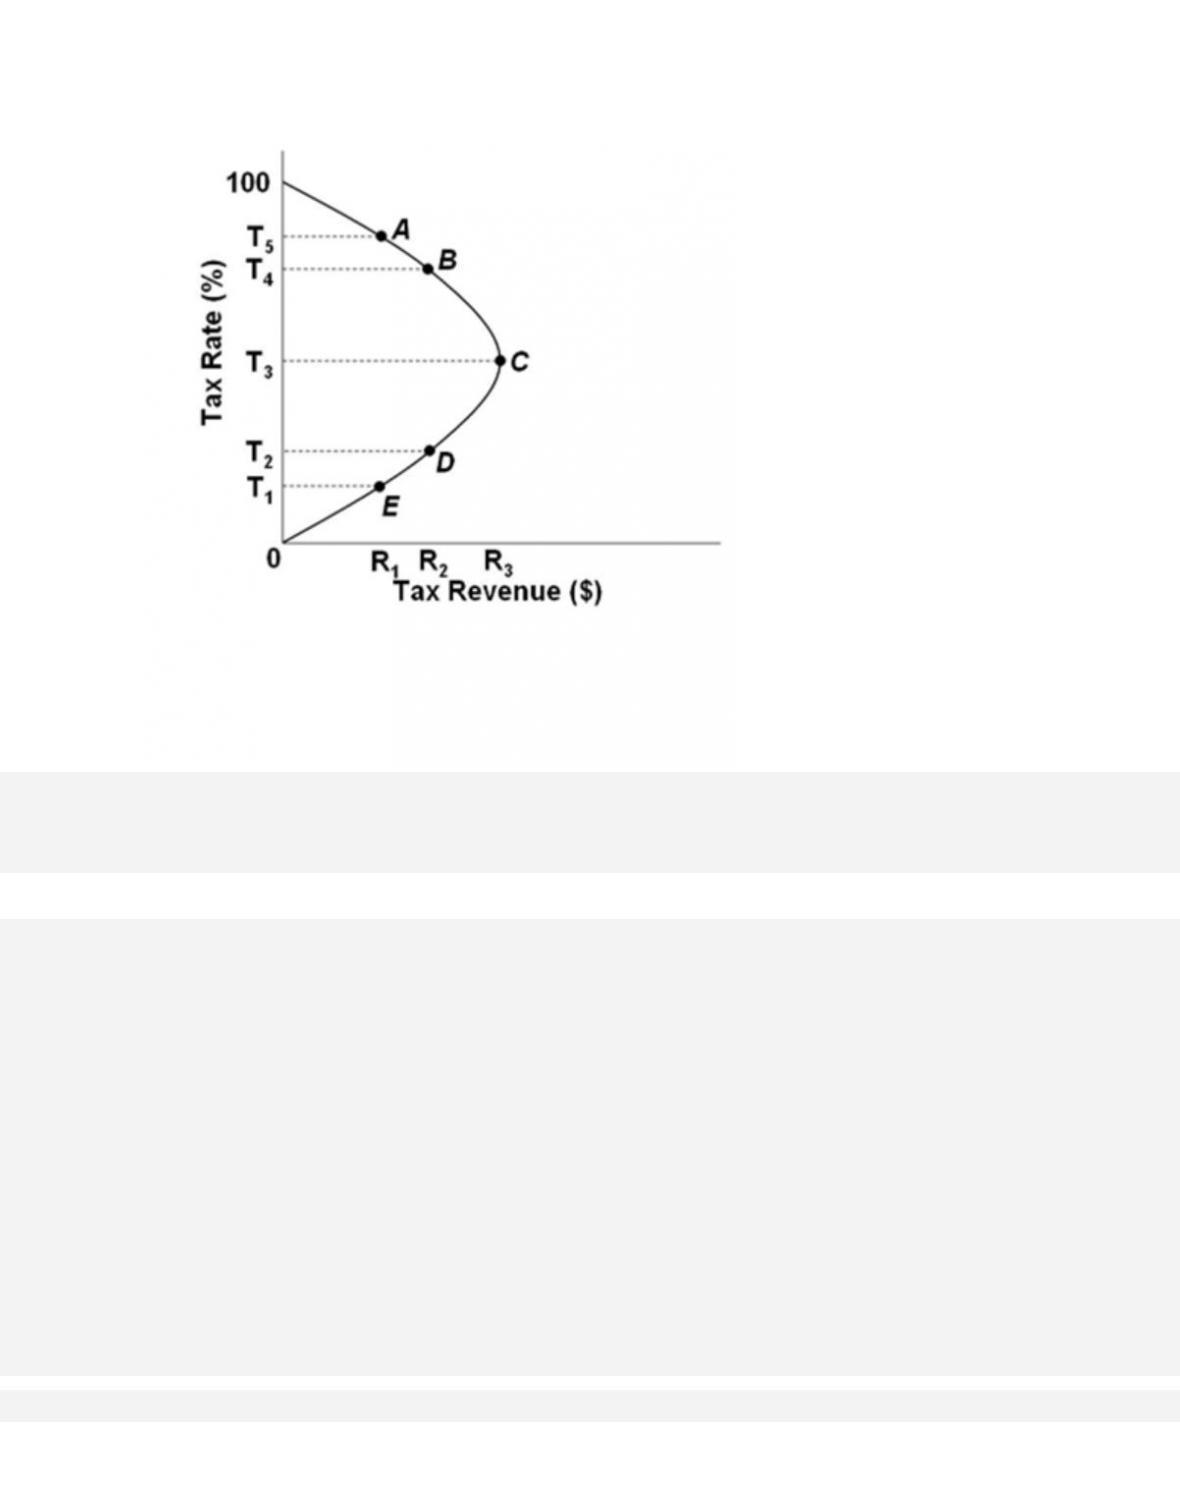
223.
Refer to the graph. If the government wants to collect tax revenues equal to R2, then the tax
rate should be set at
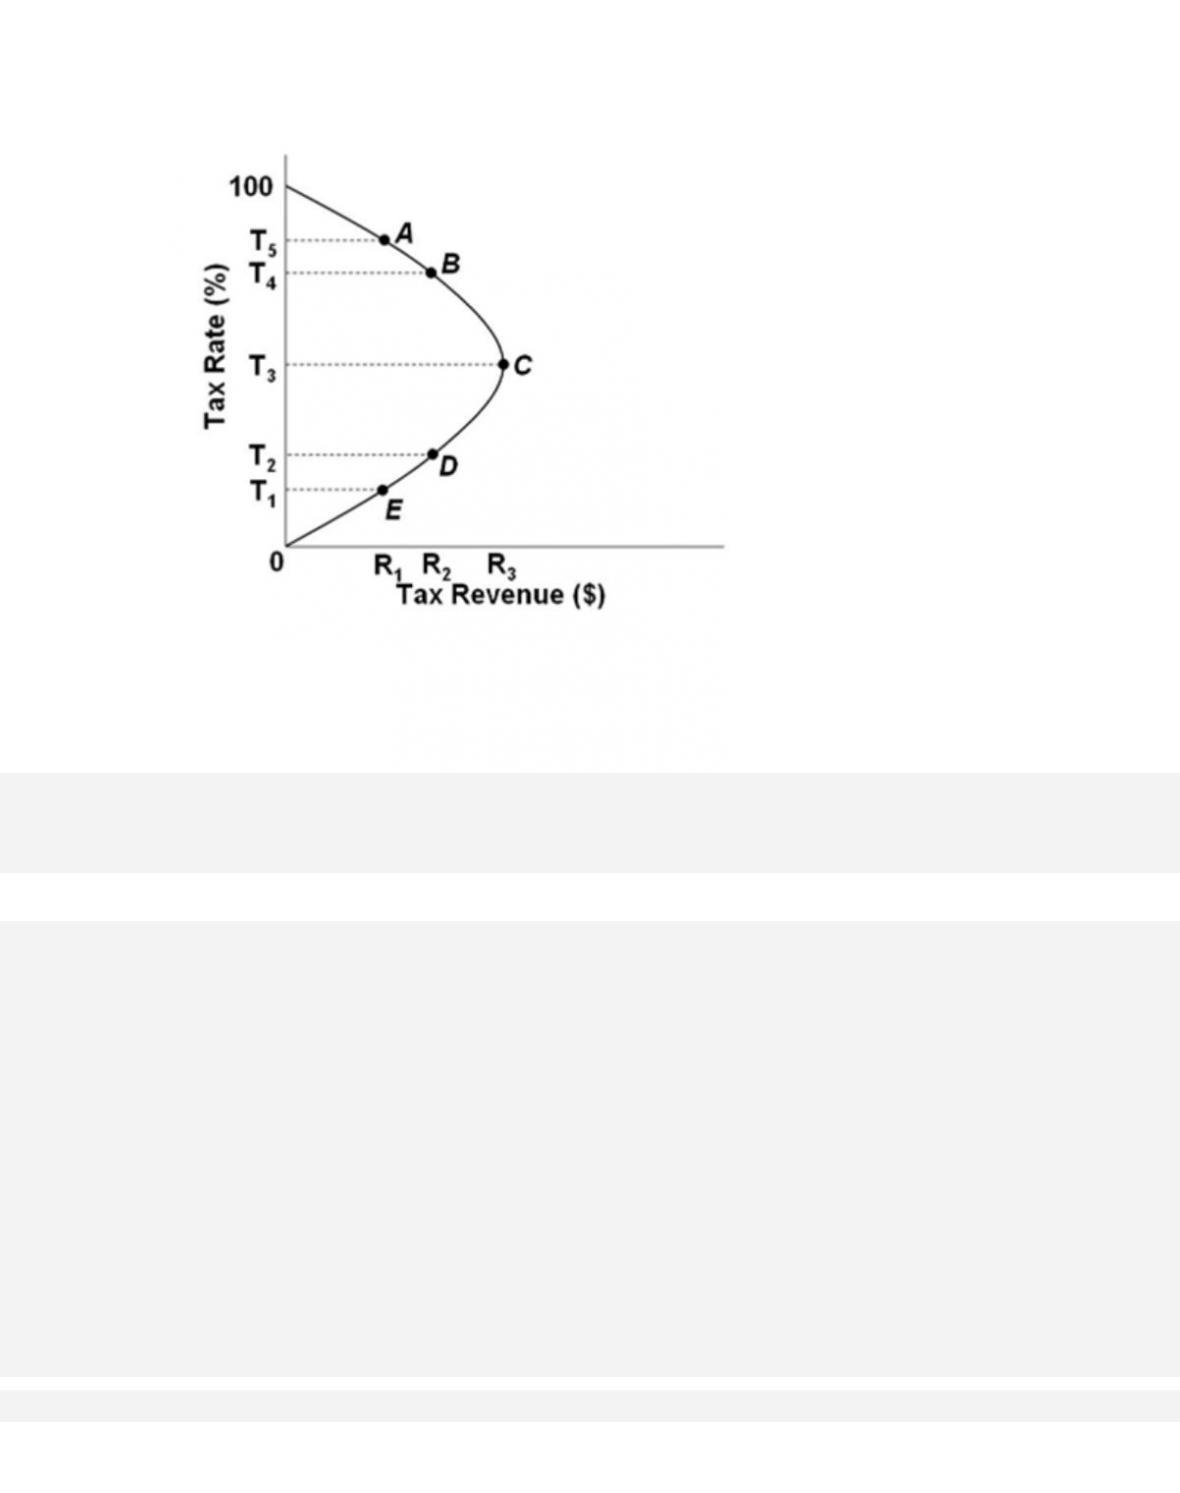
224.
Refer to the graph. If the government wishes to collect tax revenues equal to R2, supply-side
economists would strongly advise the
government to set tax rates at
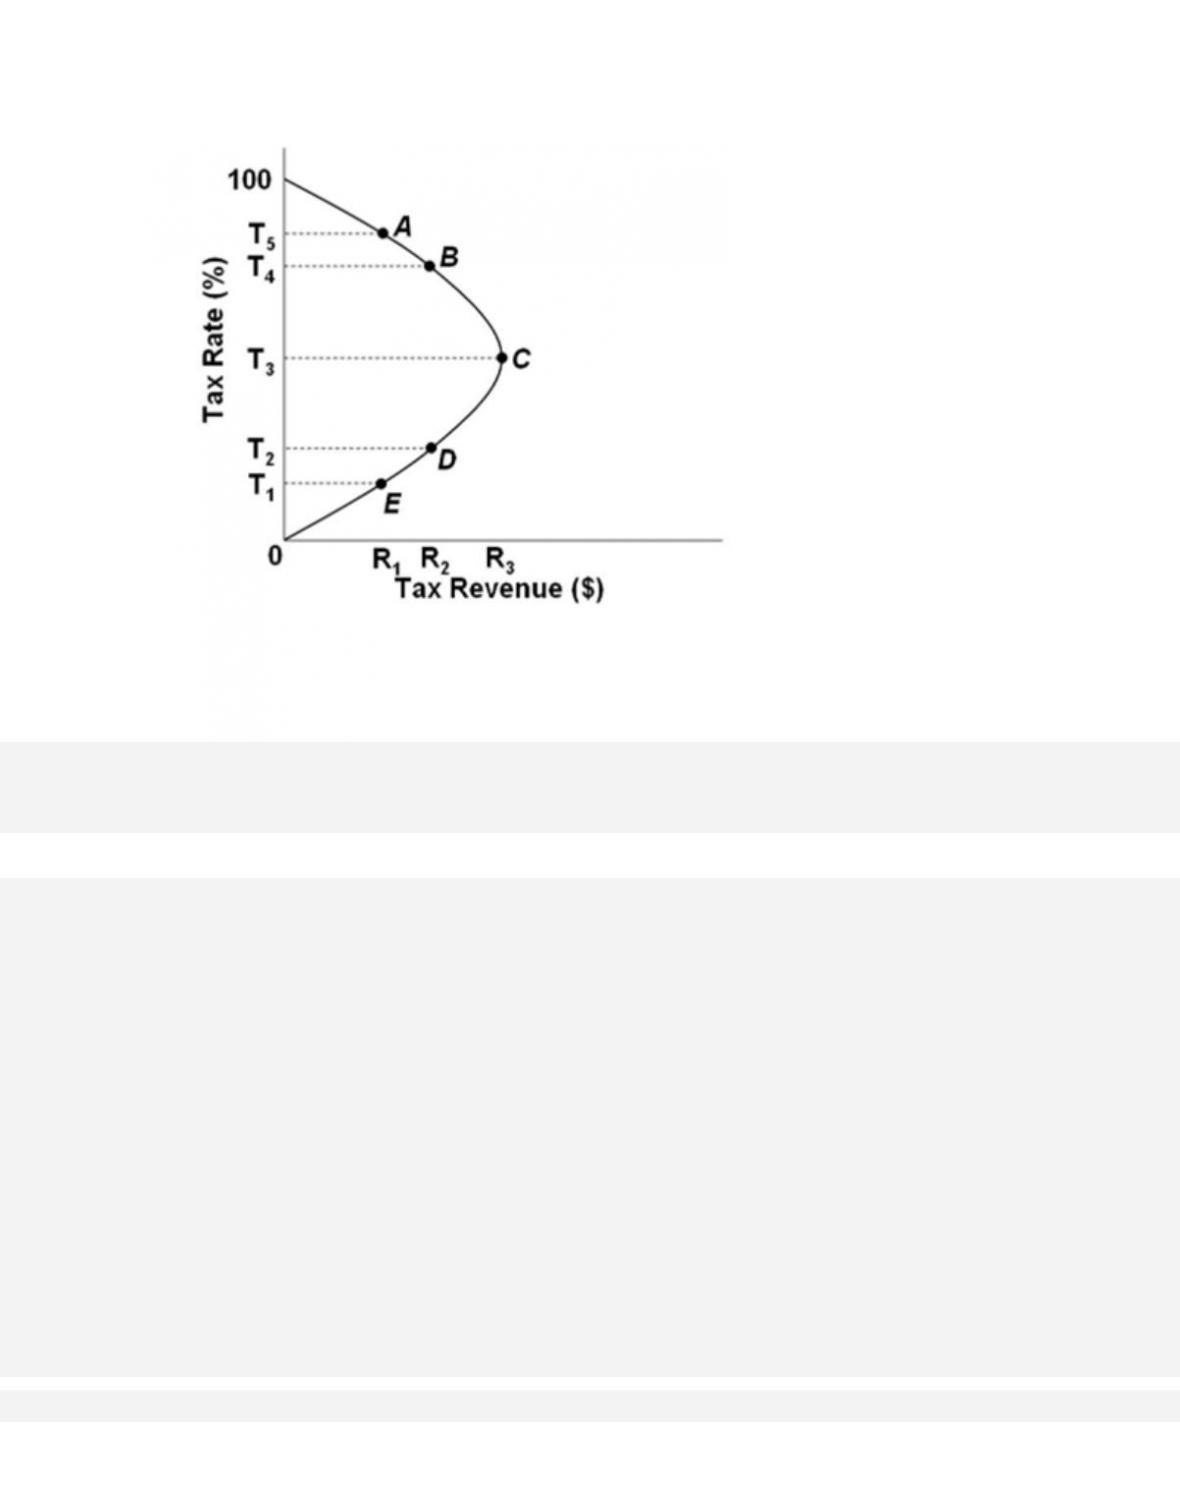
225.
Refer to the Laffer Curve. A cut in the tax rate from T5 to T4 would
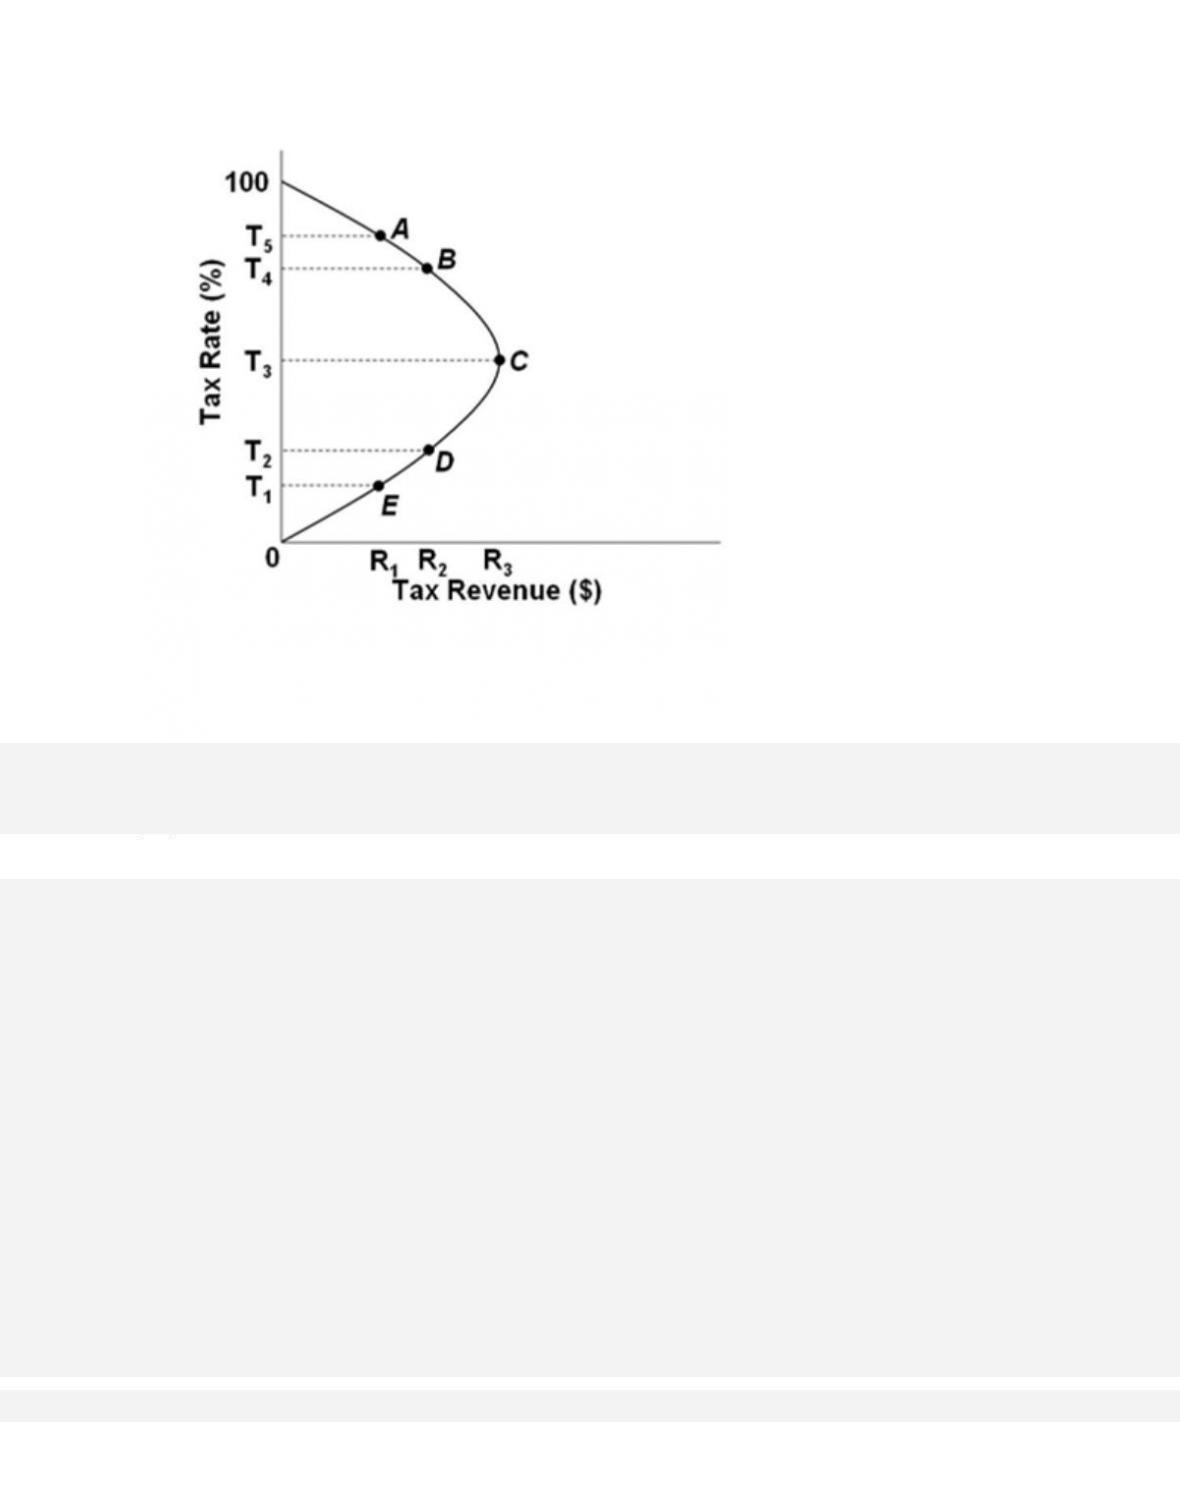
226.
Refer to the Laffer Curve. A cut in the tax rate from T2 to T1 would