38–61
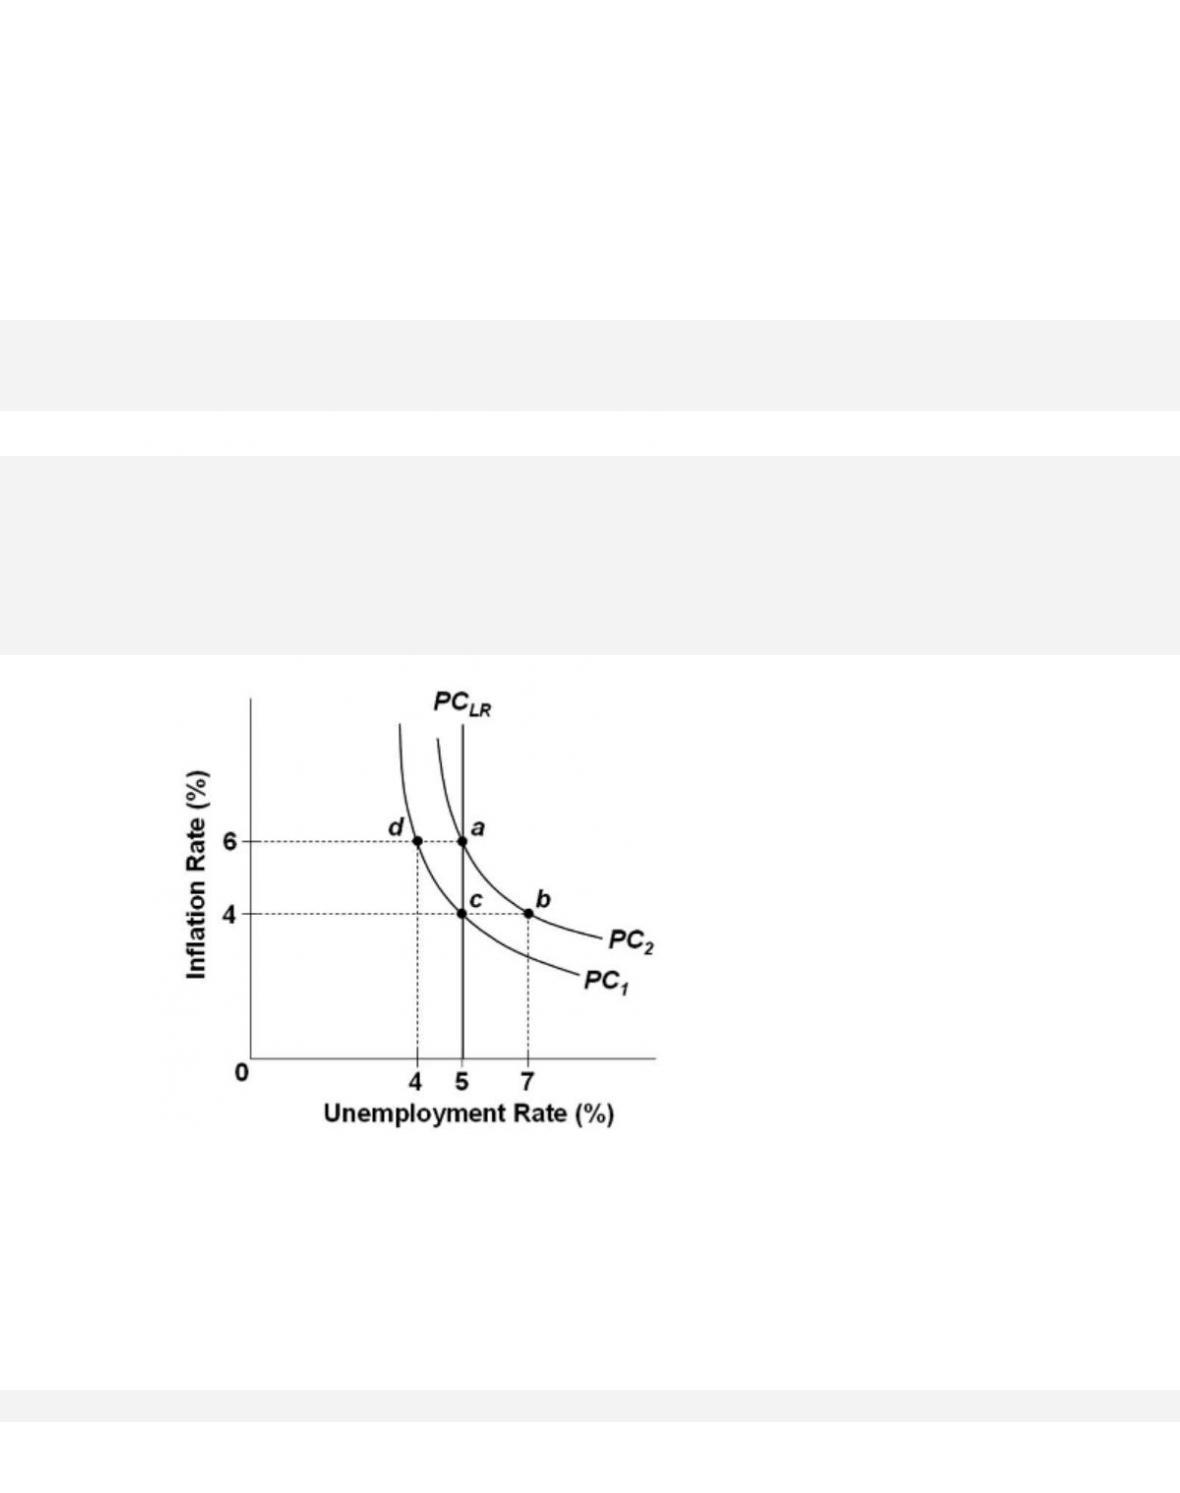
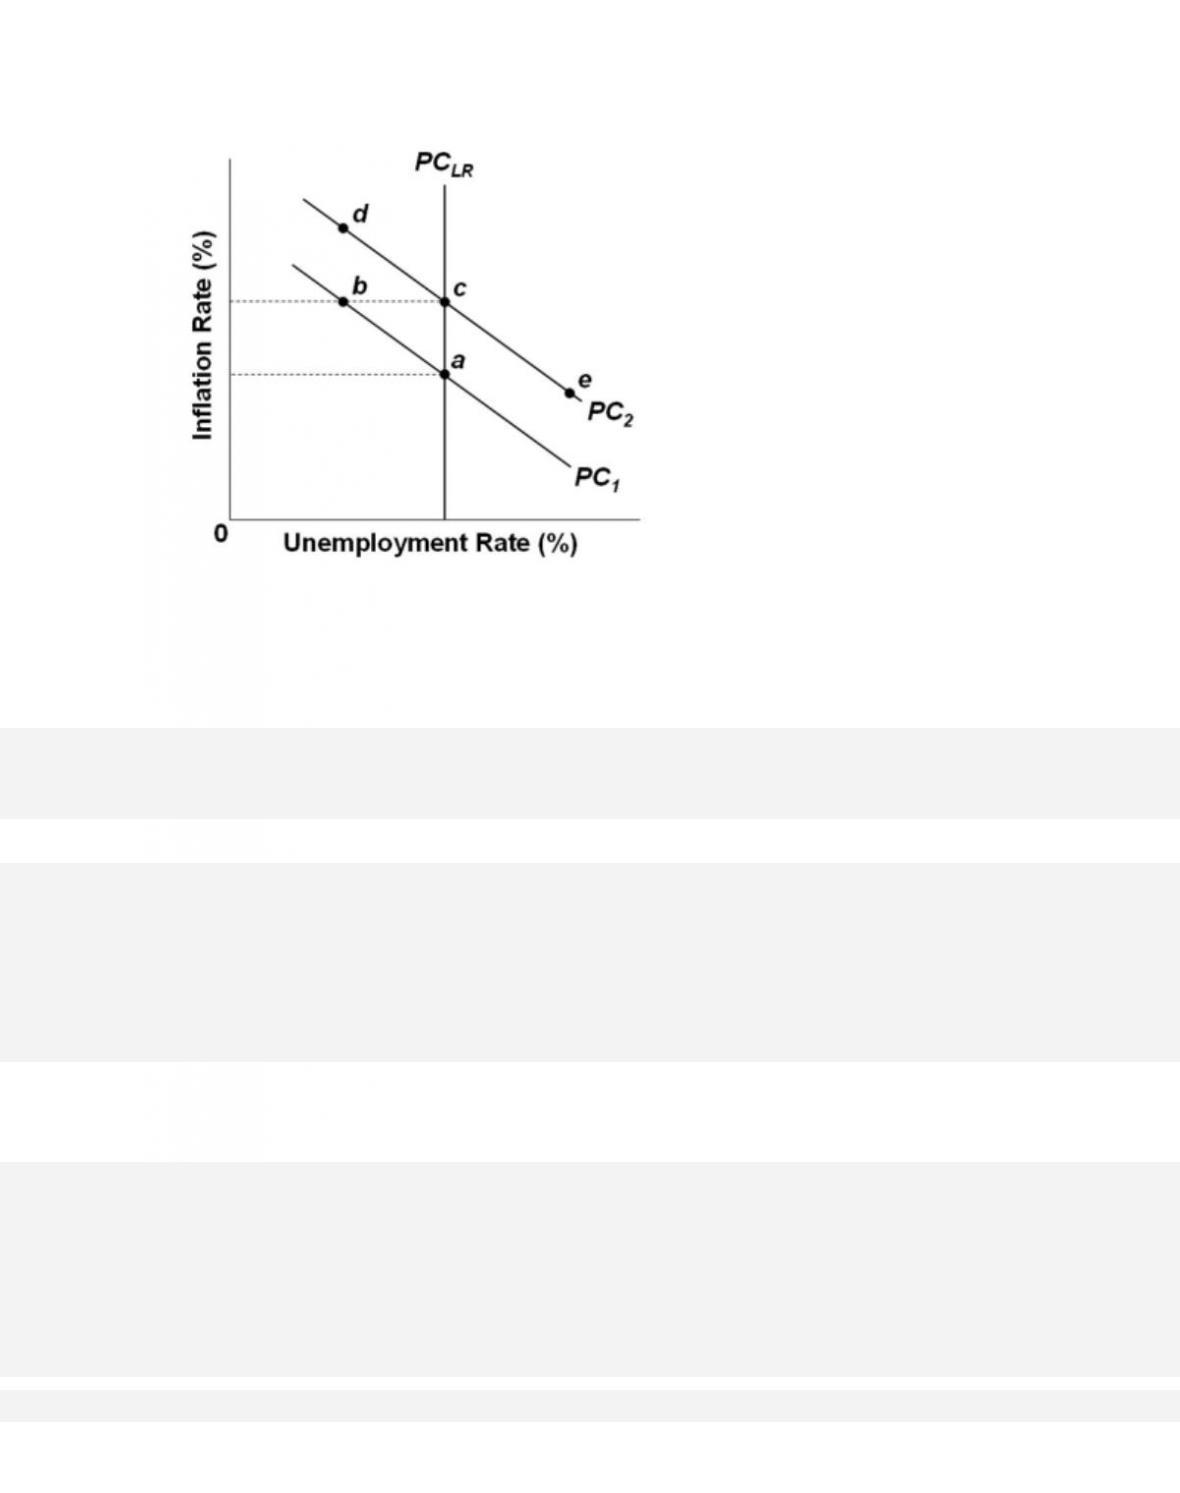
Refer to the diagram. Assume that the natural rate of unemployment is 5 percent and that the
economy is initially operating at point a,
where the expected and actual rates of inflation
are each 6 percent. If the actual rate of inflation unexpectedly falls from 6 percent to 4
percent, then the unemployment rate will
92.
Refer to the diagram. Assume that the natural rate of unemployment is 5 percent and that the
economy is initially operating at point a,
where the expected and actual rates of inflation
are each 6 percent. In the long run, the decline in the actual rate of inflation from 6 percent
to 4 percent will
38–62
Copyright © 2018 McGraw-Hill Education. All rights reserved. No reproduction or distribution without the prior
written consent of McGraw-Hill Education.
A.
reduce the unemployment rate.
B.
reduce corporate profits in real terms.
C.
have no effect on the unemployment rate.
D. reduce real domestic output.
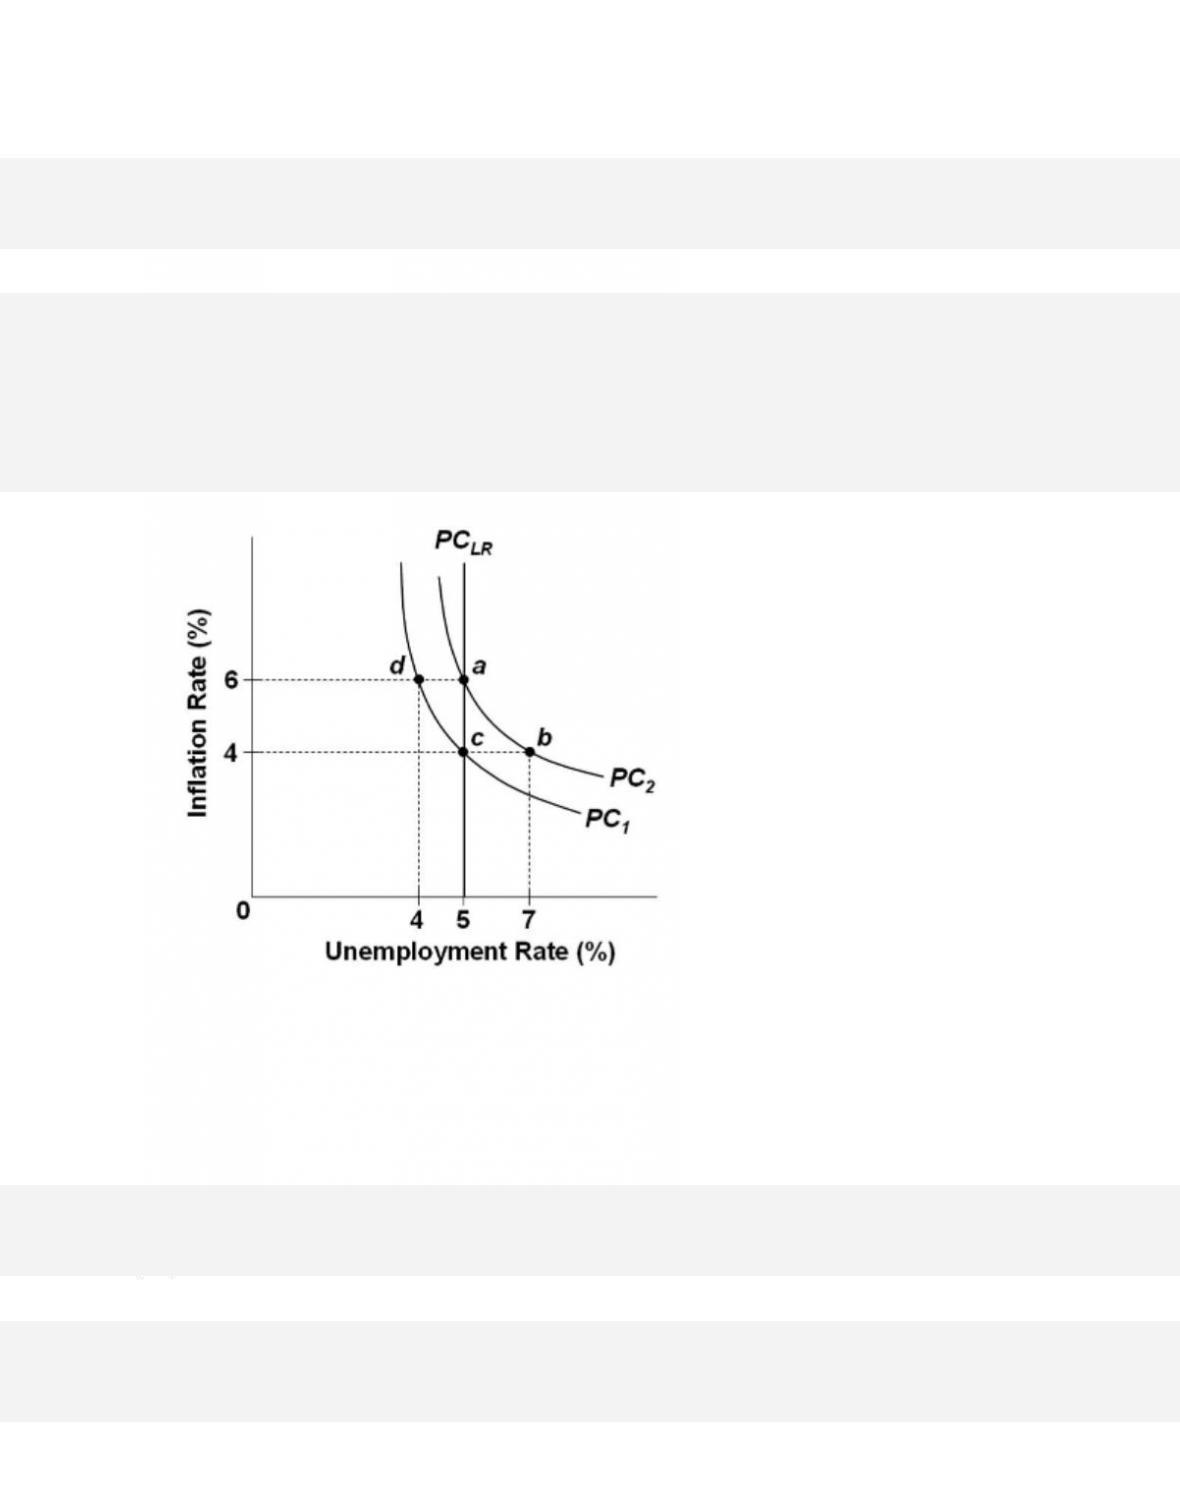
93.
Refer to the diagram. Assume that the natural rate of unemployment is 5 percent and that the
economy is initially operating at point c,
where the expected and actual rates of inflation
are each 4 percent. If the actual rate of inflation unexpectedly rises from 4 percent to 6
percent, the economy will
38–63
Copyright © 2018 McGraw-Hill Education. All rights reserved. No reproduction or distribution without the prior
written consent of McGraw-Hill Education.
Blooms: Understand
Difficu l t y : 02 Medium
Learning Objective: 38-04 Discuss why there is no long-run trade-off between inflation and
unemployment.
Test Bank: I
Topic: The Long-Run Phillips Curve
Type: Graph
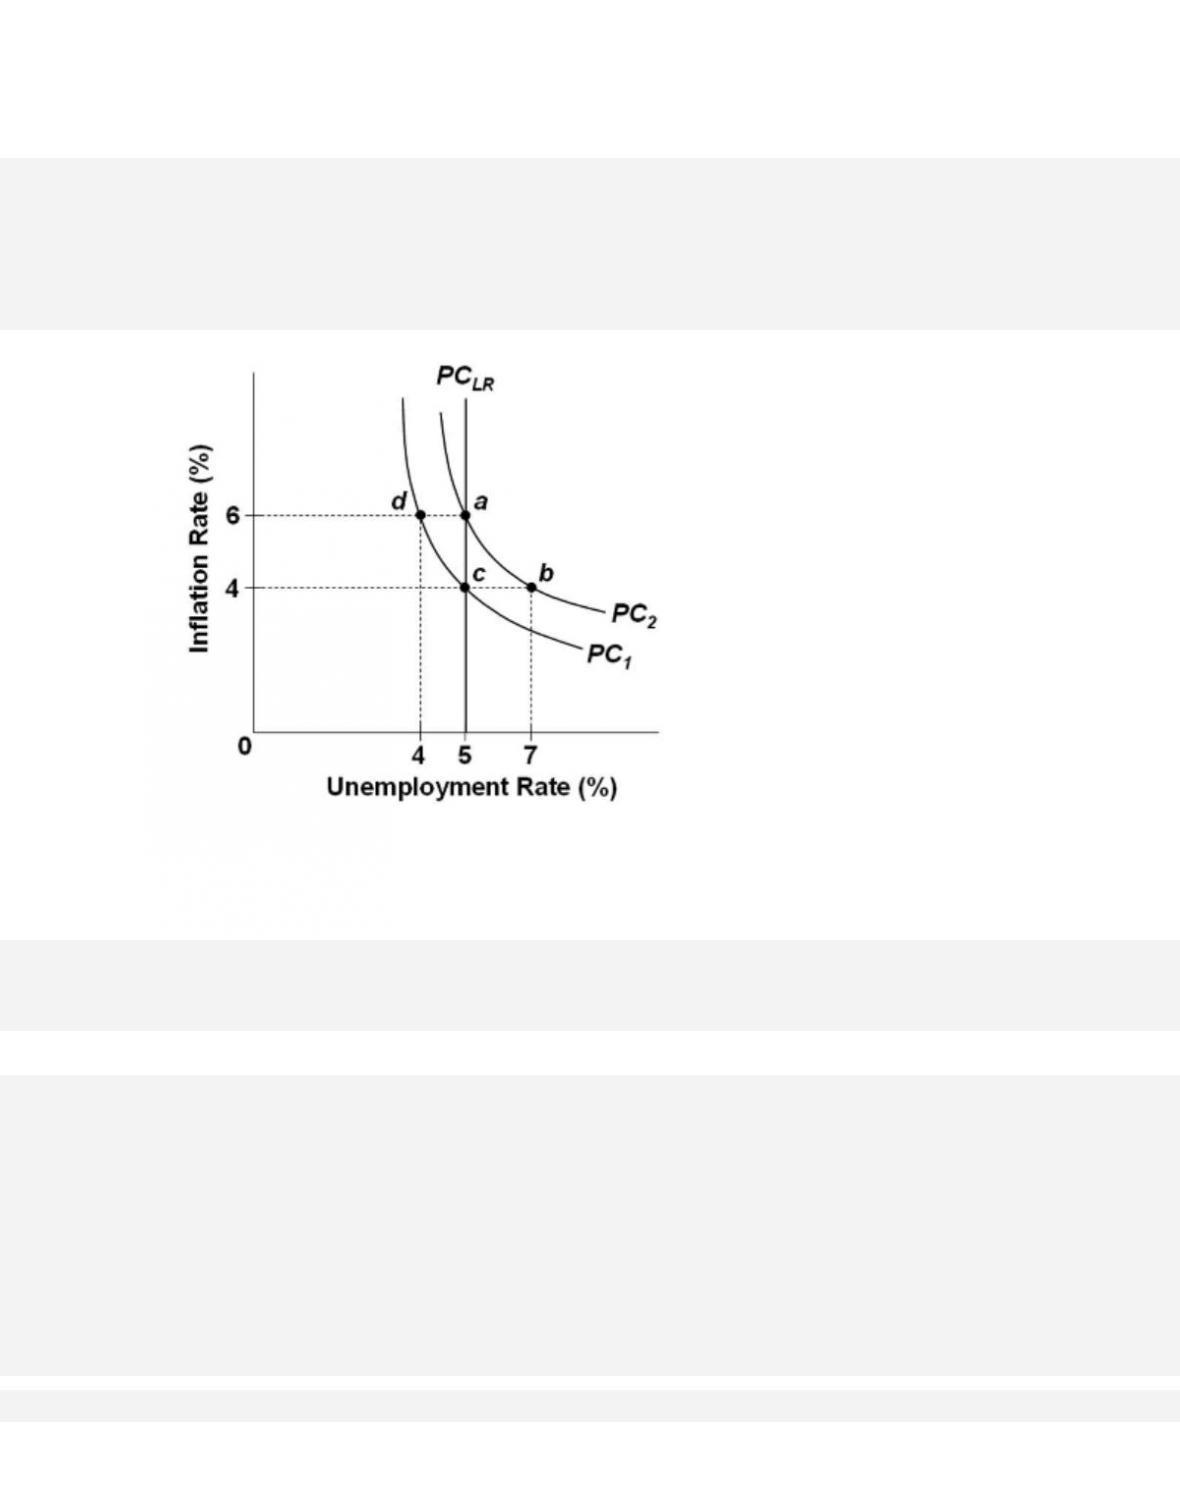
94.
In the diagram,

95.
Refer to the diagram. Point b on short-run Phillips Curve PC1 represents a rate of
96.
Refer to the diagram. Point b would be explained by

97.
Refer to the diagram. Point b would not be permanent because the
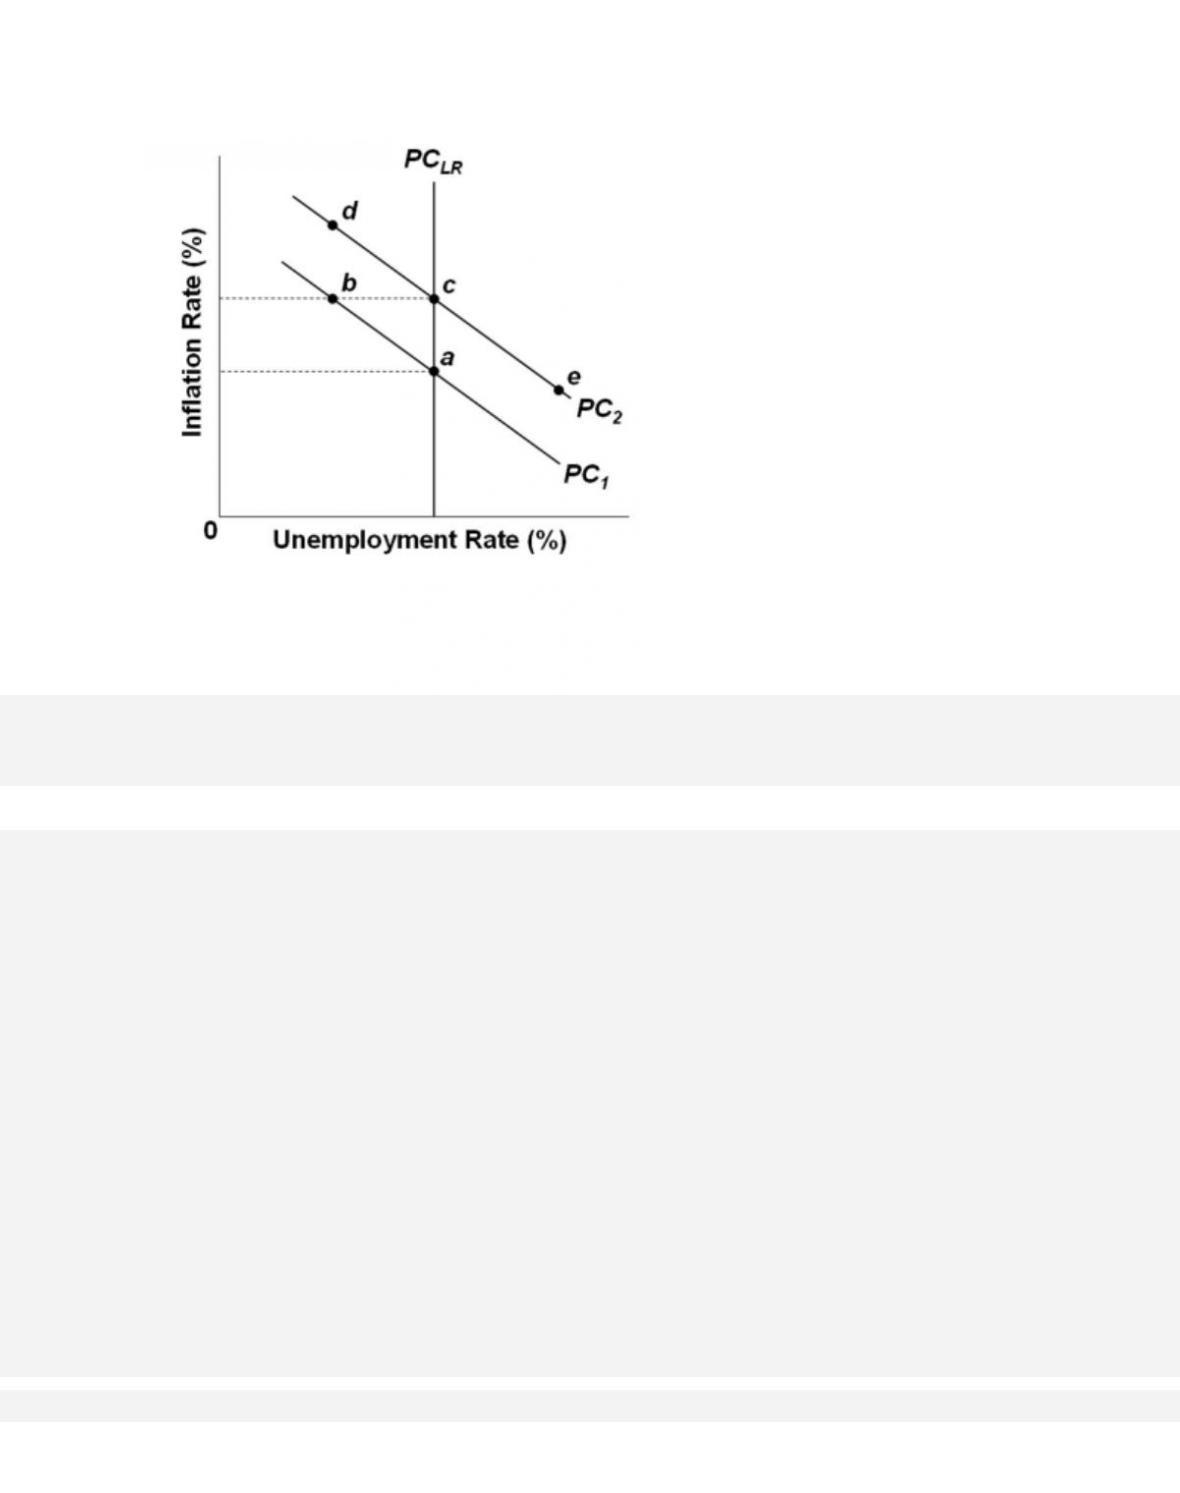
98.
Refer to the diagram. The move of the economy from c to e on short-run Phillips Curve PC2
would be explained by an
99.
Which of the following is a tenet of supply-side economics?
38–68
Copyright © 2018 McGraw-Hill Education. All rights reserved. No reproduction or distribution without the prior
written consent of McGraw-Hill Education.
AACSB: Knowledge Application
Access i b i lity: Keyboard Navigation
Blooms: Understand
Difficu l t y : 02 Medium
Learning Objective: 38-05 Explain the relationship between tax rates, tax revenues, and
aggregate supply.
Test Bank: I
Topic: Taxation and Aggregate Supply
100.
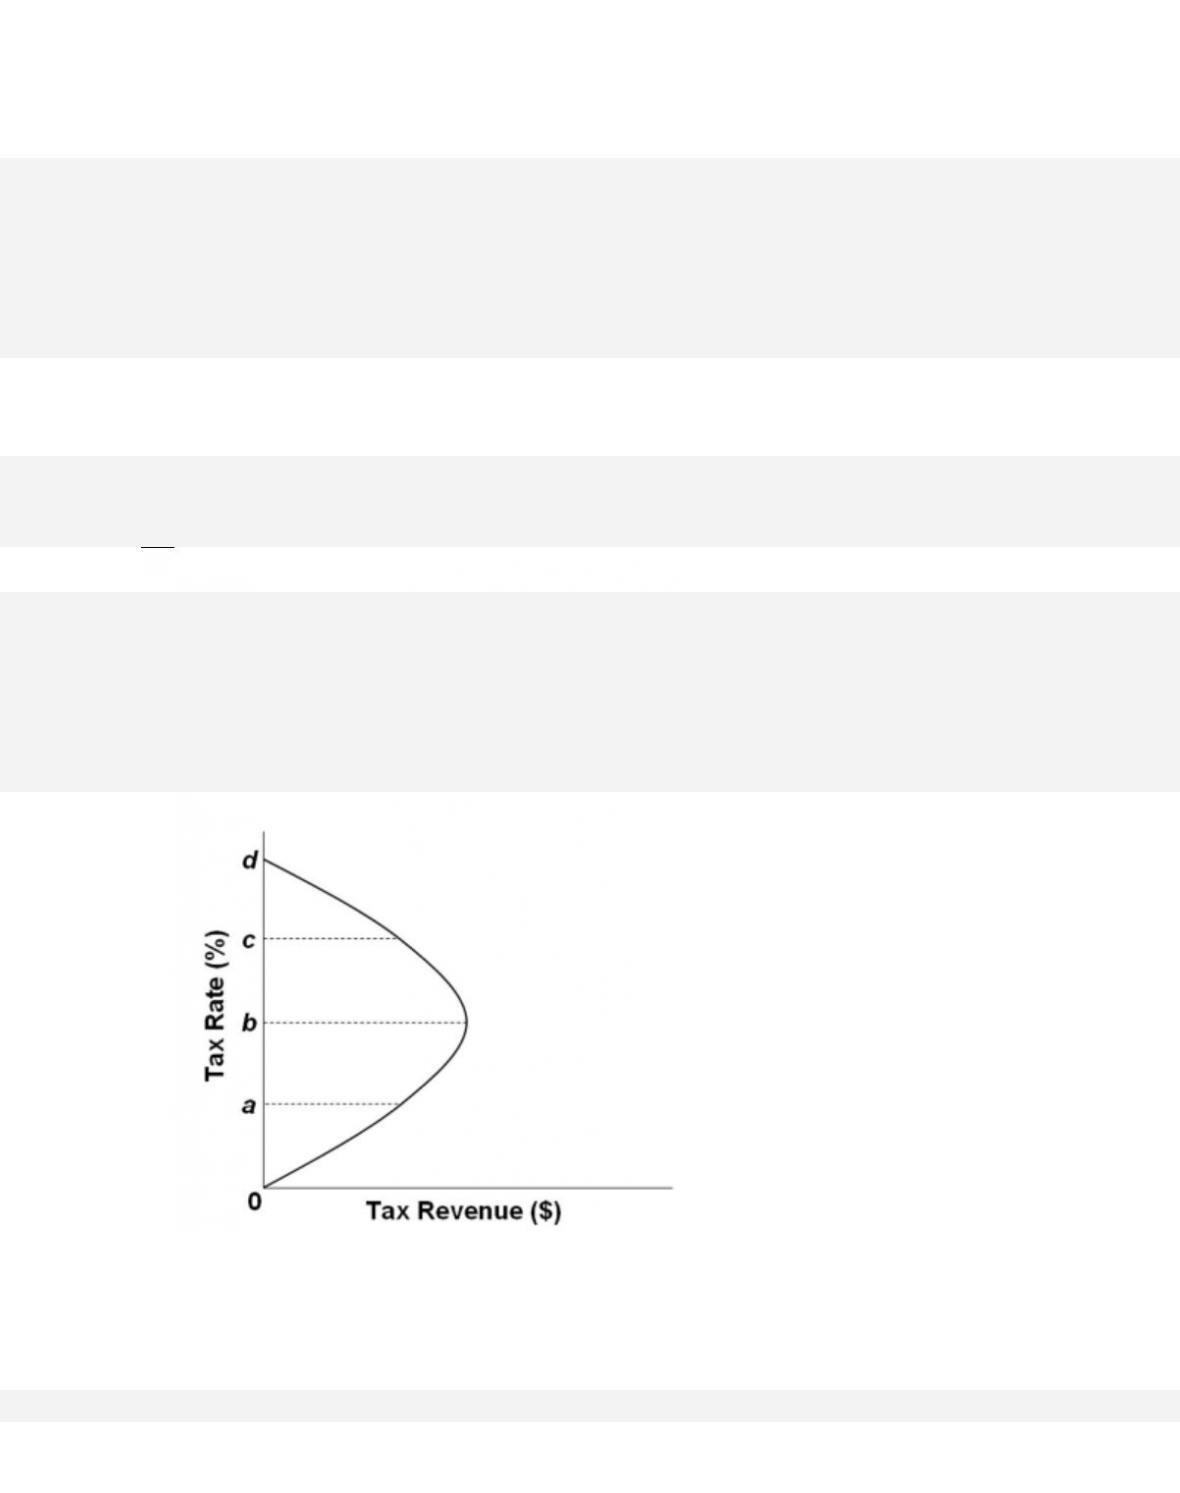
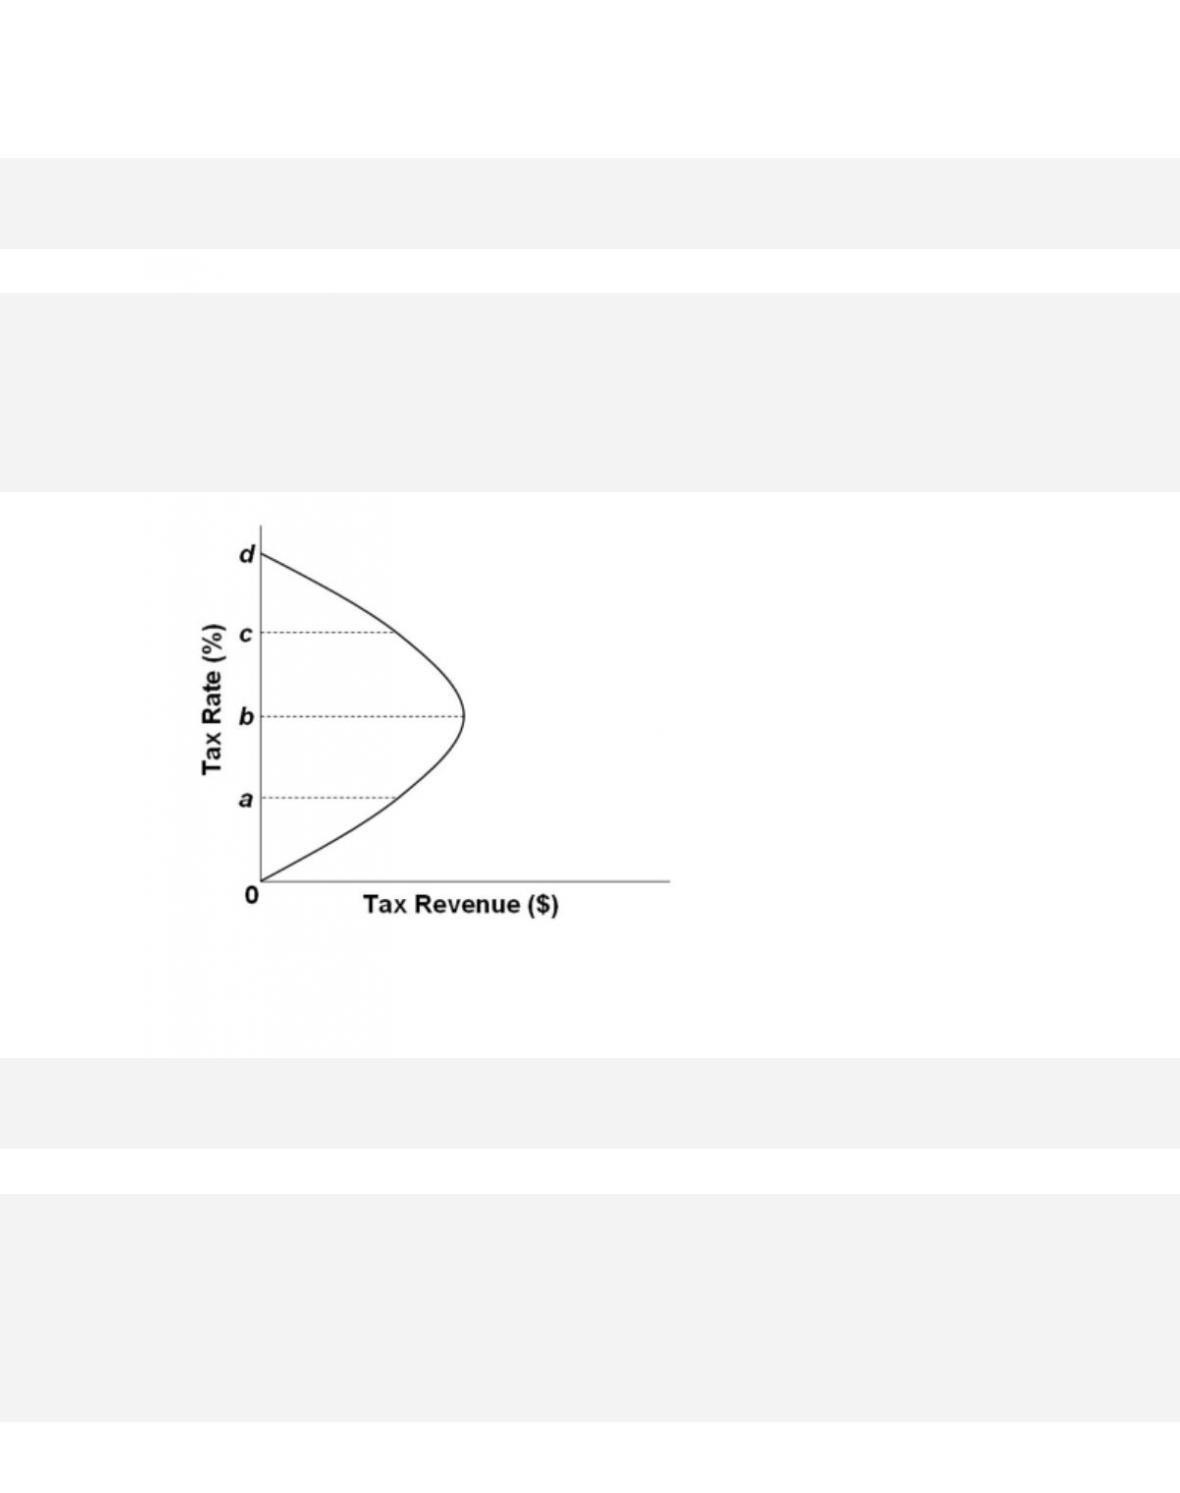
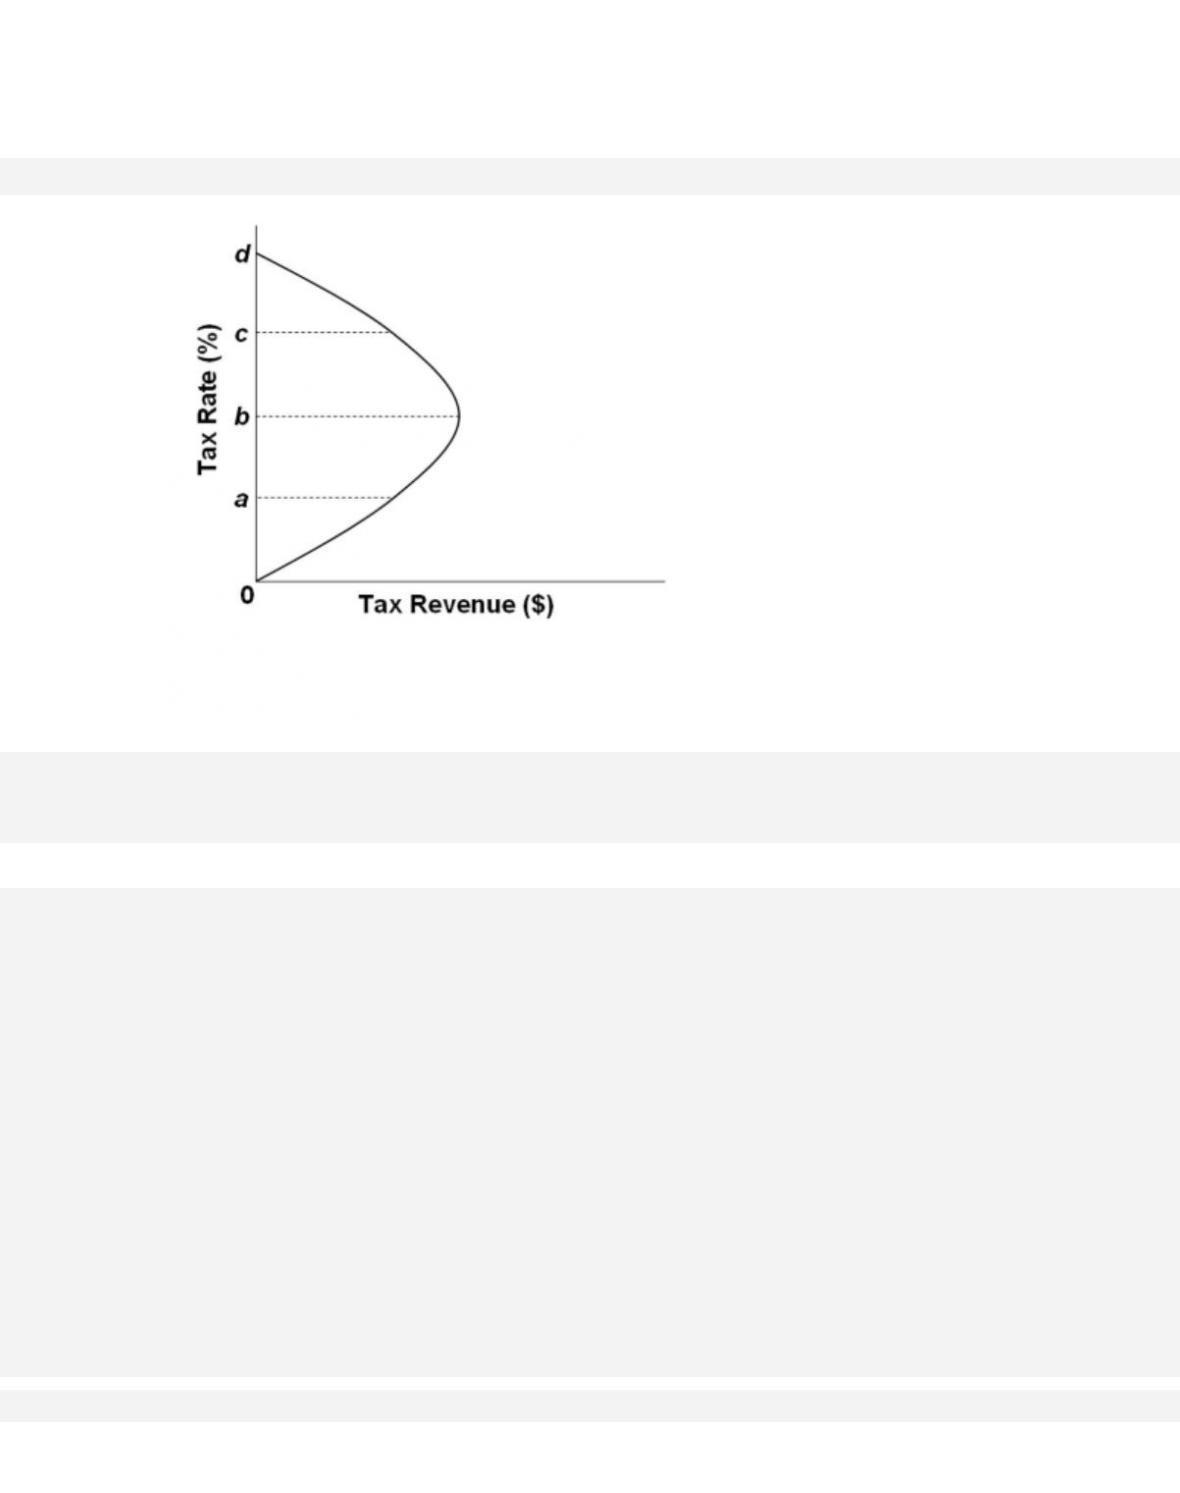
The Laffer Curve is a central concept in
101.
The given curve is known as the
38–69
Copyright © 2018 McGraw-Hill Education. All rights reserved. No reproduction or distribution without the prior
written consent of McGraw-Hill Education.
A.
Taylor rule.
B.
Okun Curve.
C.
Laffer Curve.
D. Phillips Curve.
102.
Refer to the diagram. Supply-side economists believe that tax rates are typically
38–70
Copyright © 2018 McGraw-Hill Education. All rights reserved. No reproduction or distribution without the prior
written consent of McGraw-Hill Education.
Topic: Taxation and Aggregate Supply
Type: Graph
103.
In the curve, a decline in the tax rate from c to b would
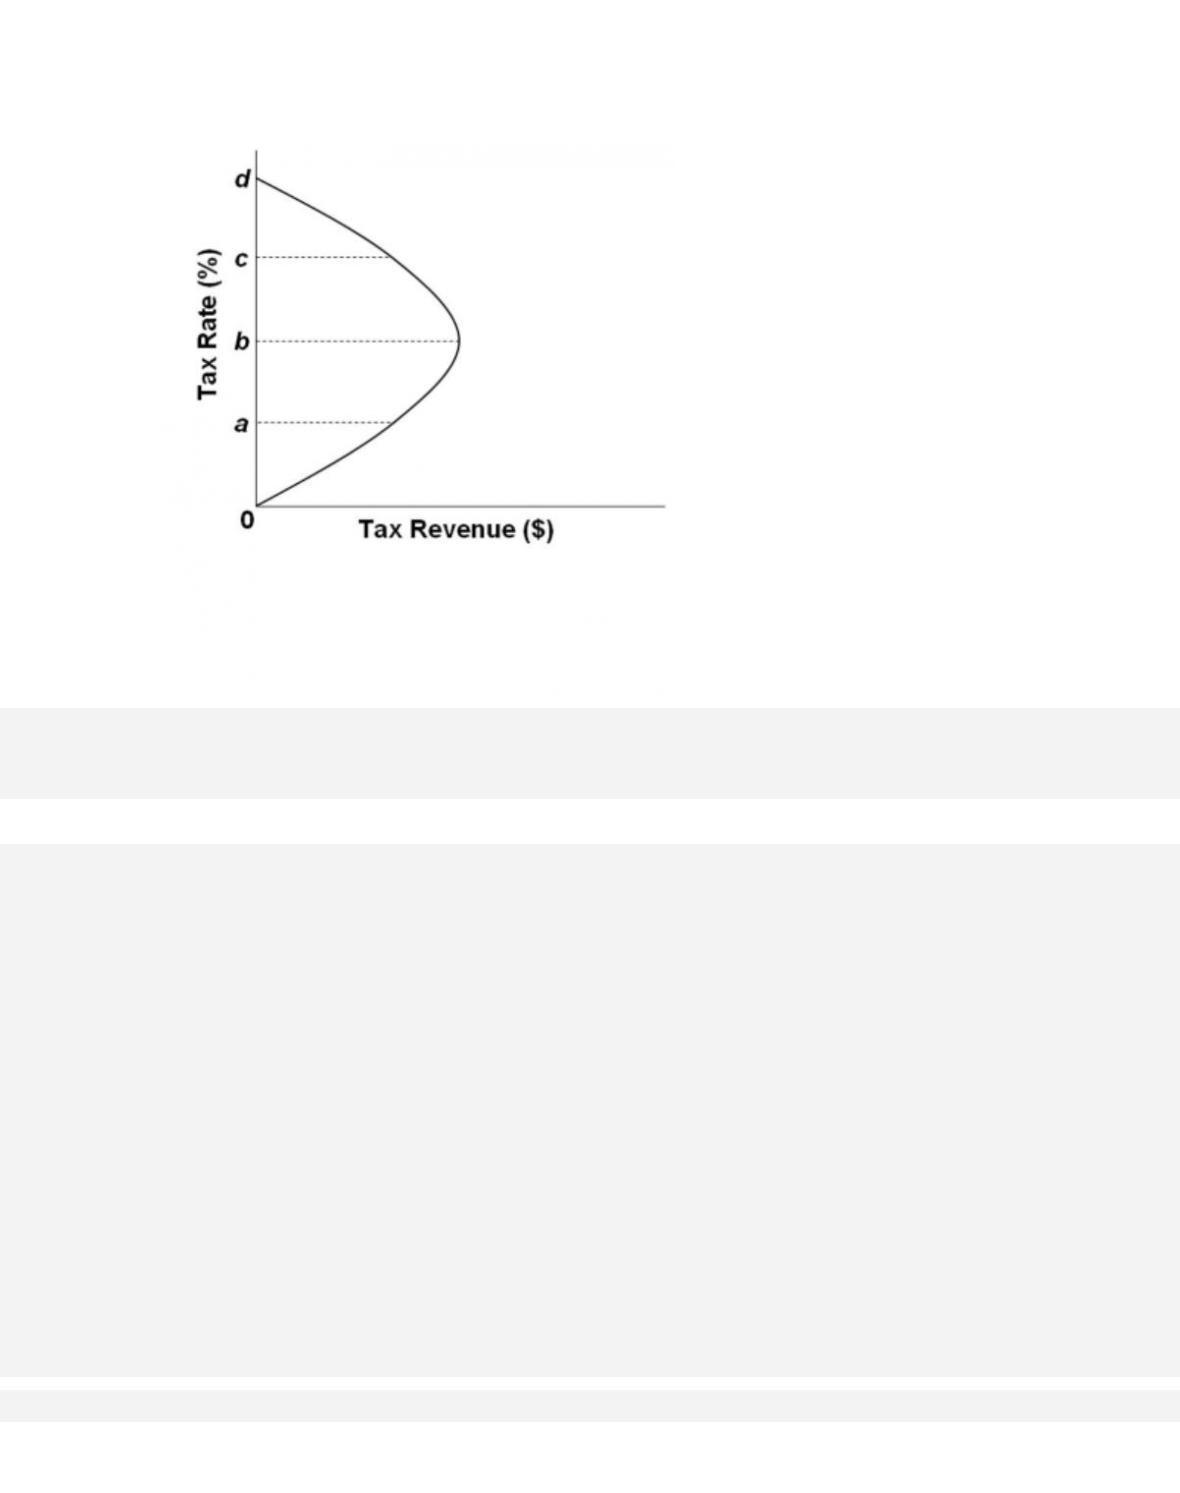
104.
Refer to the diagram. If the tax rate is currently c and the government wants to maximize tax
revenue, it should
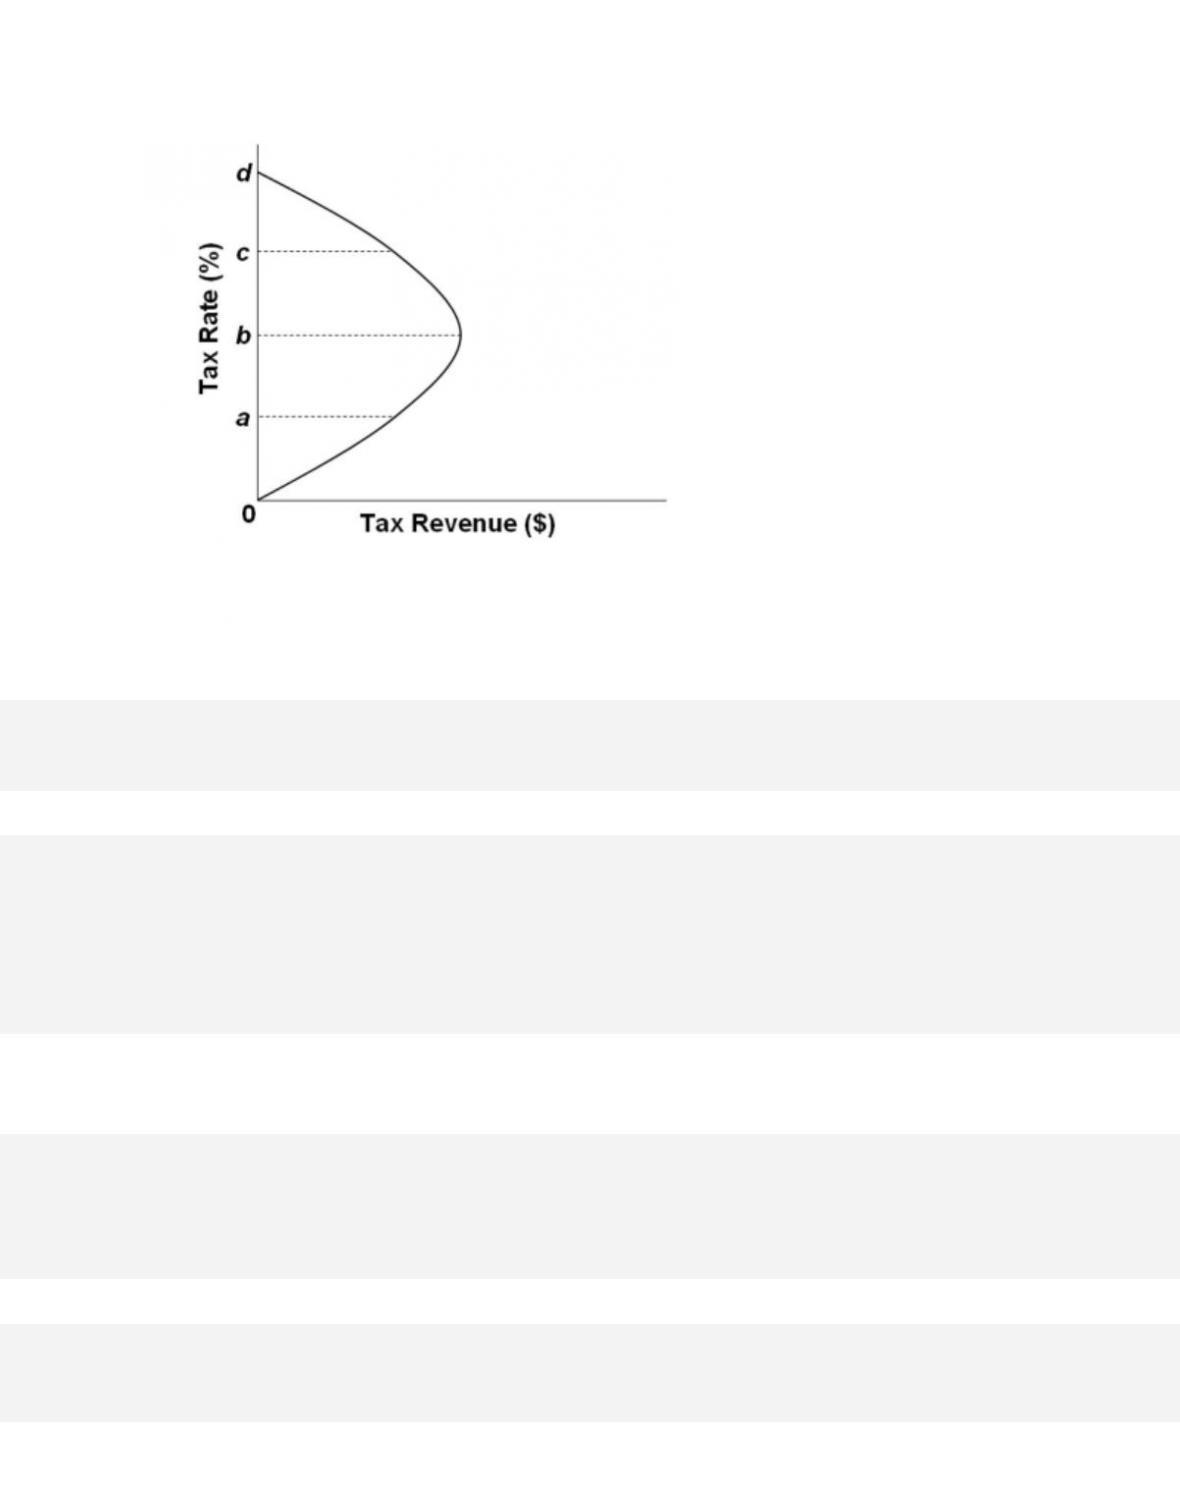
105.
Refer to the diagram. The general agreement of most economists is that the U.S. economy
today is
106.
Supply-side economist Arthur Laffer has argued that

38–73
Copyright © 2018 McGraw-Hill Education. All rights reserved. No reproduction or distribution without the prior
written consent of McGraw-Hill Education.
Access i b i lity: Keyboard Navigation
Blooms: Understand
Difficu l t y : 02 Medium
Learning Objective: 38-05 Explain the relationship between tax rates, tax revenues, and
aggregate supply.
Test Bank: I
Topic: Taxation and Aggregate Supply
107.
A basic criticism of supply-side economics is that
108.
Critics of supply-side economics

109.
Average Tax Rate
Tax Revenue ($B)
20%
$250
40
300
60
250
80
200
If graphed, the relationship shown would depict this economy‘s
110.
Average Tax Rate
Tax Revenue ($B)
20%
$250
40
300
60
250
80
200
Refer to the table. If the current tax rate is 60 percent, supply-side economists would
advocate

38–75
Copyright © 2018 McGraw-Hill Education. All rights reserved. No reproduction or distribution without the prior
written consent of McGraw-Hill Education.
Blooms: Understand
Difficu l t y : 02 Medium
Learning Objective: 38-05 Explain the relationship between tax rates, tax revenues, and
aggregate supply.
Test Bank: I
Topic: Taxation and Aggregate Supply
Type: Table
111.
In 1993 the federal government boosted income tax rates. In the seven years that
followed,
112.
In 1993 the federal government boosted income tax rates. The change in tax revenue
that occurred in the seven years that followed
113.
(Consider This) The ideas of economist Arthur Laffer became the centerpiece for tax
policy during the

114.
(Consider This) Economist Arthur Laffer equated Robin Hood to
115.
(Last Word) According to the research of Christina Romer and David Romer,

38–77
Copyright © 2018 McGraw-Hill Education. All rights reserved. No reproduction or distribution without the prior
written consent of McGraw-Hill Education.
Learning Objective: 38-05 Explain the relationship between tax rates, tax revenues, and
aggregate supply.
Test Bank: I
Topic: Taxation and Aggregate Supply
116.
(Last Word) According to the research of Christina Romer and David Romer, tax
increases implemented to reduce an inherited budget
deficit
True / False Questions
117.
The short-run aggregate supply curve is vertical, and the long-run aggregate supply
curve is horizontal.
118.
The short-run aggregate supply curve shifts to the left when nominal wages rise in
response to price level increases.

38–78
Copyright © 2018 McGraw-Hill Education. All rights reserved. No reproduction or distribution without the prior
written consent of McGraw-Hill Education.
AACSB: Knowledge Application
Access i b i lity: Keyboard Navigation
Blooms: Understand
Difficu l t y : 02 Medium
Learning Objective: 38-01 Explain the relationship between short-run aggregate supply and
long-run aggregate supply.
Test Bank: I
Topic: From Short Run to Long Run
119.
In the extended AD–AS model, the long-run aggregate supply curve is vertical.
120.
Demand-pull inflation and cost-push inflation are identical concepts because both
involve lower unemployment rates and rising prices.
121.
The Phillips Curve suggests an inverse relationship between increases in the price level
and the level of employment.

38–79
Copyright © 2018 McGraw-Hill Education. All rights reserved. No reproduction or distribution without the prior
written consent of McGraw-Hill Education.
AACSB: Knowledge Application
Access i b i lity: Keyboard Navigation
Blooms: Understand
Difficu l t y : 02 Medium
Learning Objective: 38-03 Explain the short-run trade-off between inflation and unemployment
(the Phillips Curve).
Test Bank: I
Topic: The Inflation-Unemployment Relationship
122.
A shift in the Phillips Curve to the left will improve the short-run inflation-
unemployment choices available to society.
123.
A rightward and upward shift of the Phillips Curve is consistent with the occurrence of
stagflation.
124.
There is no trade-off between unemployment and inflation in the long run.

38–80
Copyright © 2018 McGraw-Hill Education. All rights reserved. No reproduction or distribution without the prior
written consent of McGraw-Hill Education.
Difficu l t y : 02 Medium
Learning Objective: 38-04 Discuss why there is no long-run trade-off between inflation and
unemployment.
Test Bank: I
Topic: The Long-Run Phillips Curve
125.
The Laffer Curve shows the trade-off between the price level and tax rates.
126.
The Laffer Curve underlies the contention that lower tax rates need not reduce tax
revenues.
127.
Year
Average
Hourly Wage
Rates
Index of
Industrial
Production
Unemployment
Rate
Price
Level
Index
Rate of Increase in
Productivity
1997
$6.40
197
5.5%
130
3.0%
1998
6.72
199
5.8
133
2.9
1999
7.24
196
7.2
139
3.1
2000
8.02
192
8.3
147
2.8