
38–21
Copyright © 2018 McGraw-Hill Education. All rights reserved. No reproduction or distribution without the prior
written consent of McGraw-Hill Education.
Blooms: Understand
Difficu l t y : 02 Medium
Learning Objective: 38-01 Explain the relationship between short-run aggregate supply and
long-run aggregate supply.
Test Bank: I
Topic: From Short Run to Long Run
30.
The natural rate of unemployment
31.
In the extended aggregate demand-aggregate supply model,
32.
In the extended aggregate demand-aggregate supply model,
33.
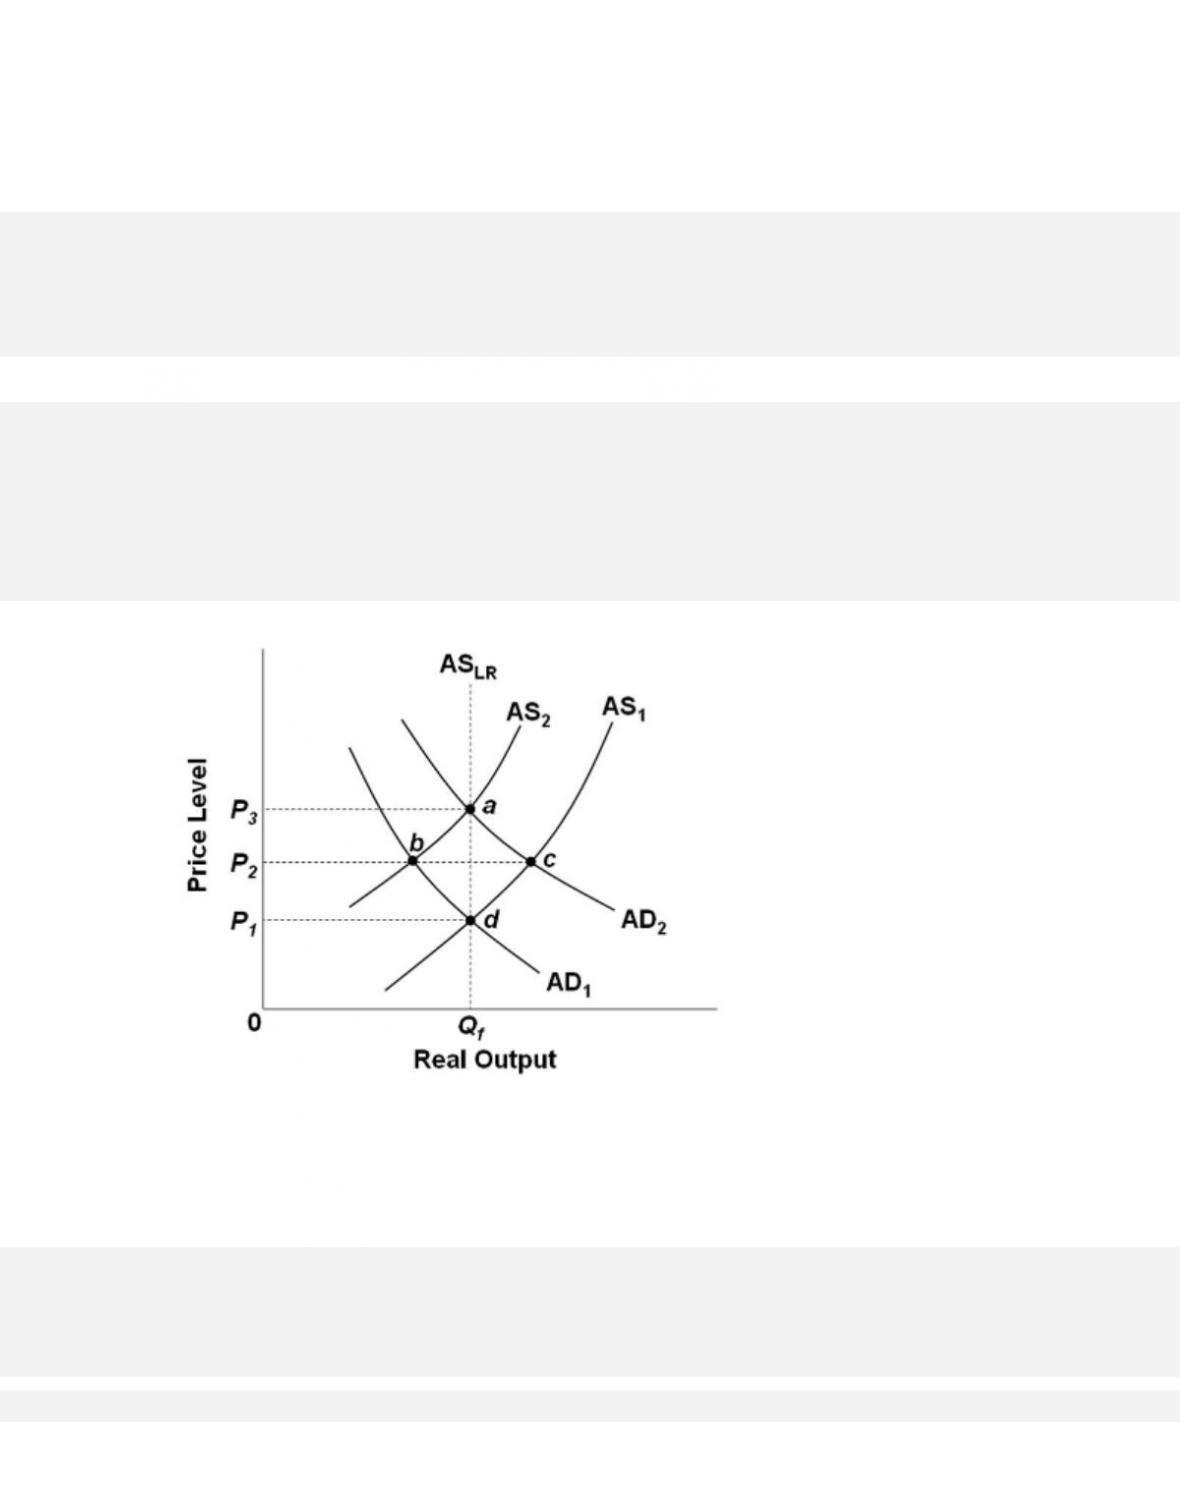
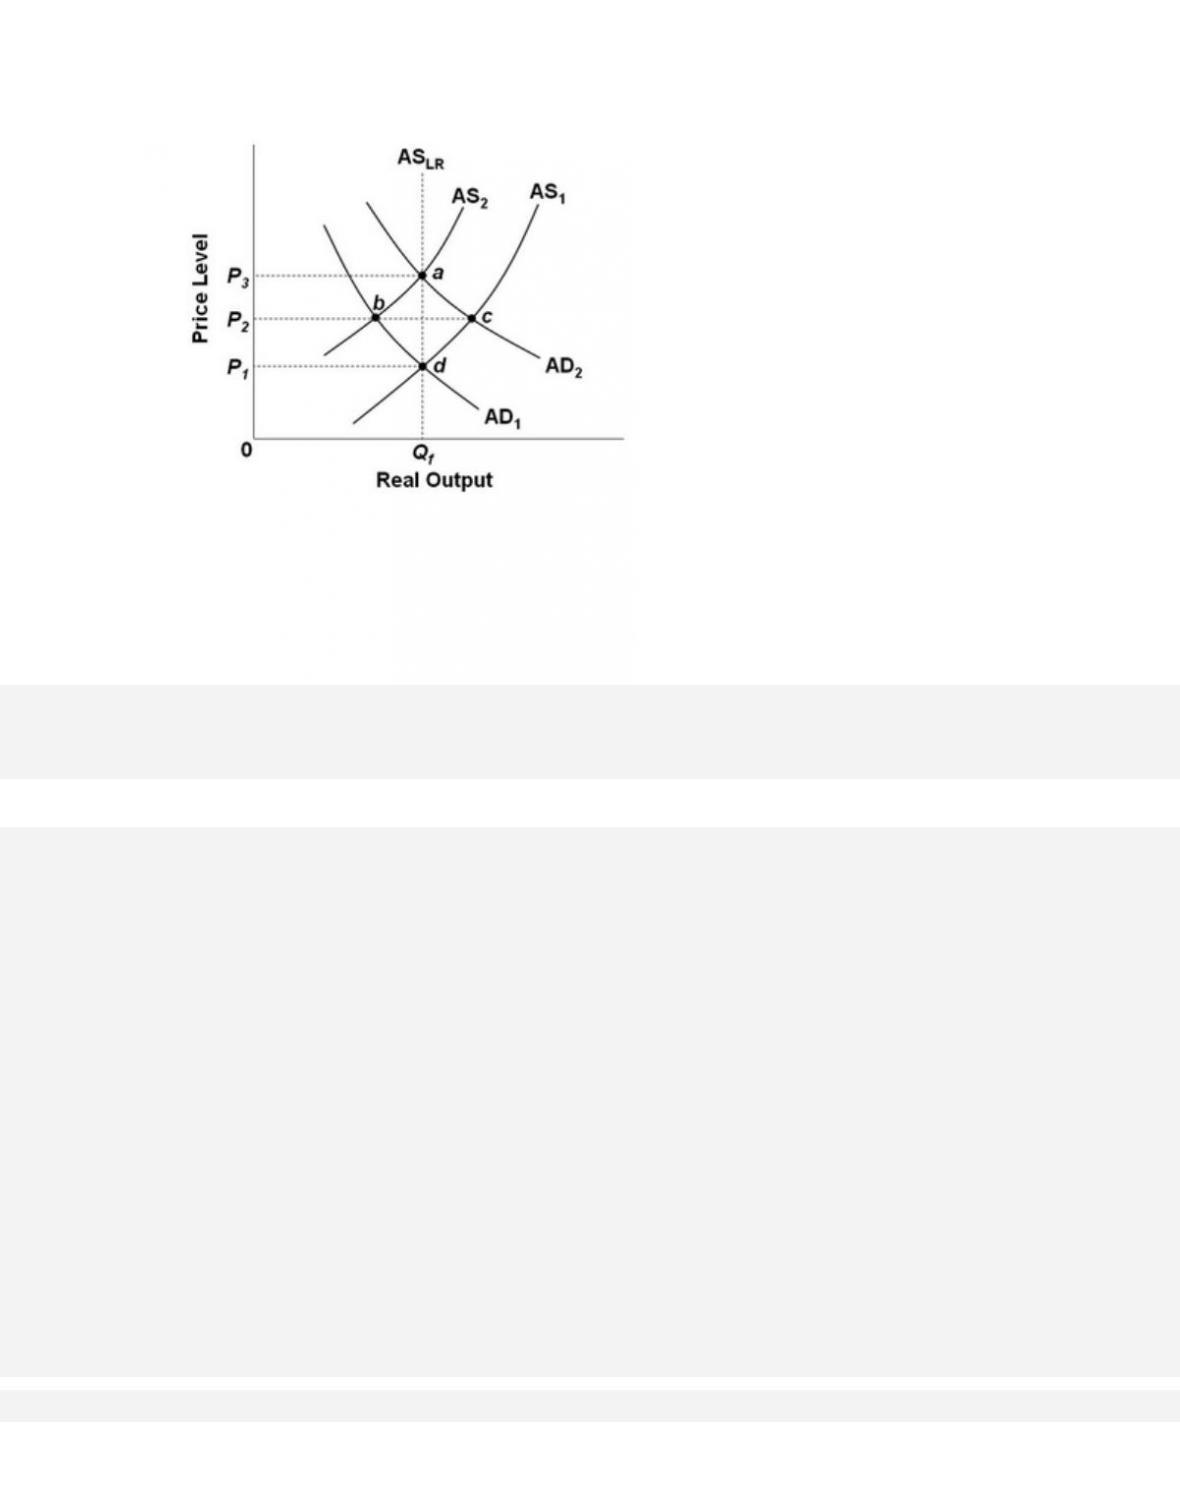
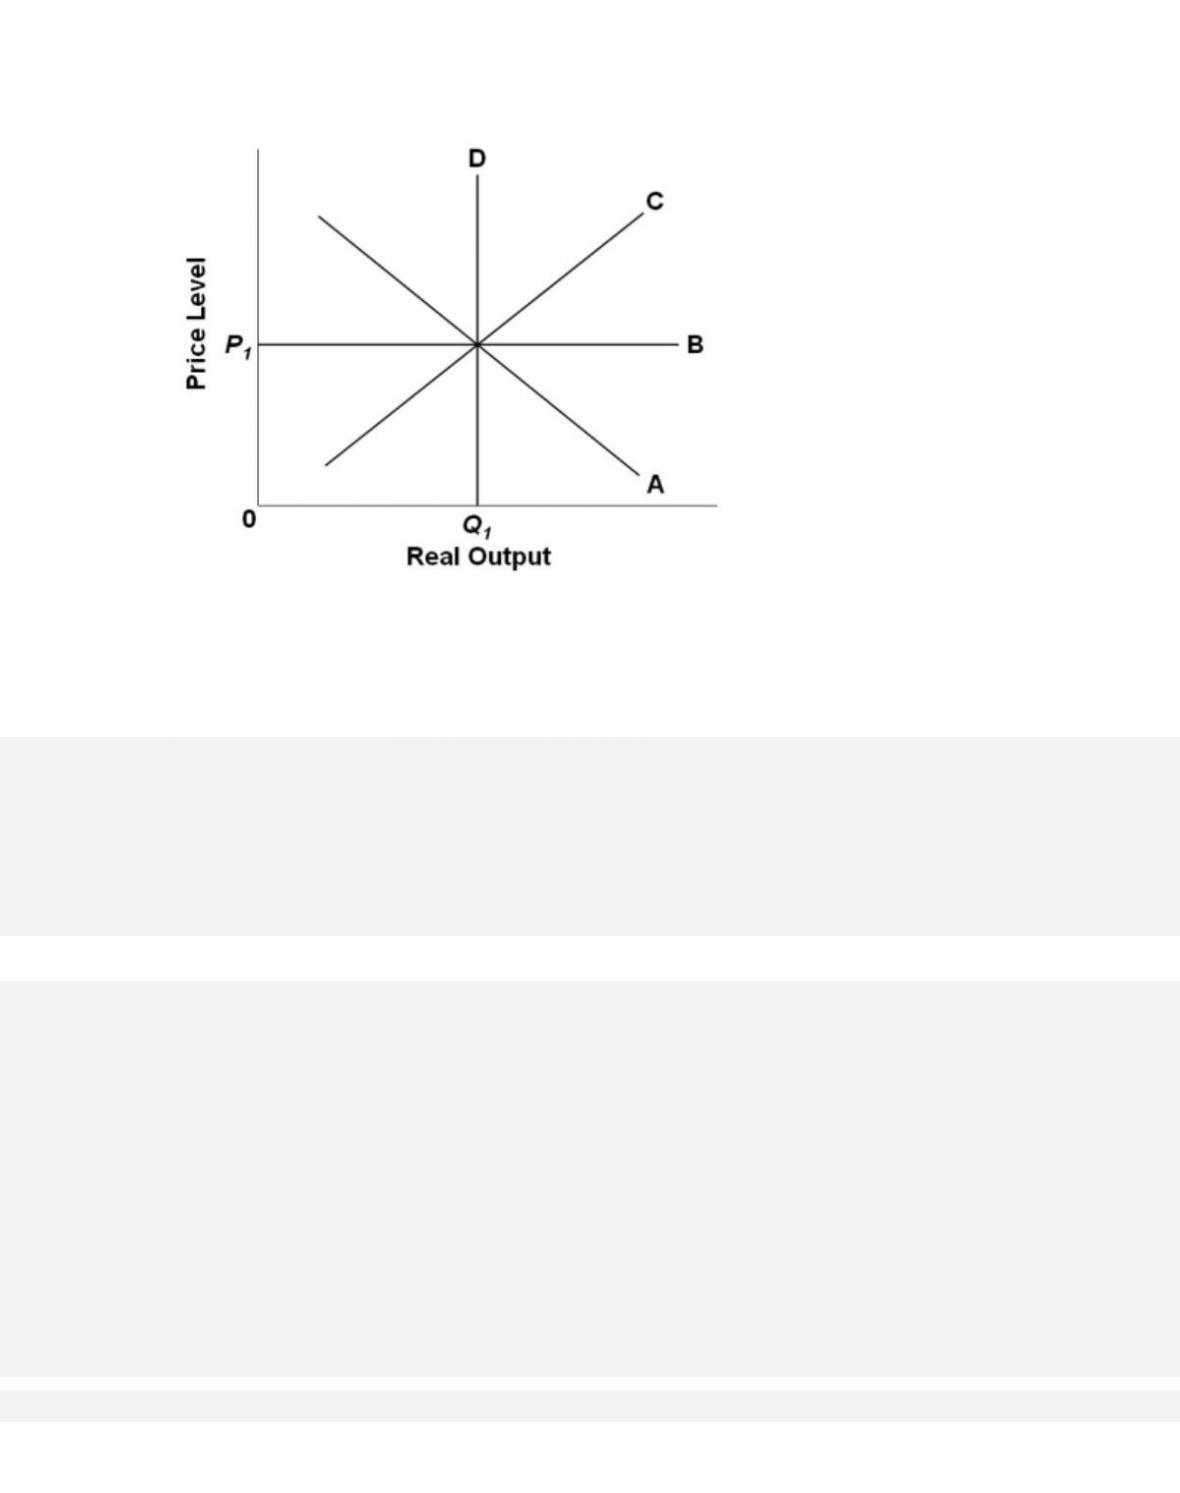
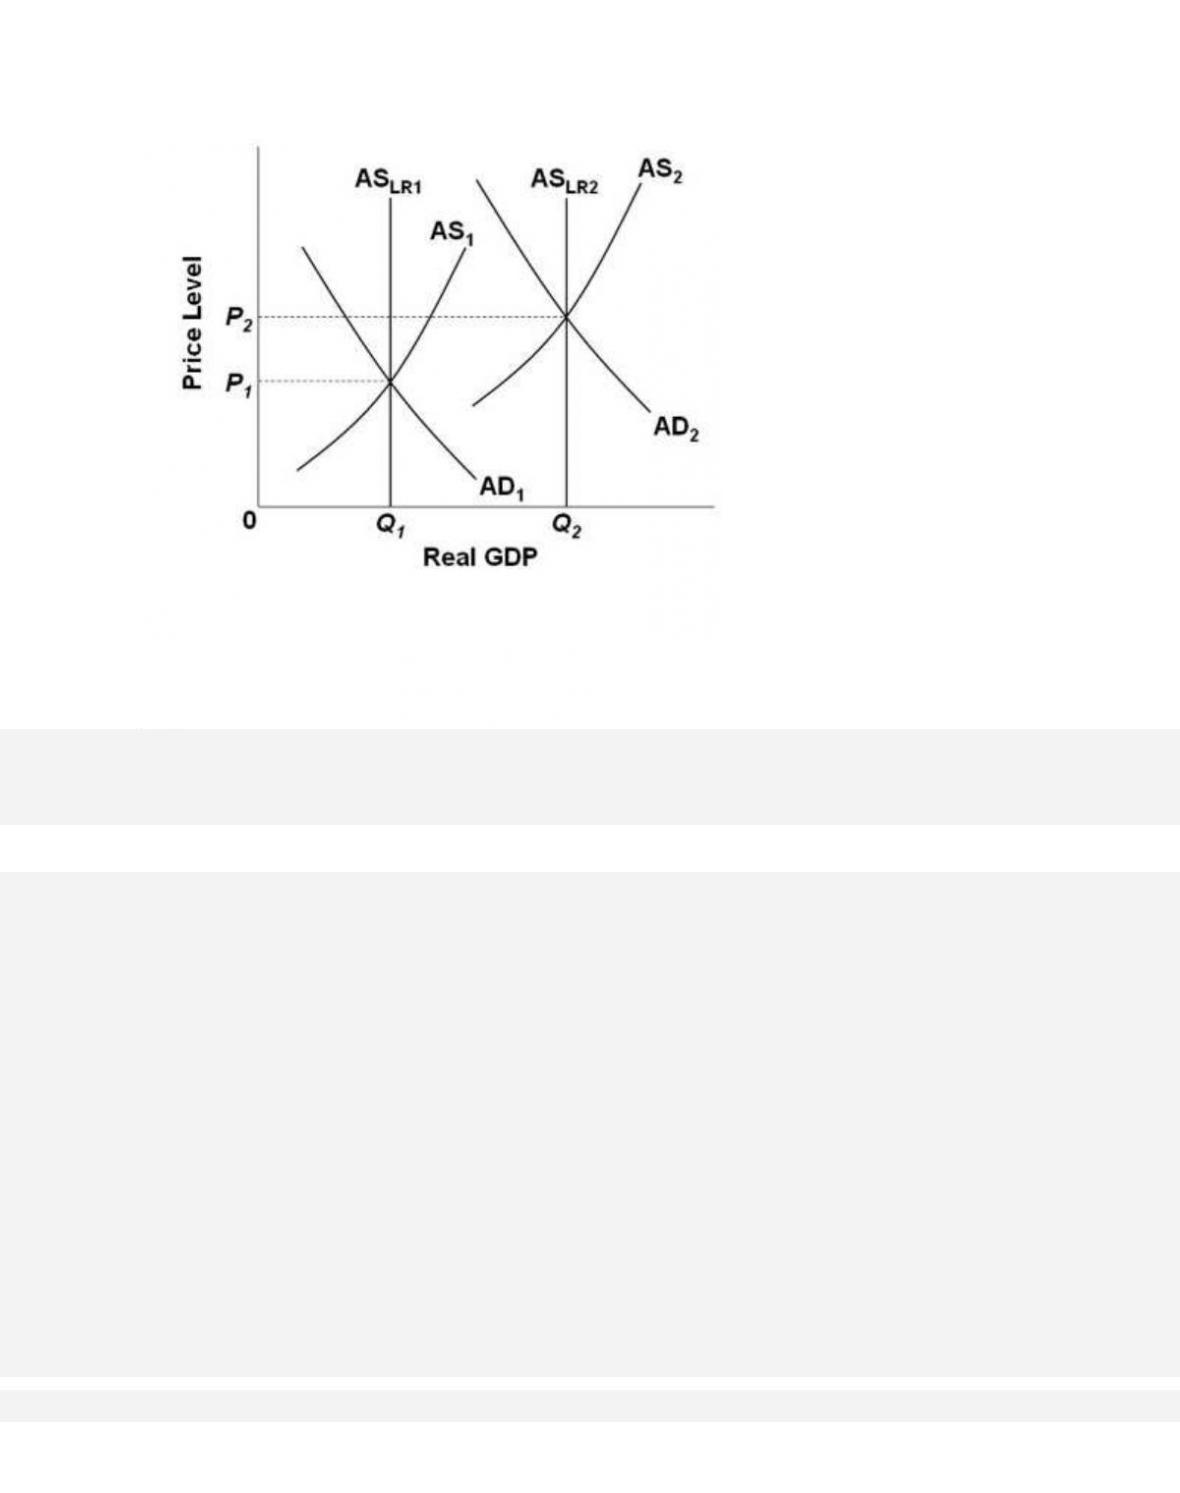
Refer to the diagram. The initial aggregate demand curve is AD1, and the initial aggregate
supply curve is AS1. Demand-pull inflation in
the short run is best shown as
34.
Refer to the diagram. The initial aggregate demand curve is AD1, and the initial aggregate
supply curve is AS1. In the long run, demand-
pull inflation is best shown as
38–24
Copyright © 2018 McGraw-Hill Education. All rights reserved. No reproduction or distribution without the prior
written consent of McGraw-Hill Education.
Test Bank: I
Topic: Applying the Extended AD–AS Model
Type: Graph
35.
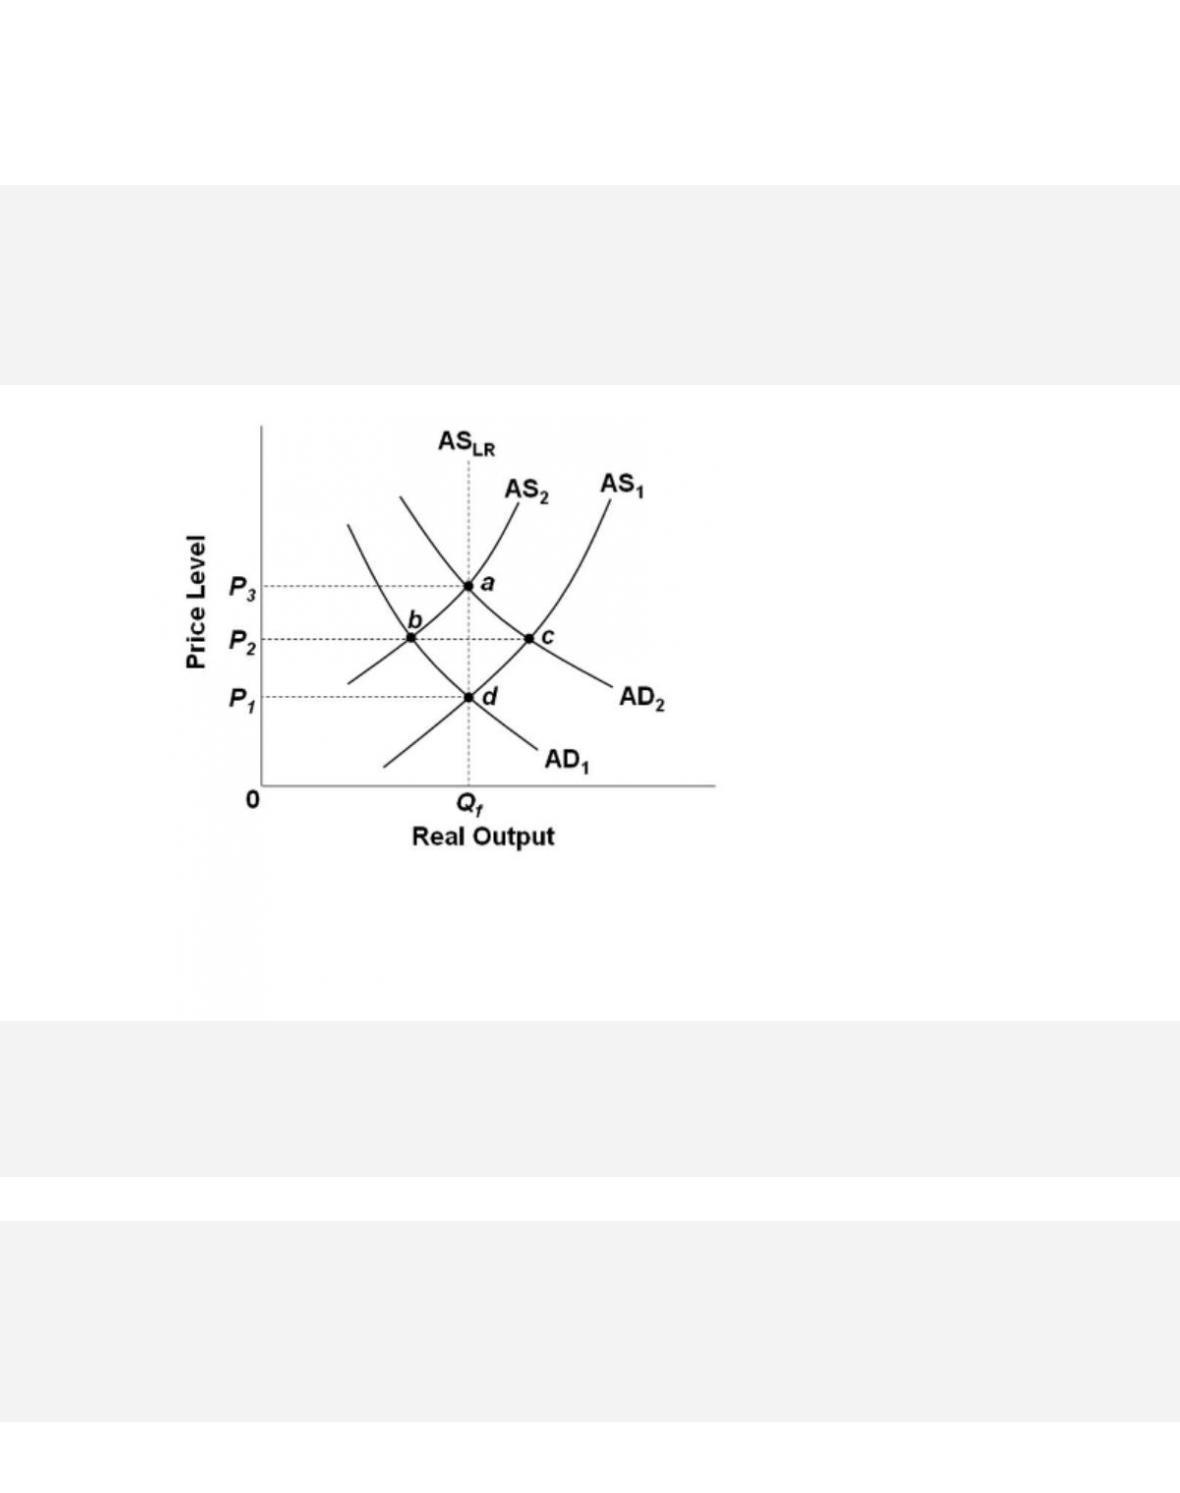
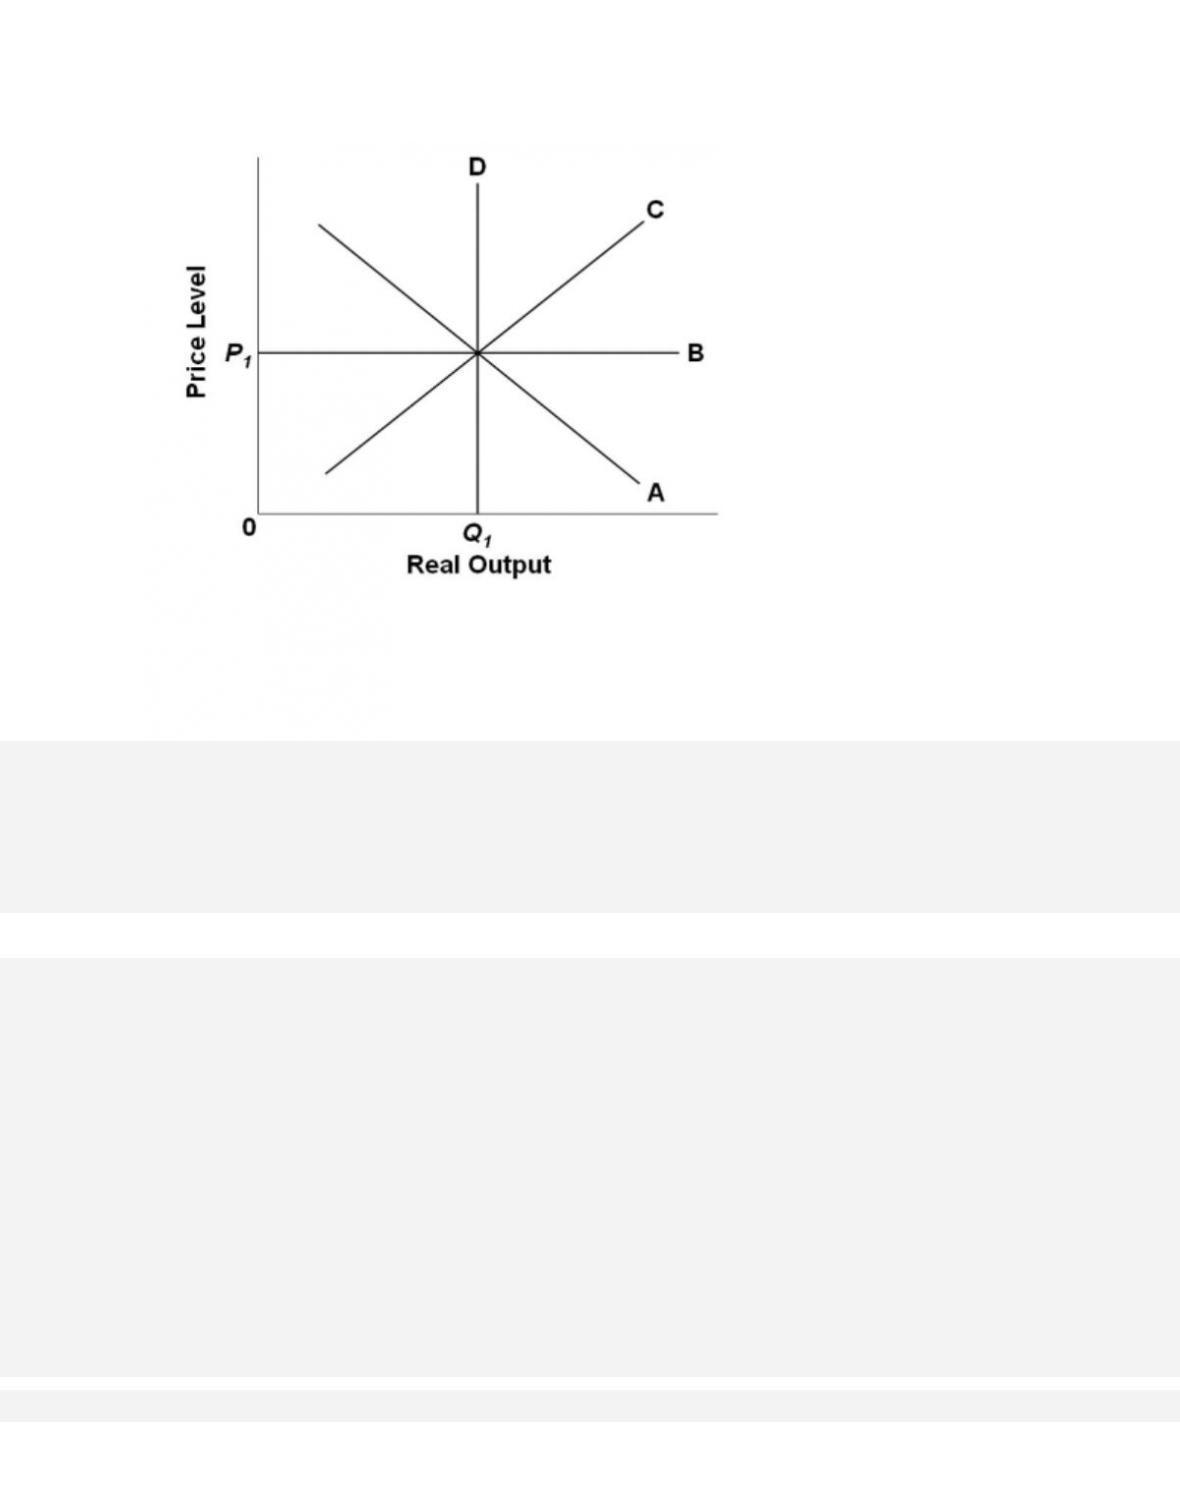
Refer to the diagram. The initial aggregate demand curve is AD1, and the initial aggregate
supply curve is AS1. In the long run, the
aggregate supply curve is vertical in the diagram
because
36.
Refer to the diagram. The initial aggregate demand curve is AD1 and the initial aggregate
supply curve is AS1. Cost-push inflation in the
short run is best represented as a
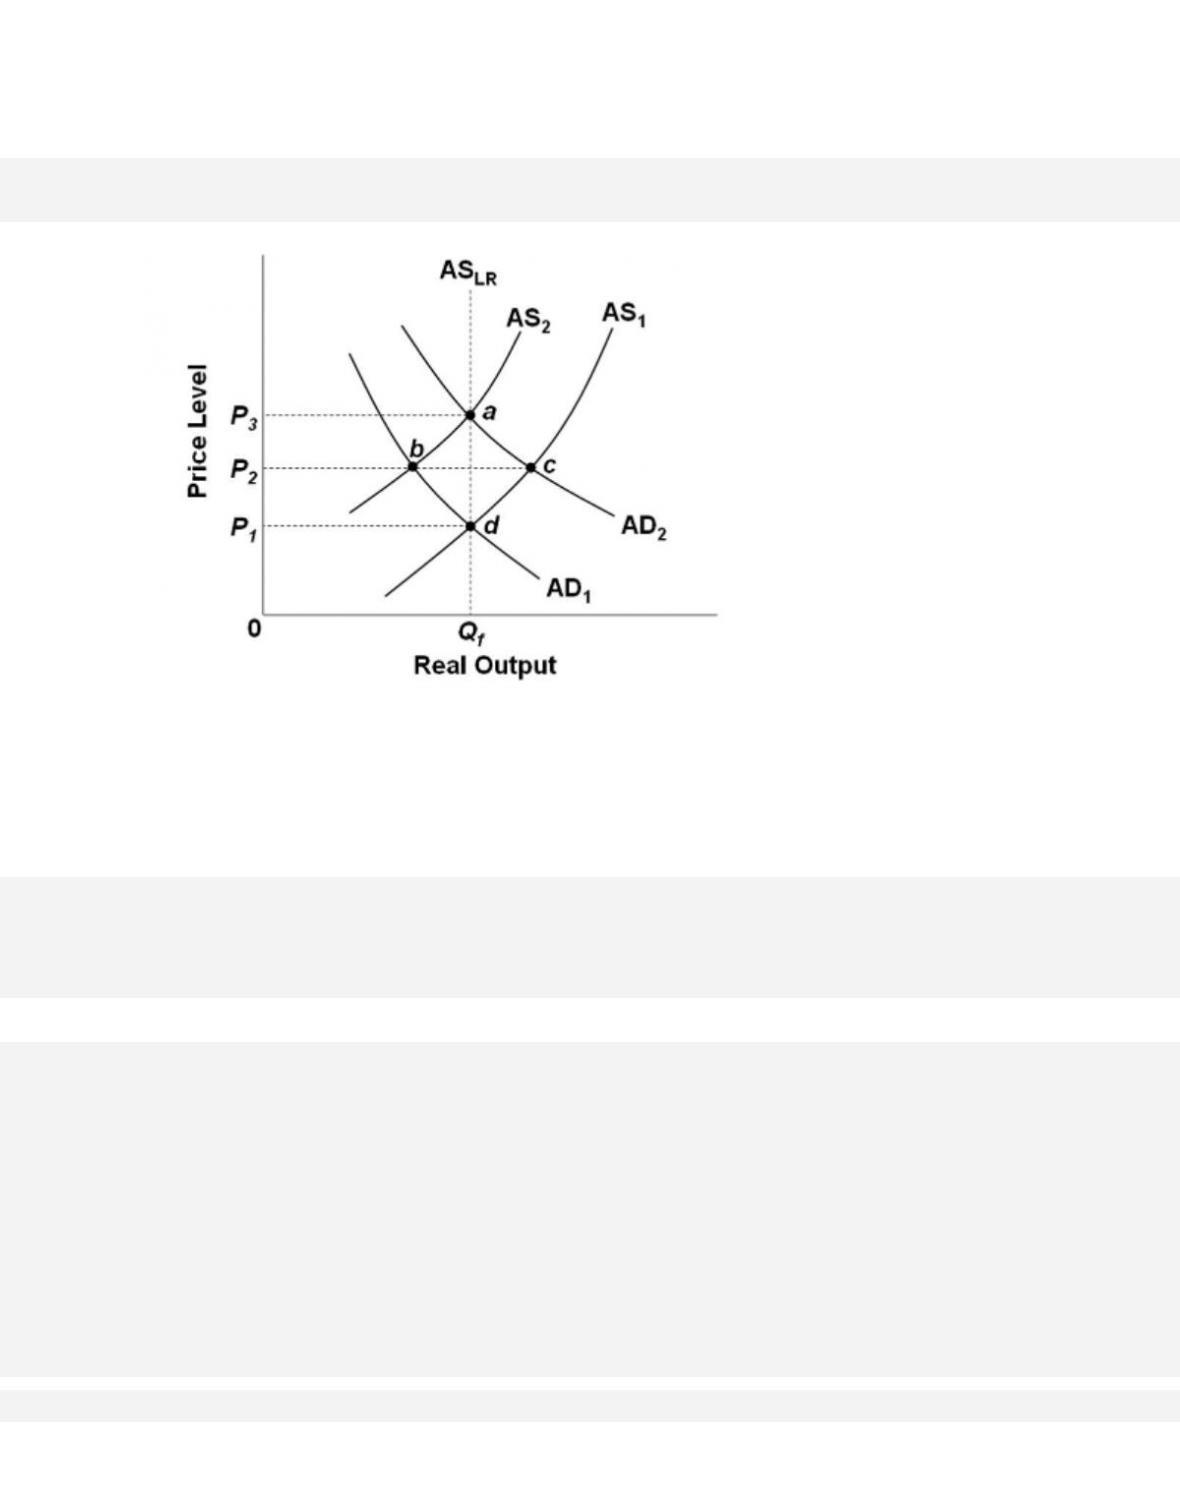
37.
Refer to the diagram. The initial aggregate demand curve is AD1, and the initial aggregate
supply curve is AS1. Assuming no change in
aggregate demand, the long-run response to a
recession caused by cost-push inflation is best depicted as a
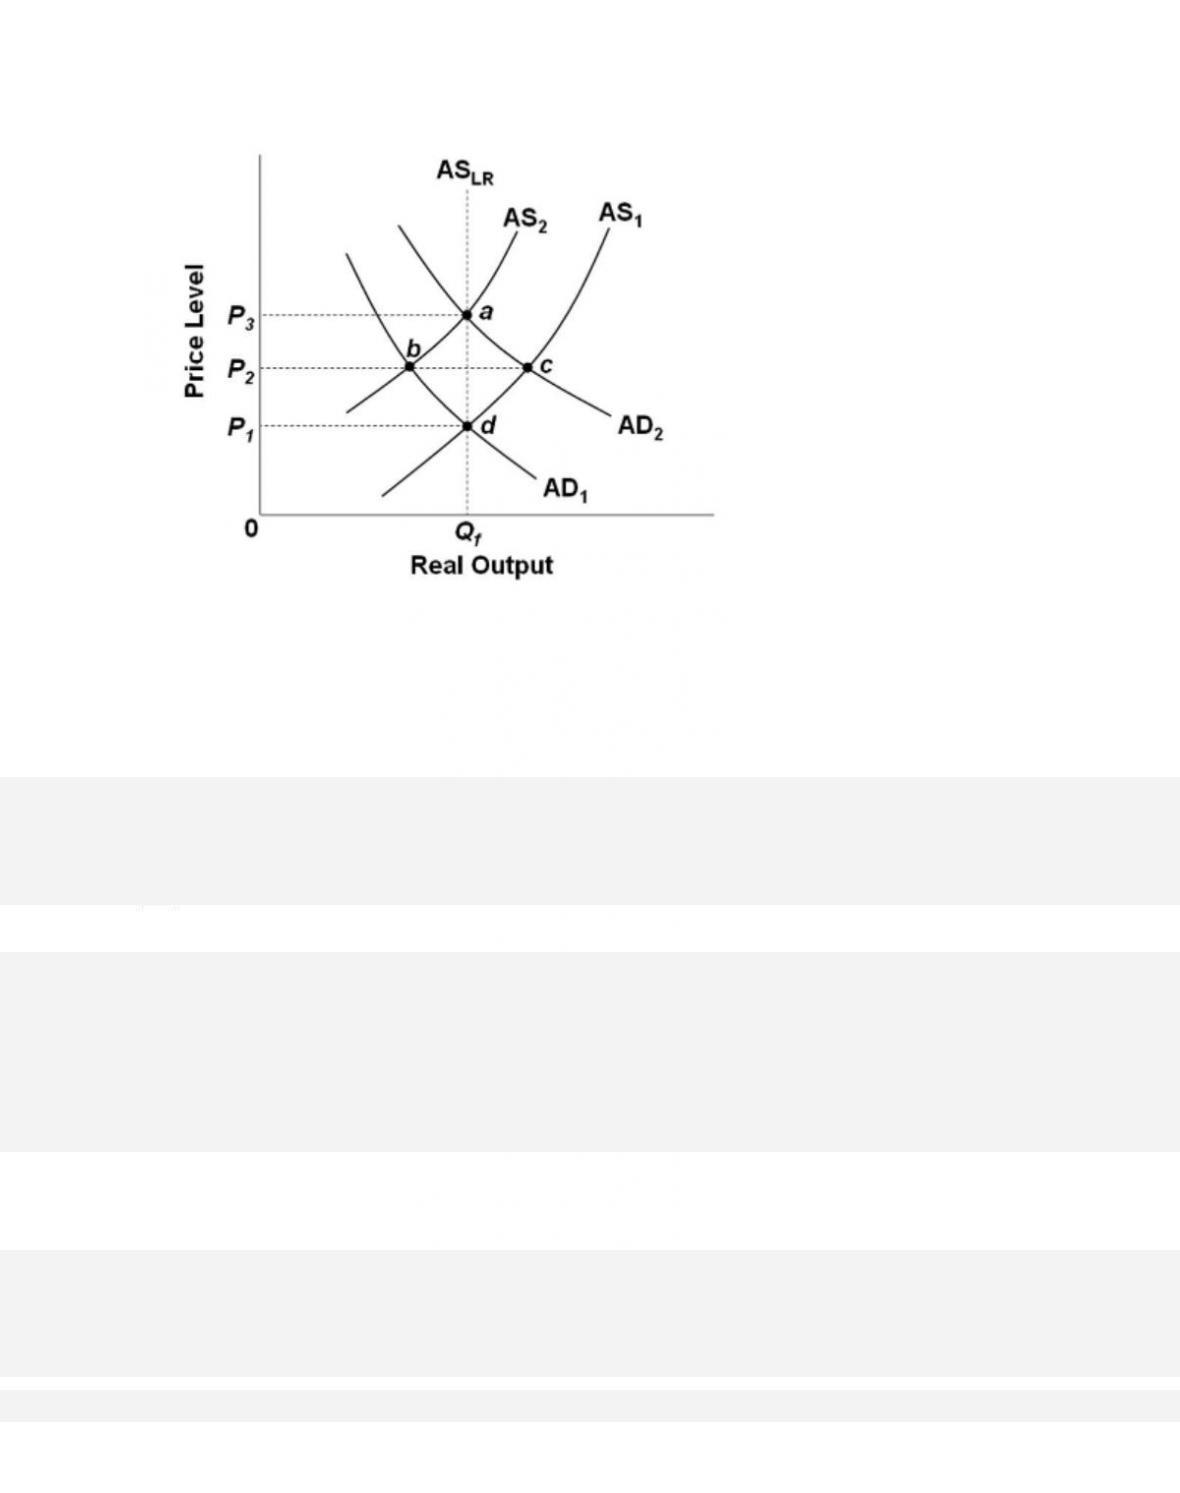
38.
Refer to the diagram. The initial aggregate demand curve is AD1, and the initial aggregate
supply curve is AS1. If government offsets the
decline in real output resulting from short-
run cost-push inflation by increasing aggregate demand from AD1 to AD2,
39.
If government uses fiscal policy to restrain cost-push inflation, we can expect

40.
One policy dilemma posed by cost-push inflation is that
41.
If government uses its stabilization policies to maintain full employment under
conditions of cost-push inflation,

42.
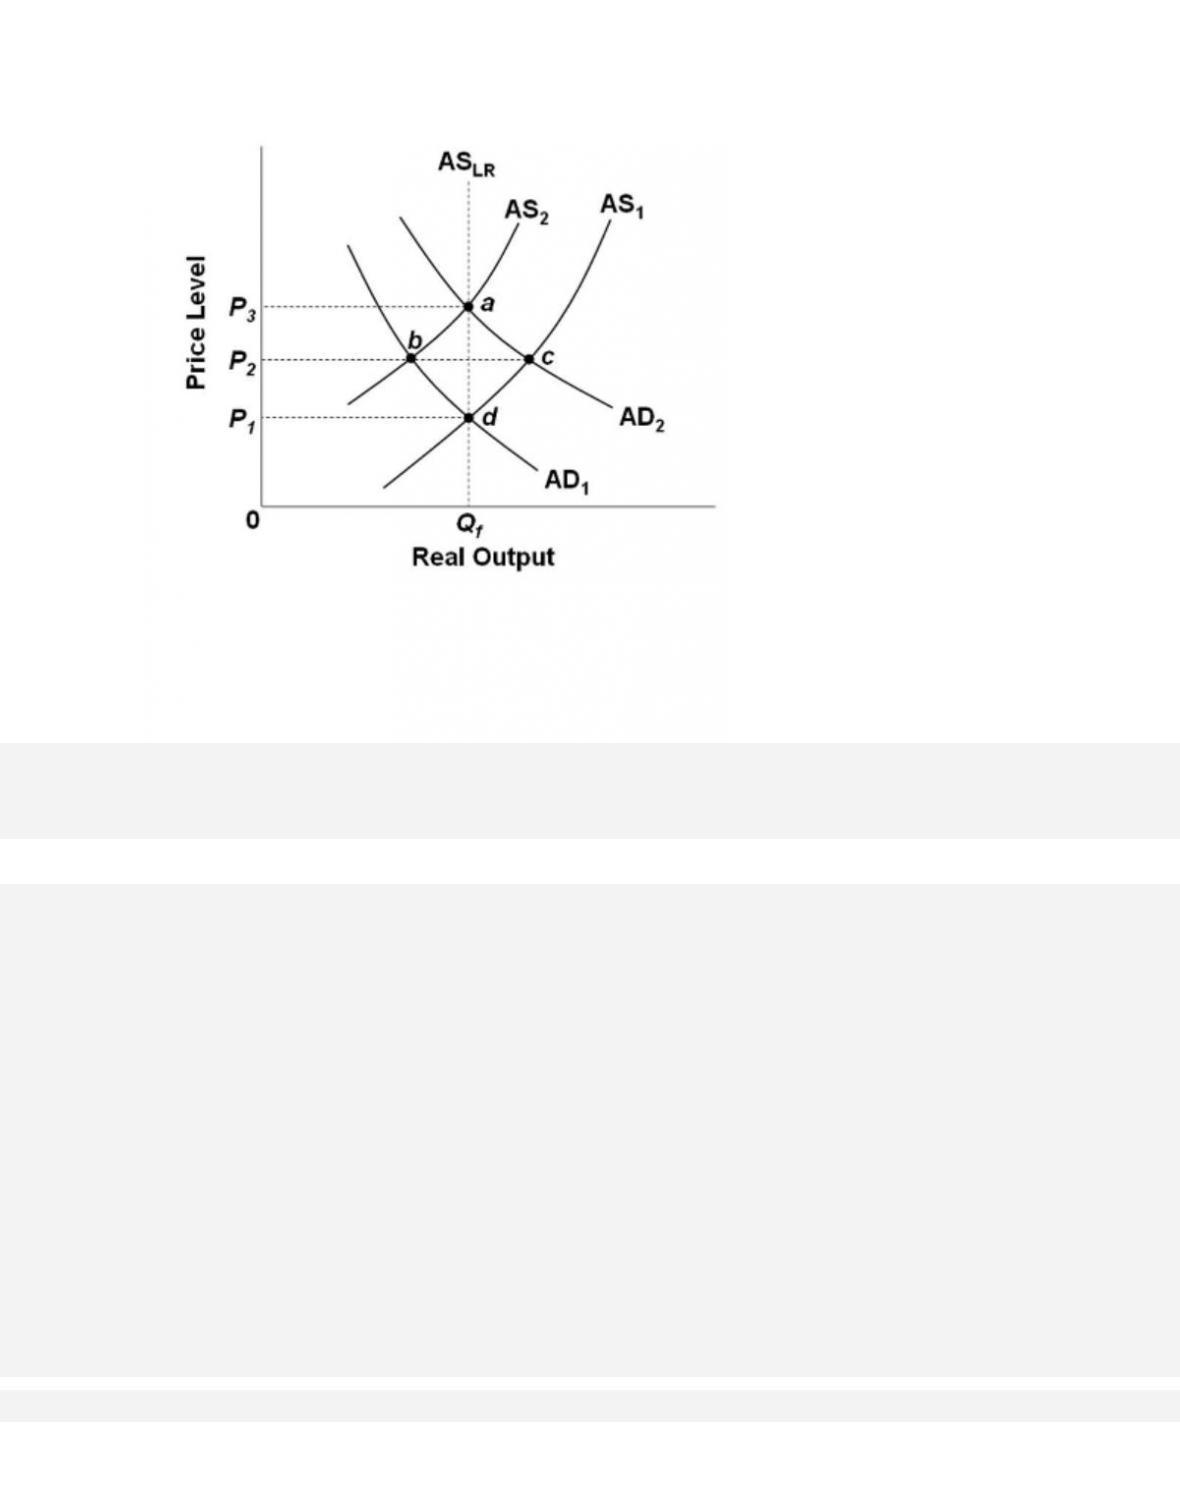
Refer to the diagram and assume that prices and wages are flexible both upward and
downward in the economy. In the extended AD–AS
model,
43.
Refer to the diagram and assume that prices and wages are flexible both upward and
downward in the economy. In the extended AD–AS
model,
44.
Refer to the diagram and assume that prices and wages are flexible both upward and
downward in the economy. In the extended AD–AS
model,
45.
Refer to the diagram and assume that prices and wages are flexible both upward and
downward in the economy. In the extended AD–AS
model,
46.
Refer to the diagram. Assume both upward and downward price and wage flexibility in the
economy. In the extended AD-AS model,
47.
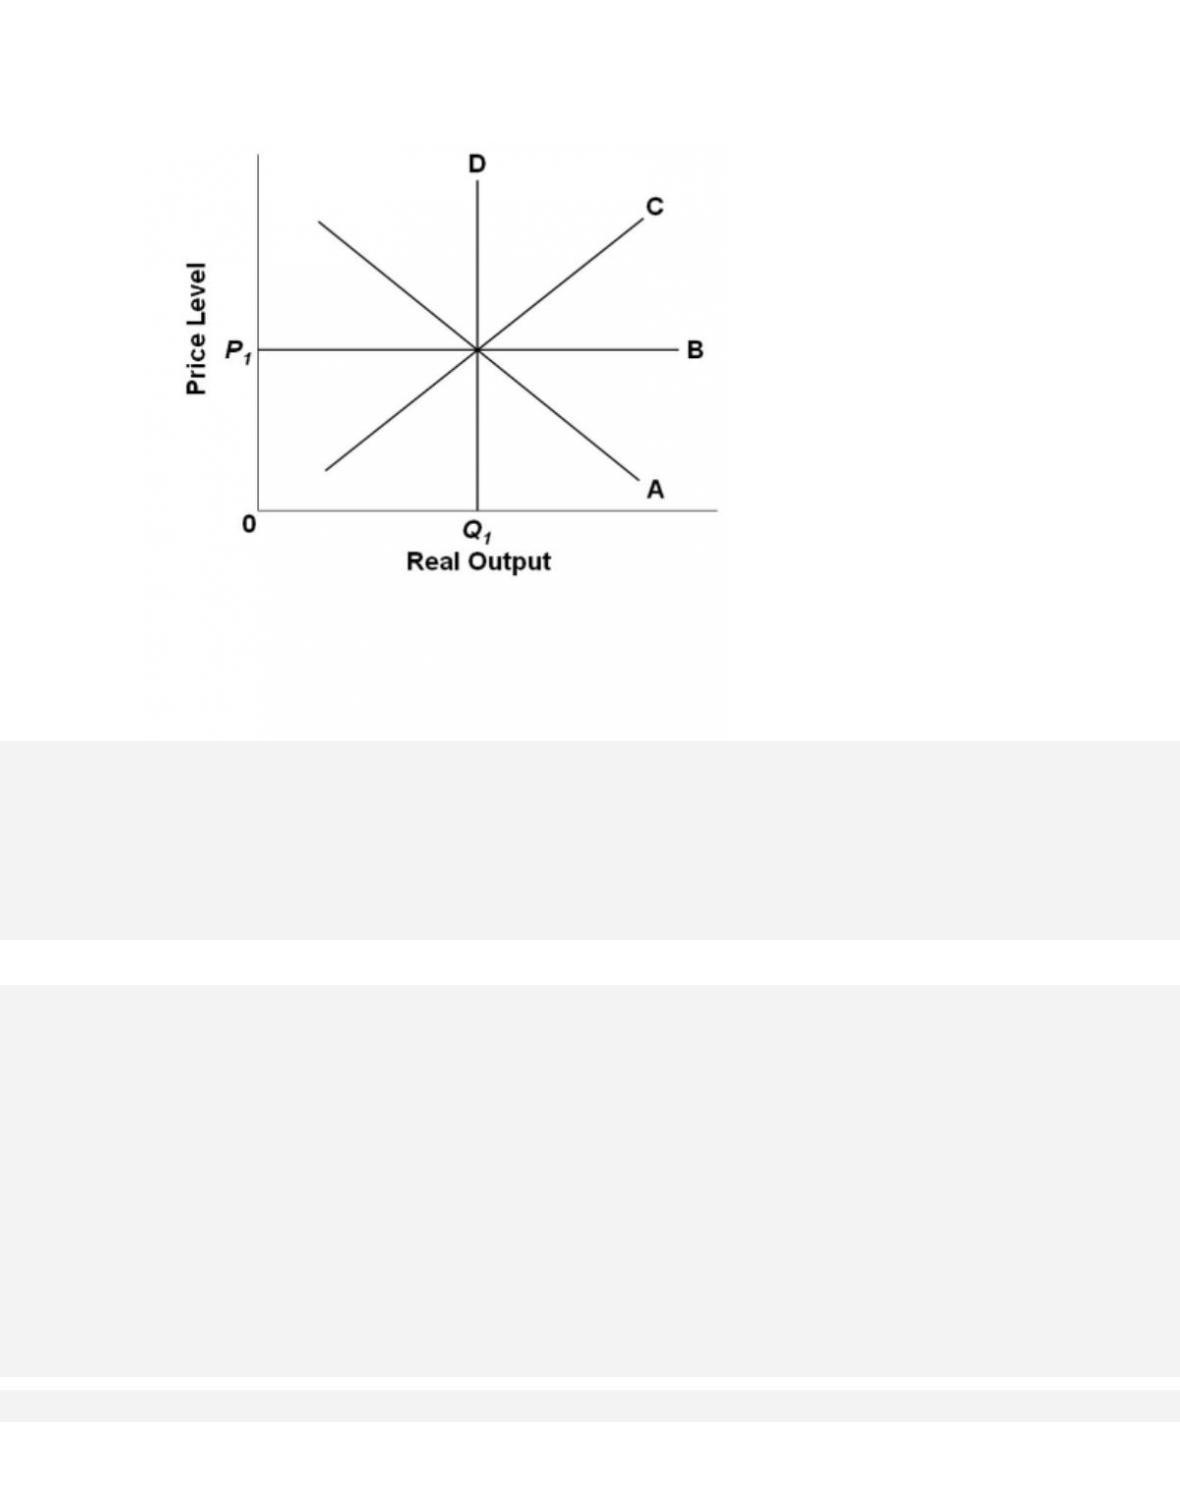
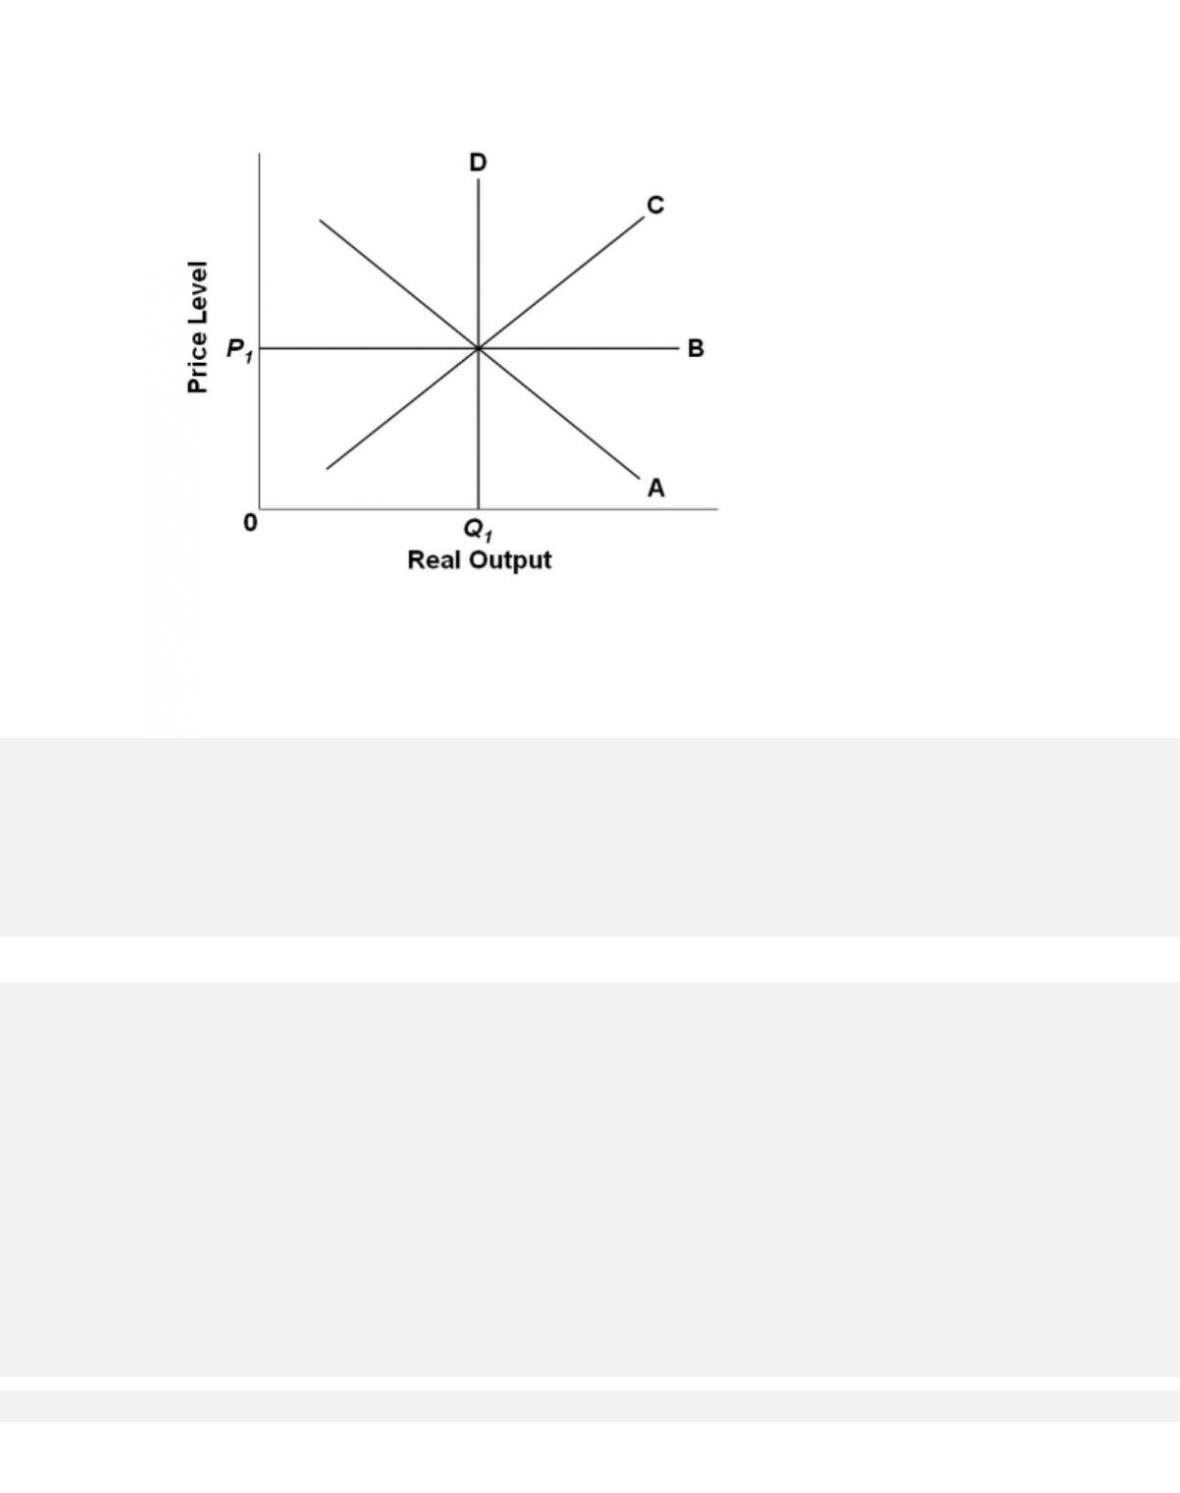
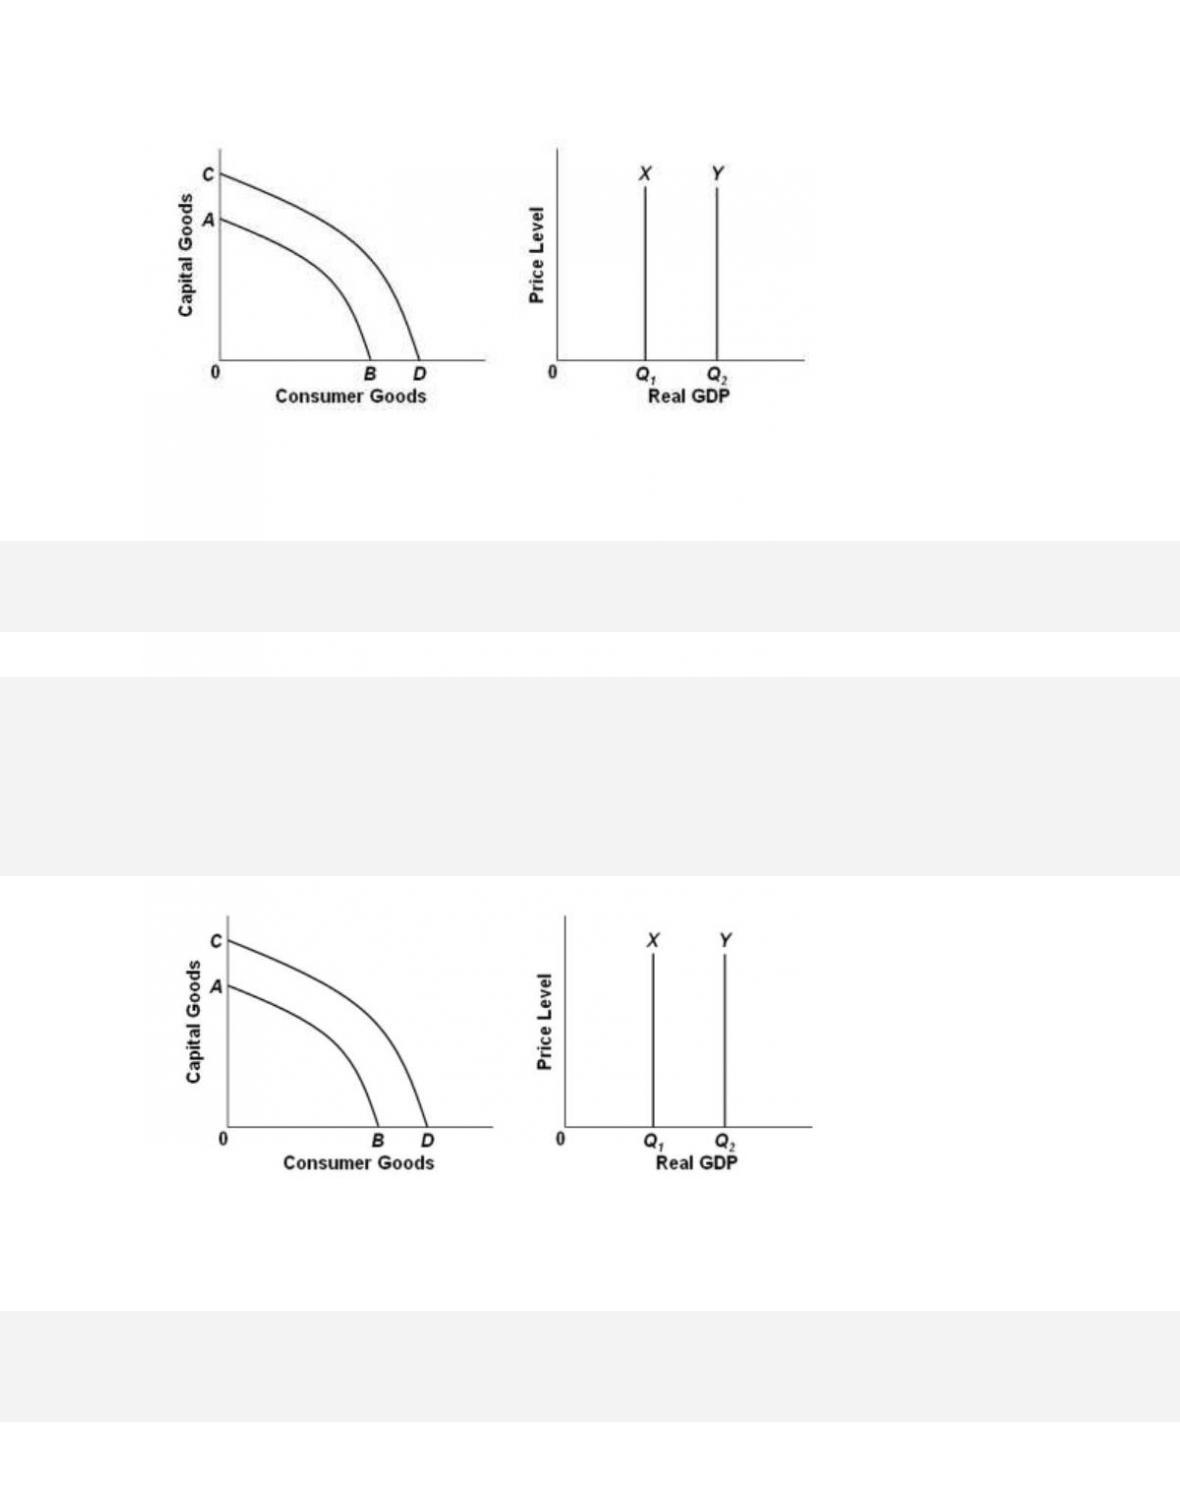
Refer to the graphs. Growth of production capacity is shown by
48.
Refer to the graphs. An increase in an economy’s labor productivity would shift curve
38–35
Copyright © 2018 McGraw-Hill Education. All rights reserved. No reproduction or distribution without the prior
written consent of McGraw-Hill Education.
C.
AB to CD and shift curve X to Y.
D. X to Y, while leaving curve AB in place.
49.
Refer to the graphs. An increase in the economy’s human capital would shift curve
50.
Inflation in the U.S. economy tends to be

38–36
Copyright © 2018 McGraw-Hill Education. All rights reserved. No reproduction or distribution without the prior
written consent of McGraw-Hill Education.
supply.
C.
a finite, one-time event, as the Fed actively works to eliminate all inflation.
D.
ongoing, as aggregate supply is continually shifting to the left.
51.
In the absence of unexpected shocks, the economy will tend to experience
52.
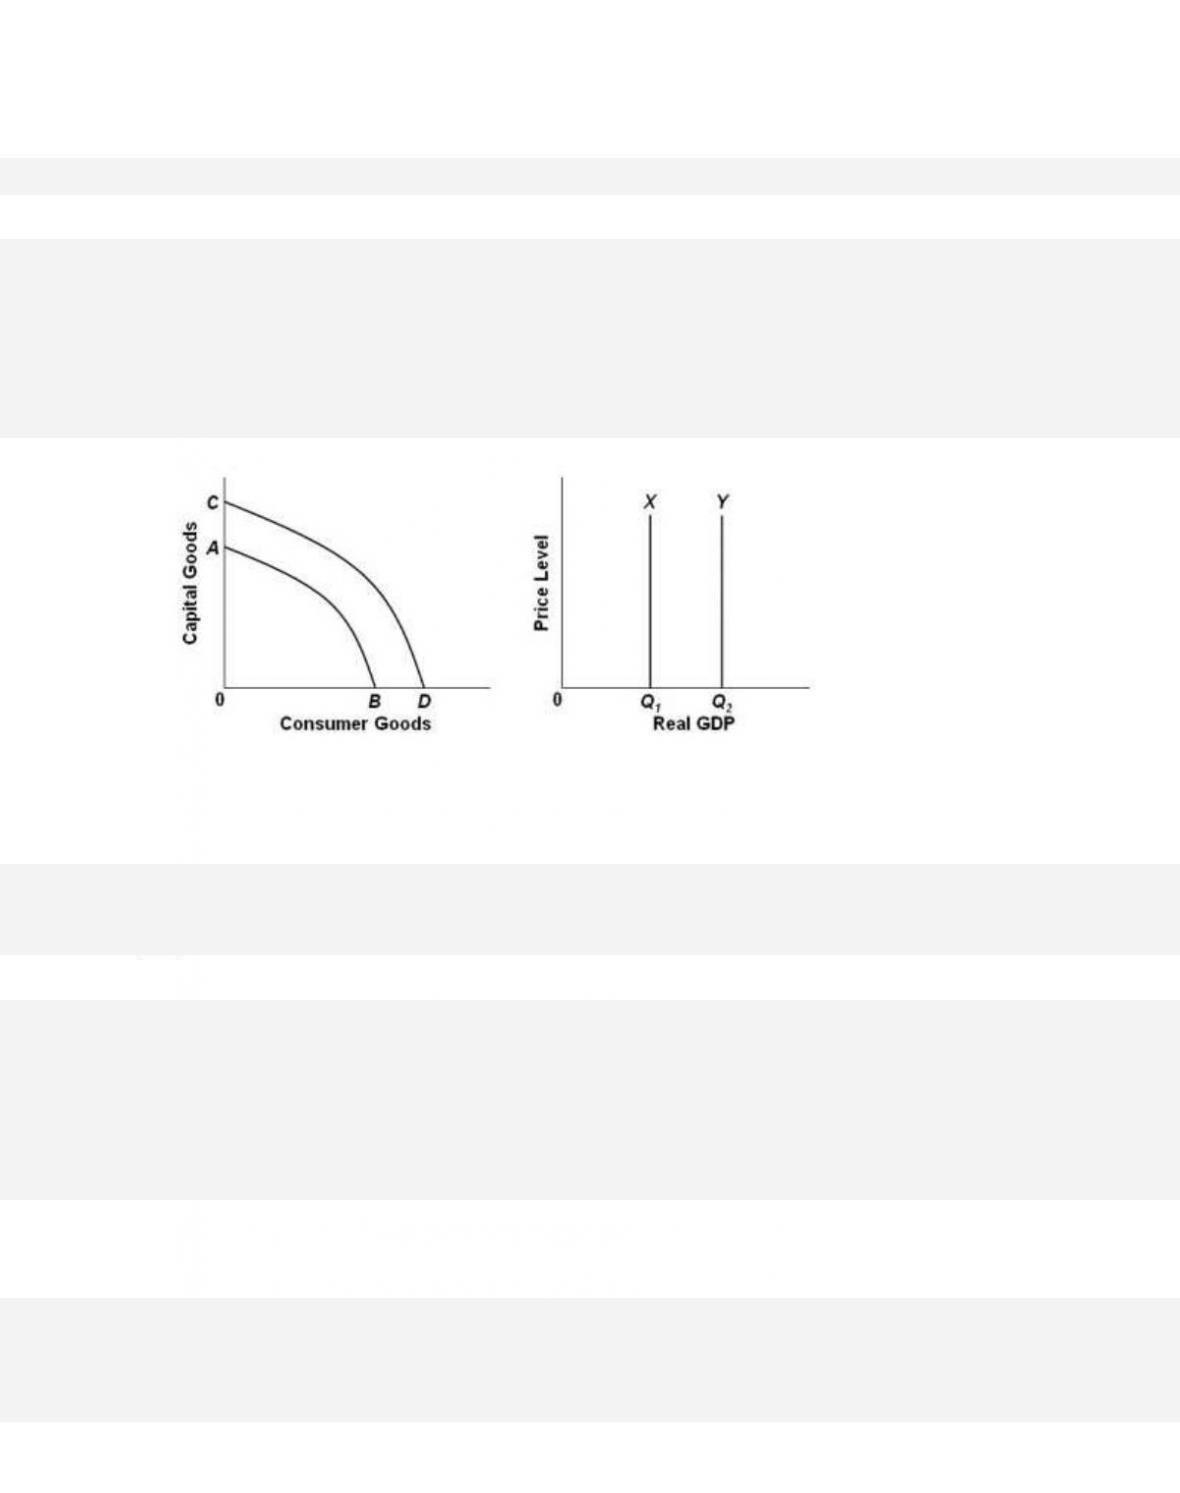
Refer to the graphs, where the subscripts on the labels denote years 1 and 2. In year 1 the
economy

53.
Refer to the graphs, where the subscripts on the labels denote years 1 and 2. From the graphs
we can conclude that from year 1 to year 2,
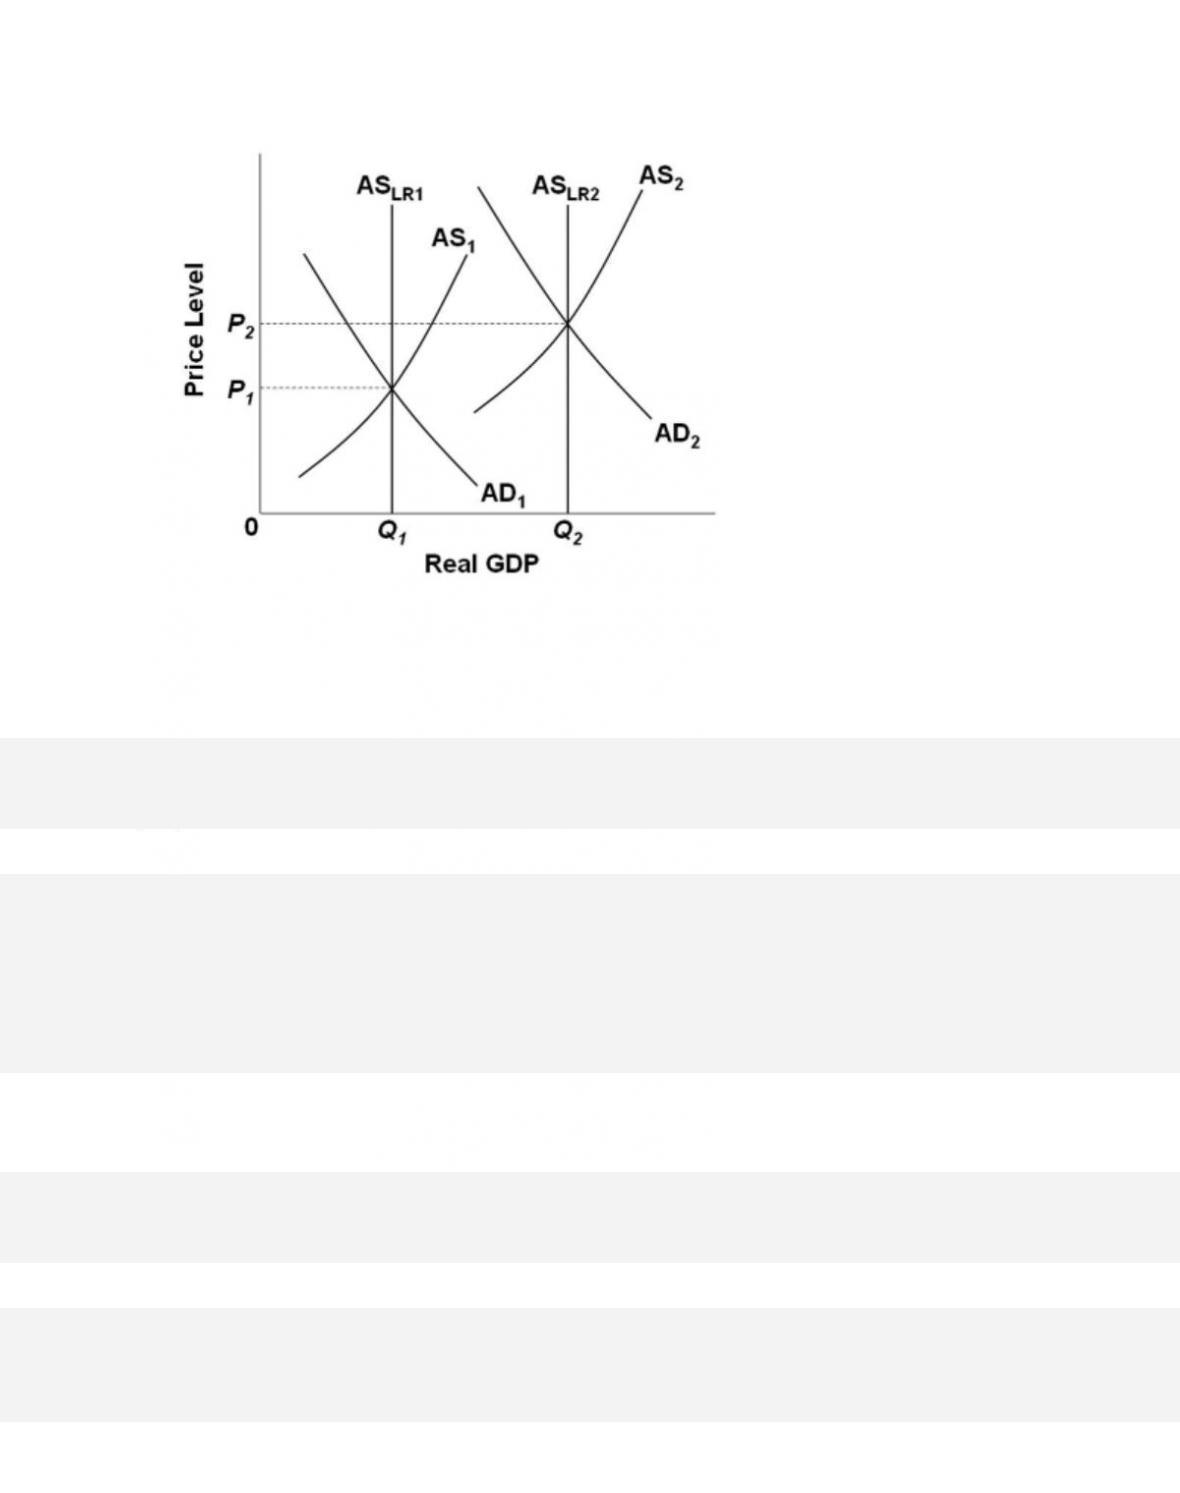
54.
Refer to the graphs, where the subscripts on the labels denote years 1 and 2. From the graphs
we can clearly conclude that the economy
55.
The traditional Phillips Curve suggests a trade-off between

38–40
Copyright © 2018 McGraw-Hill Education. All rights reserved. No reproduction or distribution without the prior
written consent of McGraw-Hill Education.
Blooms: Understand
Difficu l t y : 02 Medium
Learning Objective: 38-03 Explain the short-run trade-off between inflation and unemployment
(the Phillips Curve).
Test Bank: I
Topic: The Inflation-Unemployment Relationship
56.
The basic problem portrayed by the traditional Phillips Curve is
57.
The traditional Phillips Curve suggests that, if government uses an expansionary fiscal
policy to stimulate output and employment,