Chapter 38 Extending the Analysis of Aggregate Supply Answer Key
Multiple Choice Questions
1.
In terms of aggregate supply, a period in which nominal wages and other resource prices
are unresponsive to price-level changes is called
the
2.
In terms of aggregate supply, a period in which nominal wages and other resource prices
are fully responsive to price-level changes is
called the
3.
In the extended analysis of aggregate supply, the short-run aggregate supply curve is
38-2
Copyright © 2018 McGraw-Hill Education. All rights reserved. No reproduction or distribution without the prior
written consent of McGraw-Hill Education.
AACSB: Knowledge Application
Accessibilit y: Keyboard Navigation
Blooms: Understand
Difficulty: 02 Medium
Learning Objective: 38-01 Explain the relationship between short-run aggregate supply and
long-run aggregate supply.
Test Bank: I
Topic: From Short Run to Long Run
4.
In terms of aggregate supply, the short run is a period in which
5.
In terms of aggregate supply, the difference between the long run and the short run is that
in the long run,
6.
The long-run aggregate supply curve is vertical
38-3
Copyright © 2018 McGraw-Hill Education. All rights reserved. No reproduction or distribution without the prior
written consent of McGraw-Hill Education.
A. because the rate of inflation is steady in the long run.
B.
because resource prices eventually rise and fall with product prices.
C.
because product prices tend to increase at a faster rate than resource prices.
D.
only when the money supply increases at the same rate as real GDP.
AACSB: Knowledge Application
Accessibilit y: Keyboard Navigation
Blooms: Understand
Difficulty: 02 Medium
Learning Objective: 38-01 Explain the relationship between short-run aggregate supply and
long-run aggregate supply.
Test Bank: I
Topic: From Short Run to Long Run
7.
The short-run aggregate supply curve is upsloping because higher price levels
8.
Other things equal, a decrease in the price level will
38-4
Copyright © 2018 McGraw-Hill Education. All rights reserved. No reproduction or distribution without the prior
written consent of McGraw-Hill Education.
Test Bank: I
Topic: From Short Run to Long Run
9.
(a)
(b)
(c)
AS(P100)
AS(P125)
AS(P75)
P
Q
P
Q
P
Q
125
$560
125
$500
125
$620
100
500
100
440
100
560
75
440
75
380
75
500
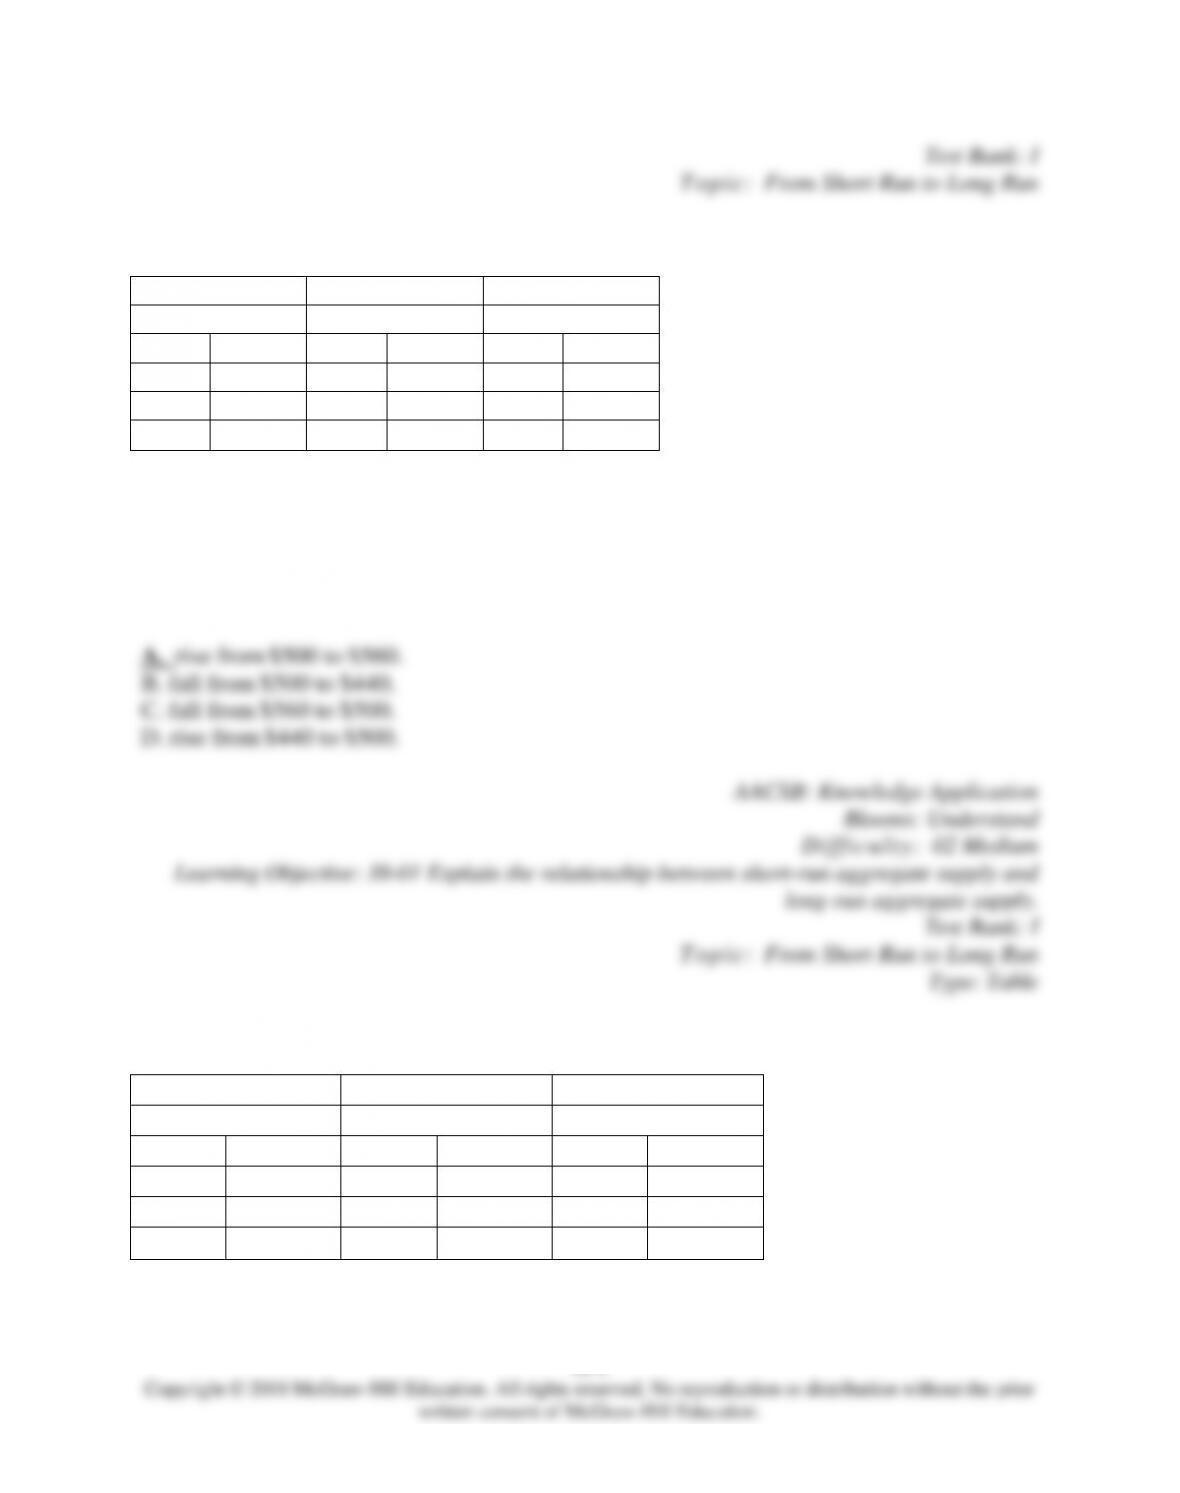
Suppose the full employment level of real output (Q ) for a hypothetical economy is $500,
the price level (P ) initially is 100, and prices
and wages are flexible both upward and
downward. Refer to the accompanying short-run aggregate supply schedules. If the price
level
unexpectedly increases from 100 to 125, the level of real output in the short run will
10.
(a)
(b)
(c)
AS(P100)
AS(P125)
AS(P75)
P
Q
P
Q
P
Q
125
$560
125
$500
125
$620
100
500
100
440
100
560
75
440
75
380
75
500
Suppose the full employment level of real output (Q) for a hypothetical economy is $500,
the price level (P) initially is 100, and prices
and wages are flexible both upward and
downward. Refer to the accompanying short–run aggregate supply schedules. In the long run,
an
increase in the price level from 100 to 125 will
11.
(a)
(b)
(c)
AS(P100)
AS(P125)
AS(P75)
P
Q
P
Q
P
Q
125
$560
125
$500
125
$620
100
500
100
440
100
560
75
440
75
380
75
500
Suppose the full employment level of real output (Q) for a hypothetical economy is $500, the
price level (P) initially is 100, and prices
and wages are flexible both upward and
downward. Refer to the accompanying short–run aggregate supply schedules. If the price
level
unexpectedly declines from 100 to 75, the level of real output in the short run will
38-6
Copyright © 2018 McGraw-Hill Education. All rights reserved. No reproduction or distribution without the prior
written consent of McGraw-Hill Education.
long-run aggregate supply.
Test Bank: I
Topic: From Short Run to Long Run
Type: Table
12.
(a)
(b)
(c)
AS(P100)
AS(P125)
AS(P75)
P
Q
P
Q
P
Q
125
$560
125
$500
125
$620
100
500
100
440
100
560
75
440
75
380
75
500
Suppose the full employment level of real output (Q) for a hypothetical economy is $500, the
price level (P) initially is 100, and prices
and wages are flexible both upward and
downward. Refer to the accompanying short–run aggregate supply schedules. In the long run,
a
fall in the price level from 100 to 75 will
13. Which of the following statements is true?
38-7
Copyright © 2018 McGraw-Hill Education. All rights reserved. No reproduction or distribution without the prior
written consent of McGraw-Hill Education.
Accessibilit y: Keyboard Navigation
Blooms: Understand
Difficulty: 02 Medium
Learning Objective: 38-01 Explain the relationship between short-run aggregate supply and
long-run aggregate supply.
Test Bank: I
Topic: From Short Run to Long Run
14.
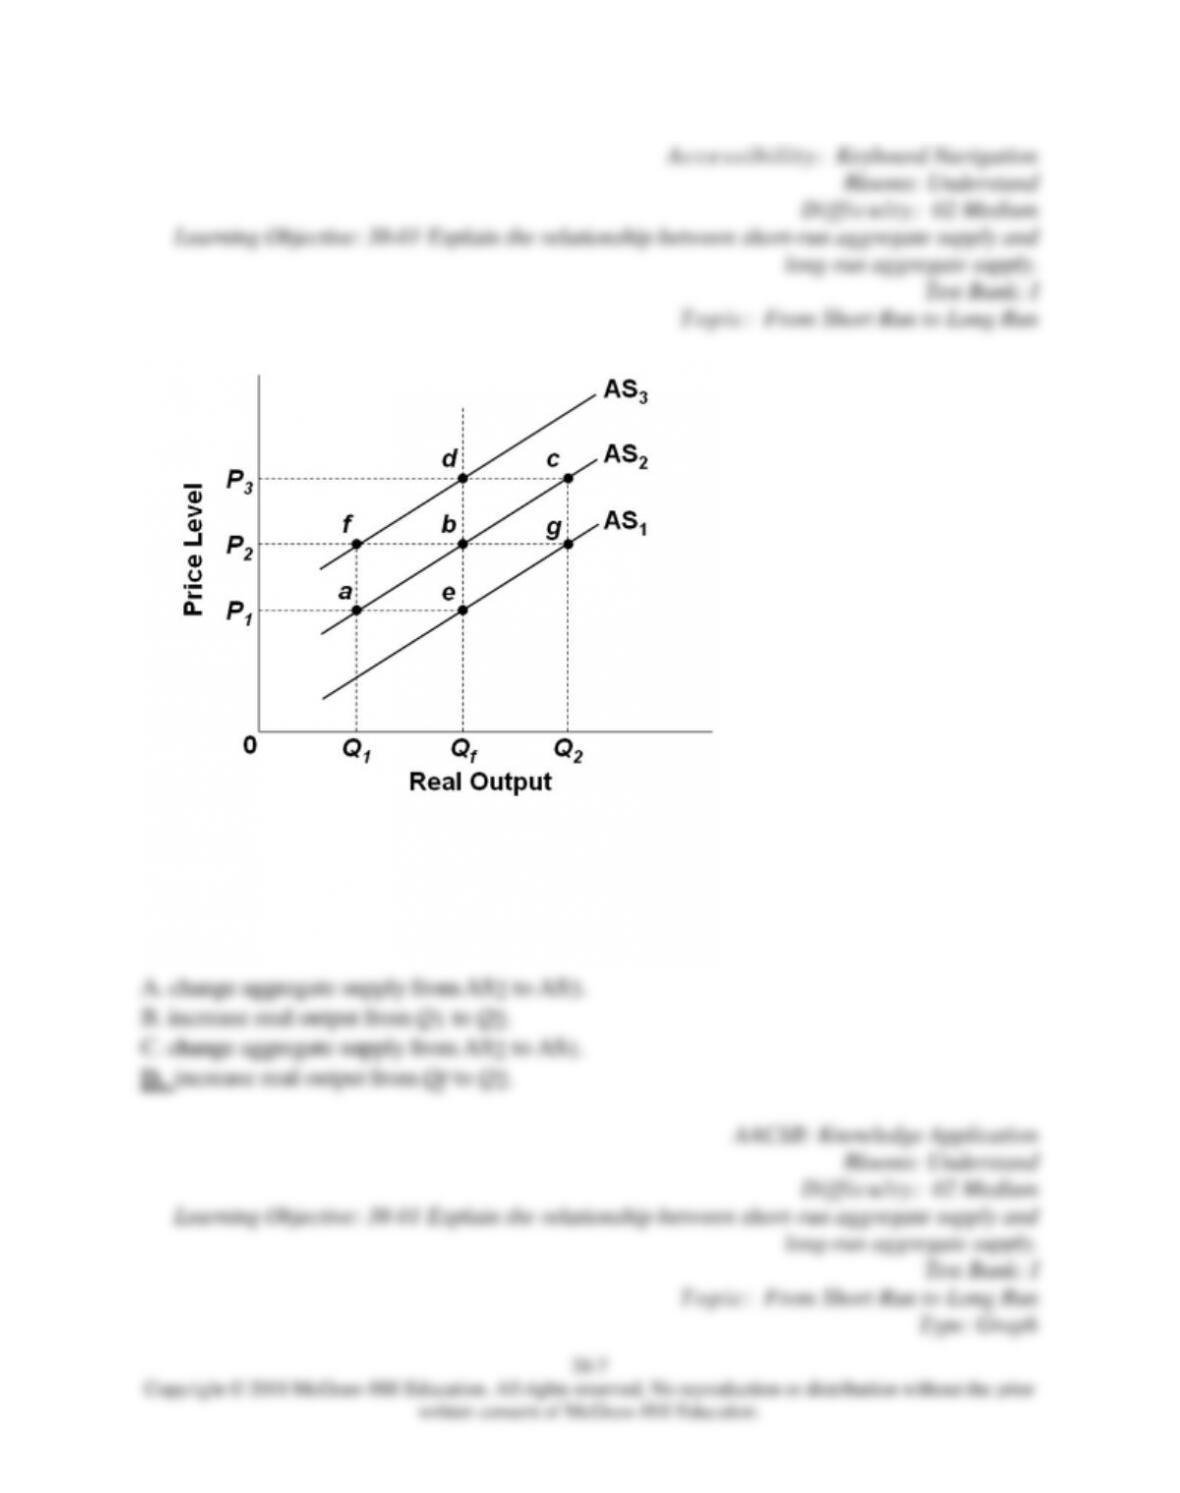
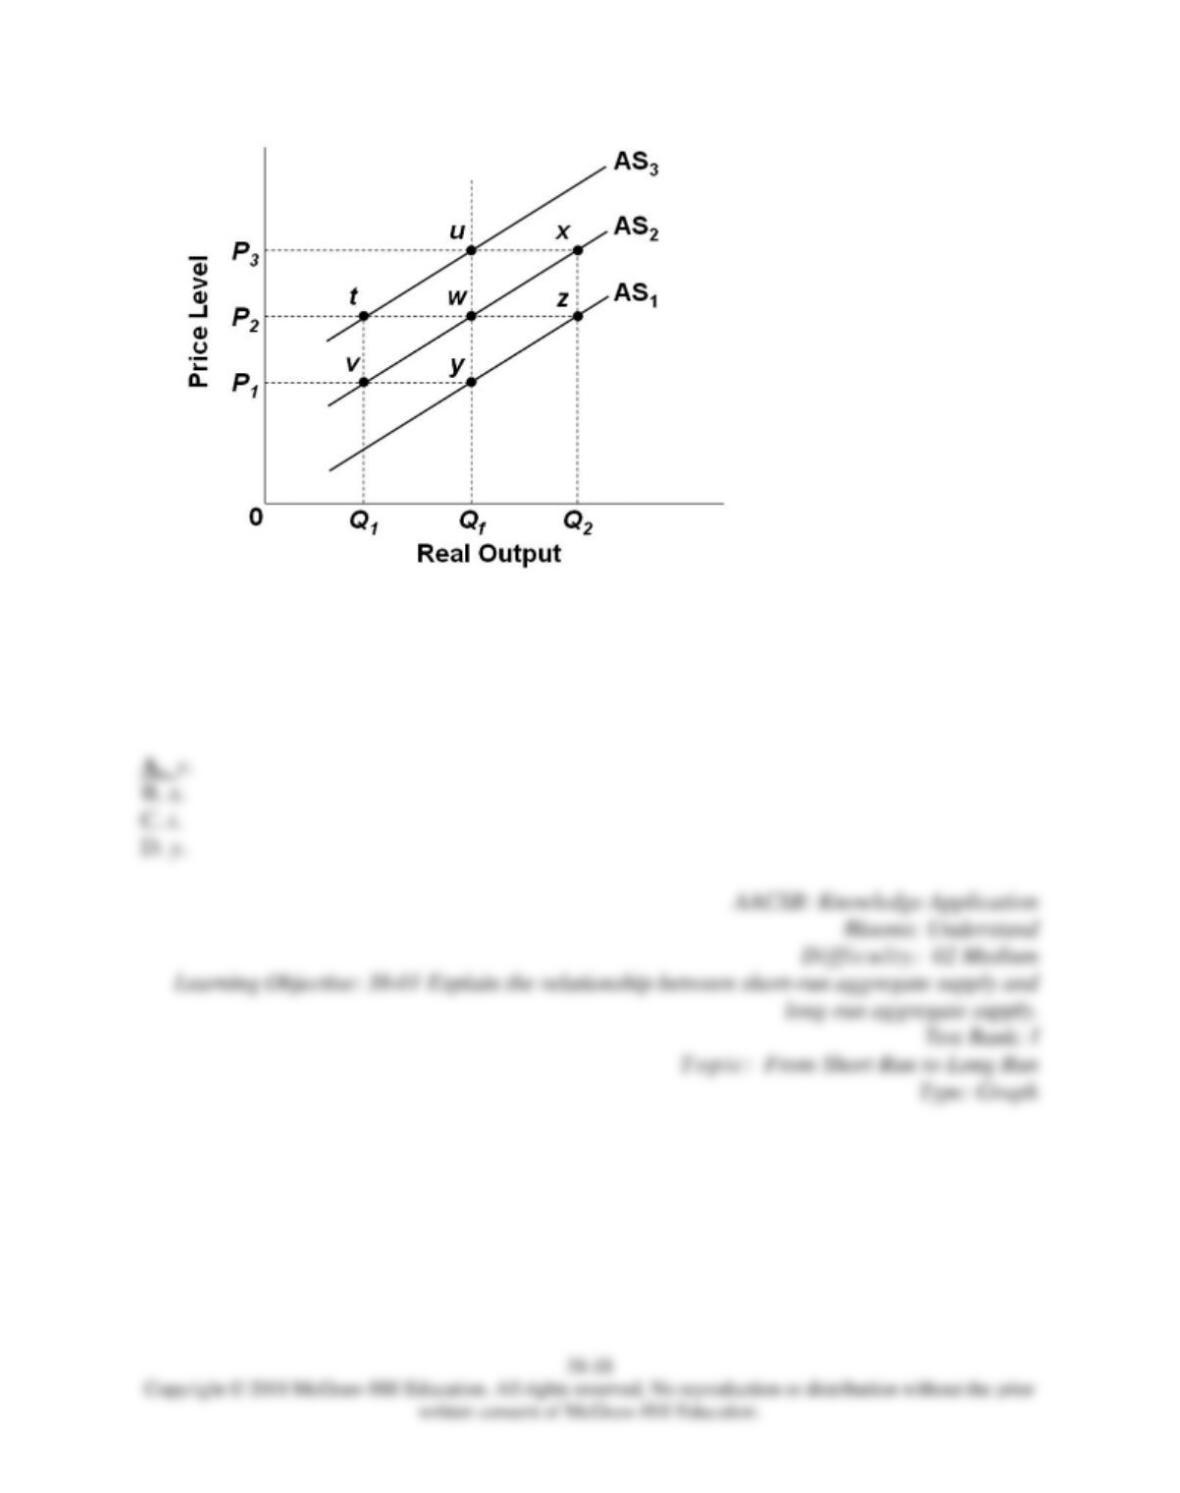
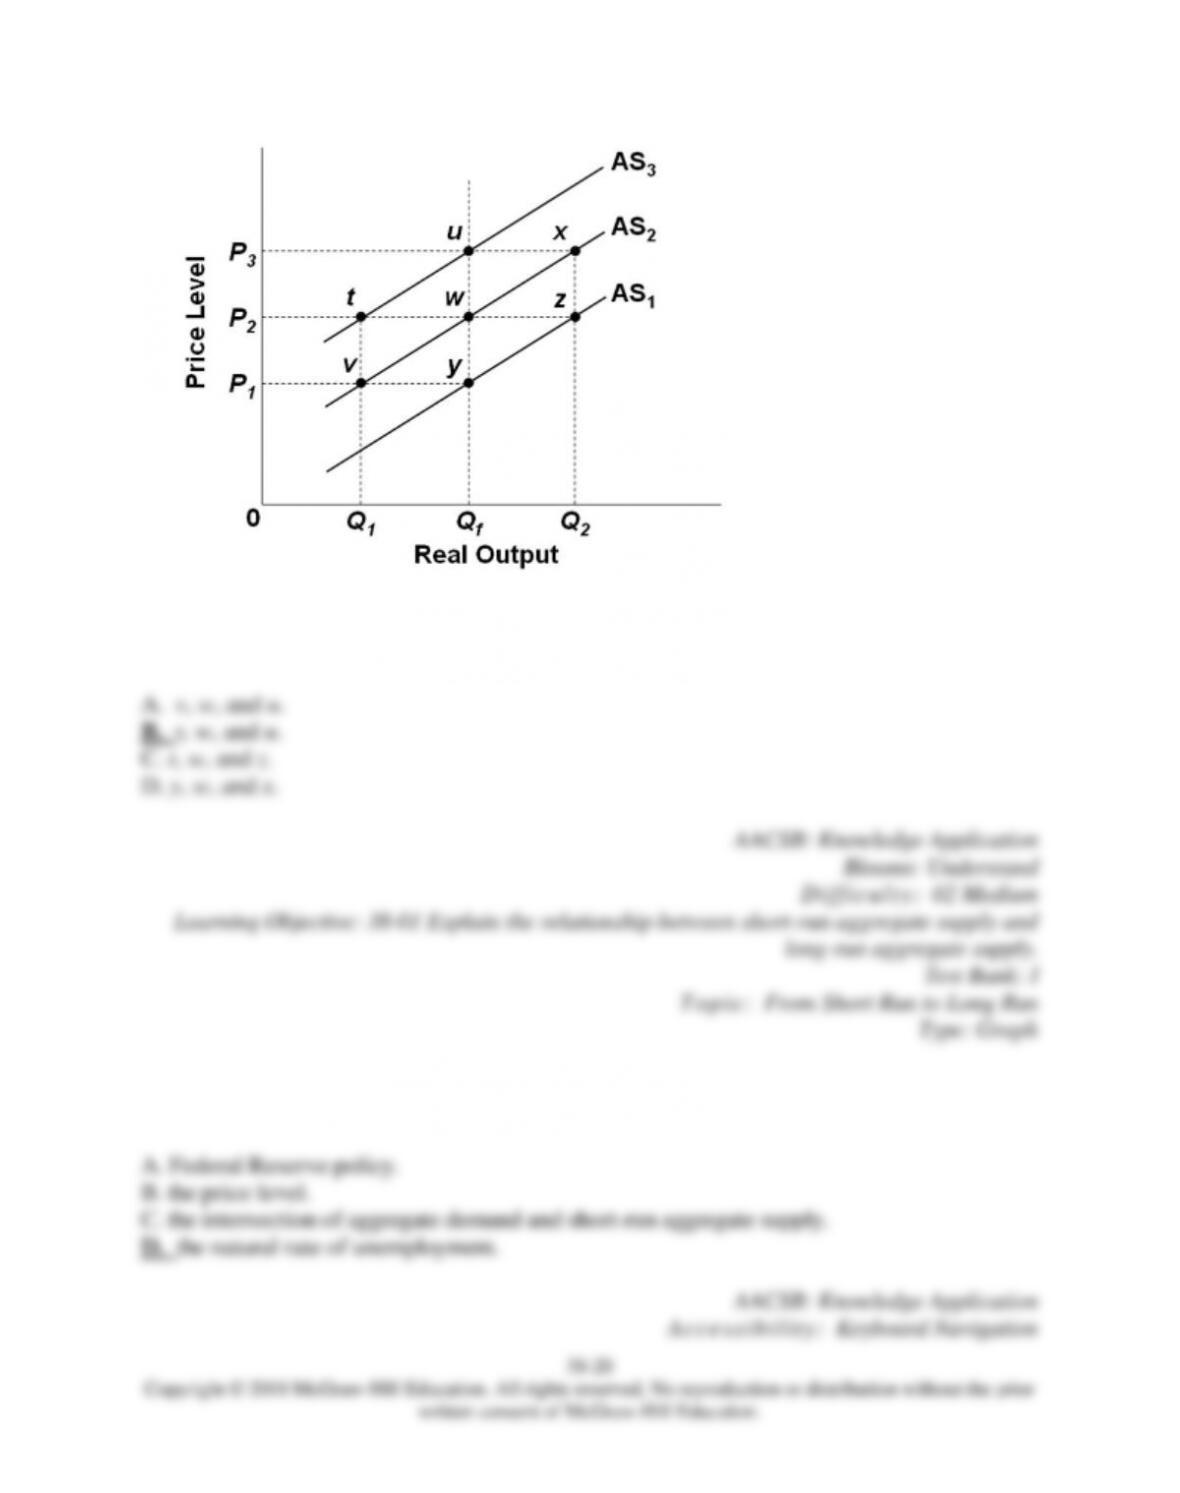
Refer to the given diagram. Assume that nominal wages initially are set on the basis of the
price level P2 and that the economy initially is
operating at its full-employment level of
output Qf. In the short run, an increase in the price level from P2 to P3 will
15.
Refer to the diagram. Assume that nominal wages initially are set on the basis of the price
level P2 and that the economy initially is
operating at its full-employment level of output
Qf. In the long run, an increase in the price level from P2 to P3 will
16.
Refer to the diagram. Assume that nominal wages initially are set on the basis of the price
level P2 and that the economy initially is
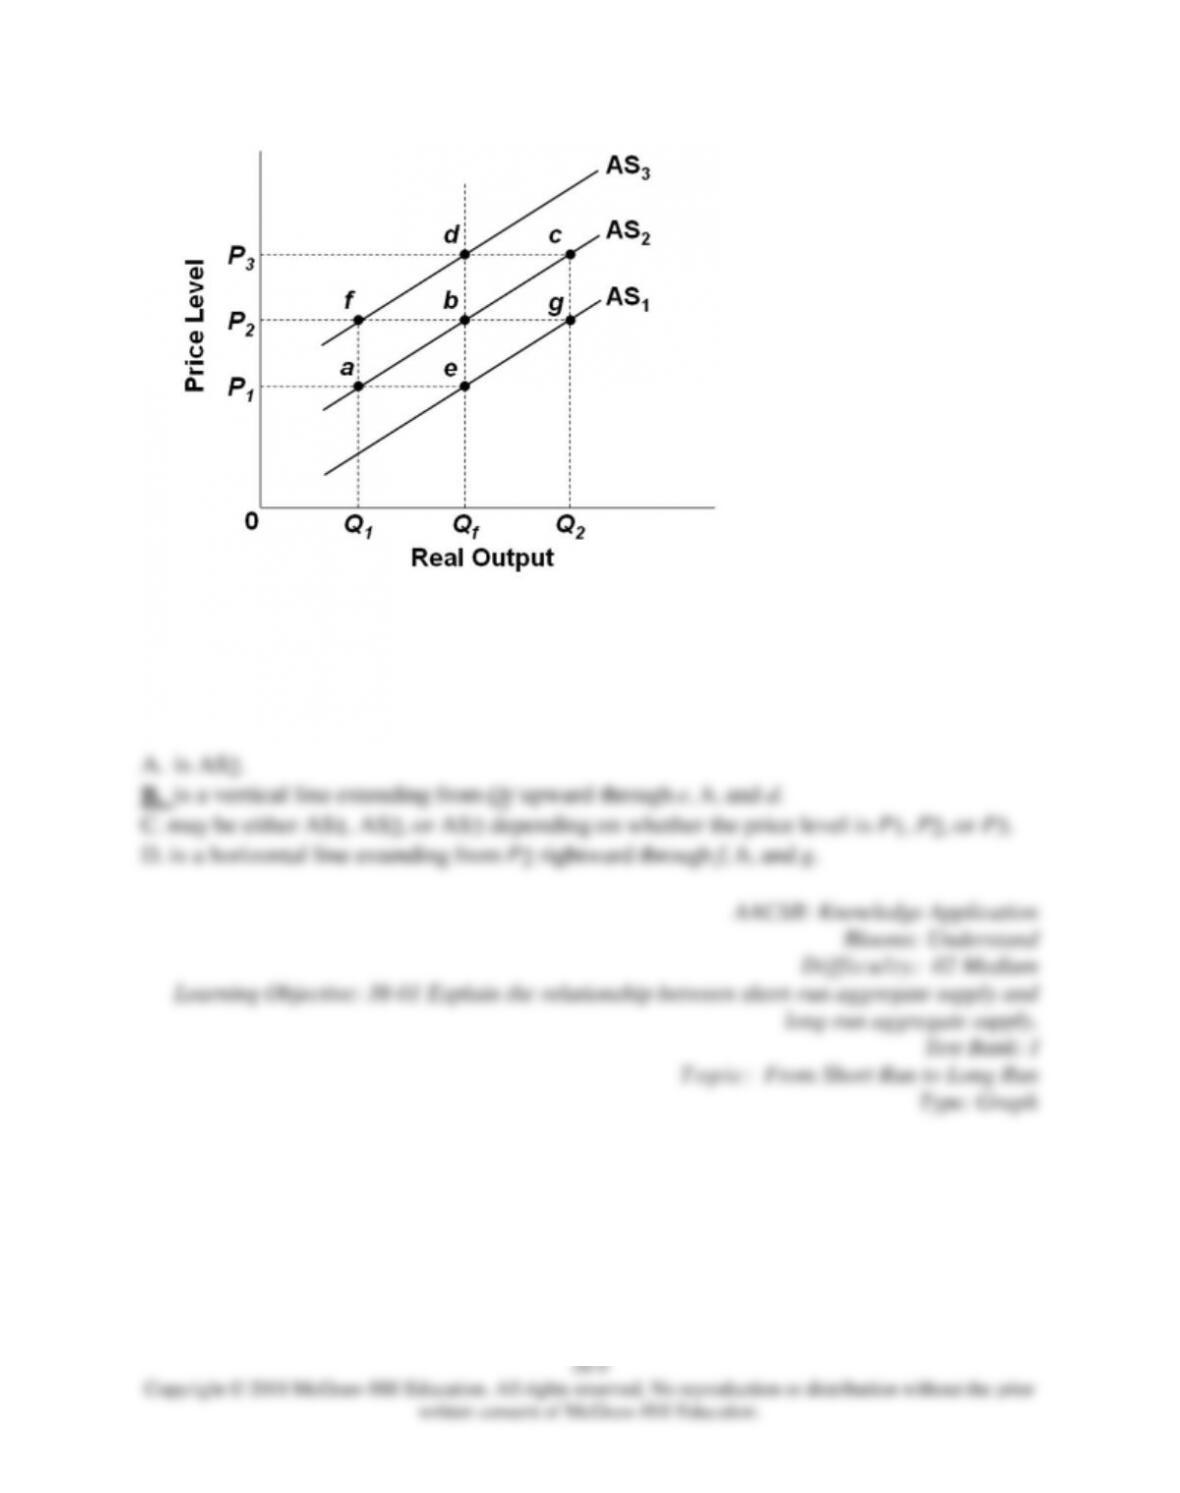
operating at its full-employment level of output
Qf. In terms of this diagram, the long-run aggregate supply curve

17.
Refer to the diagram. Assume that nominal wages initially are set on the basis of the price
level P2 and that the economy initially is
operating at its full-employment level of output
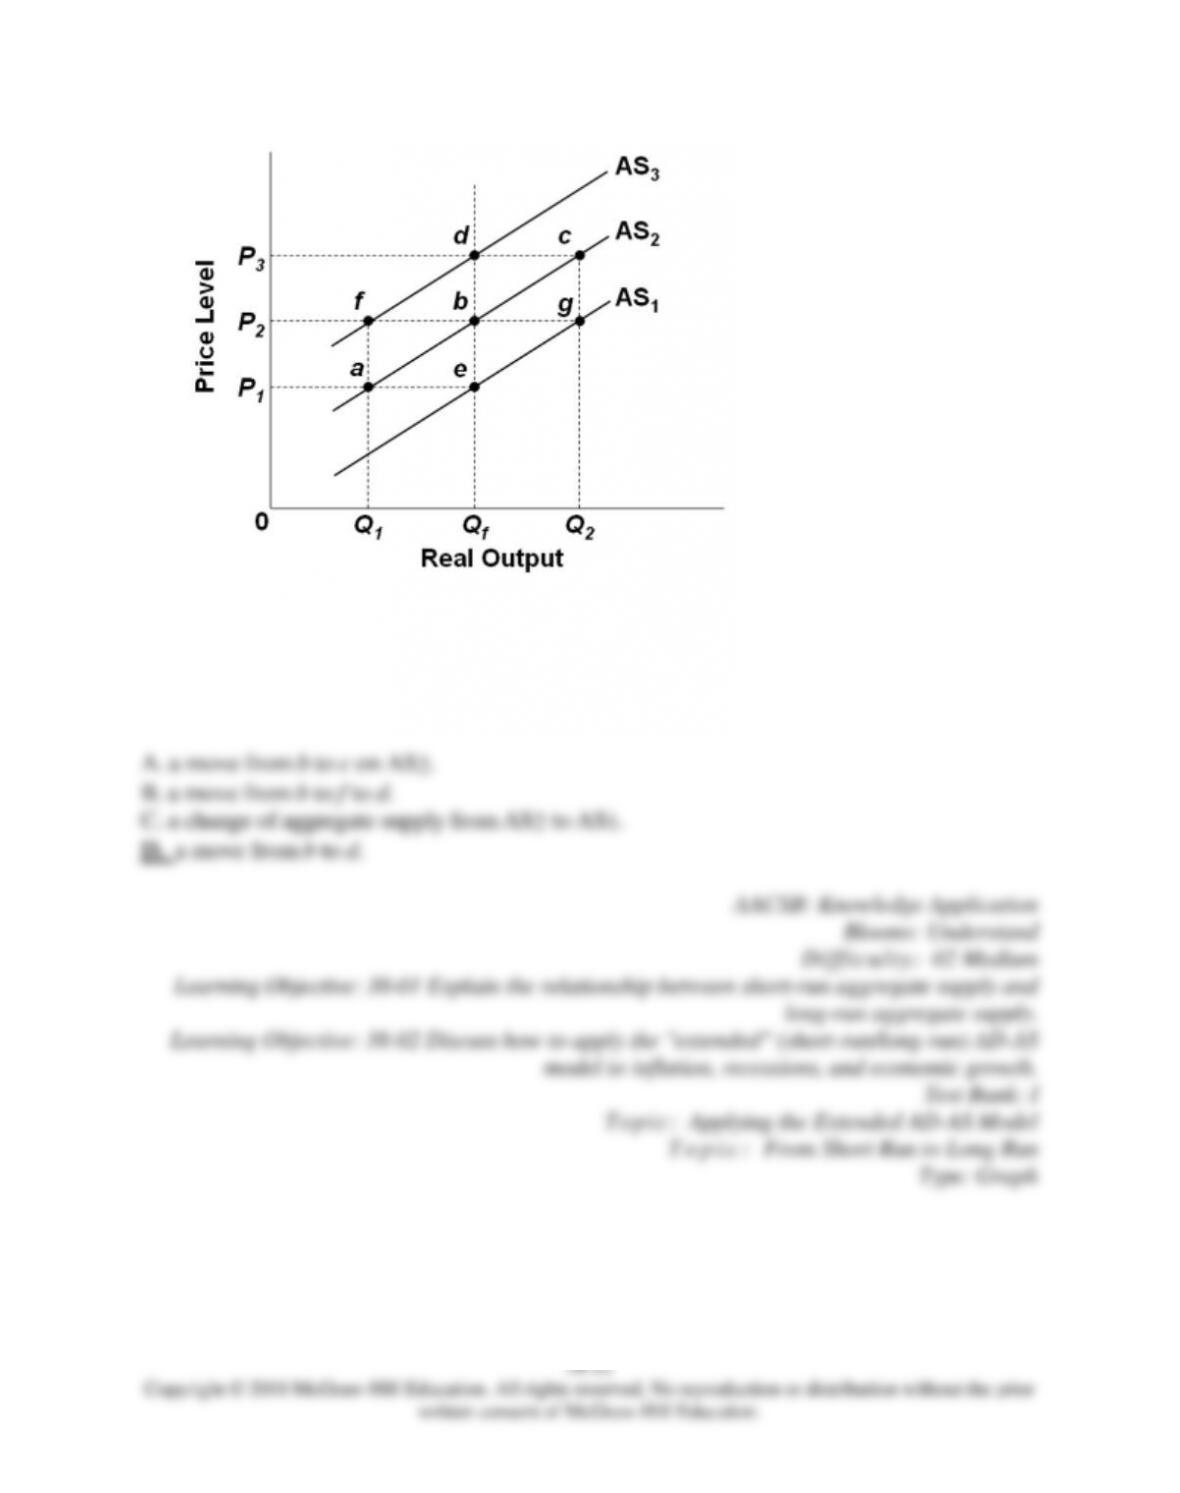
Qf. In the short run, demand-pull inflation could best be shown as
18.
Refer to the diagram. Assume that nominal wages initially are set on the basis of the price
level P2 and that the economy initially is
operating at its full-employment level of output
Qf. In the long run, demand-pull inflation could best be shown as
19.
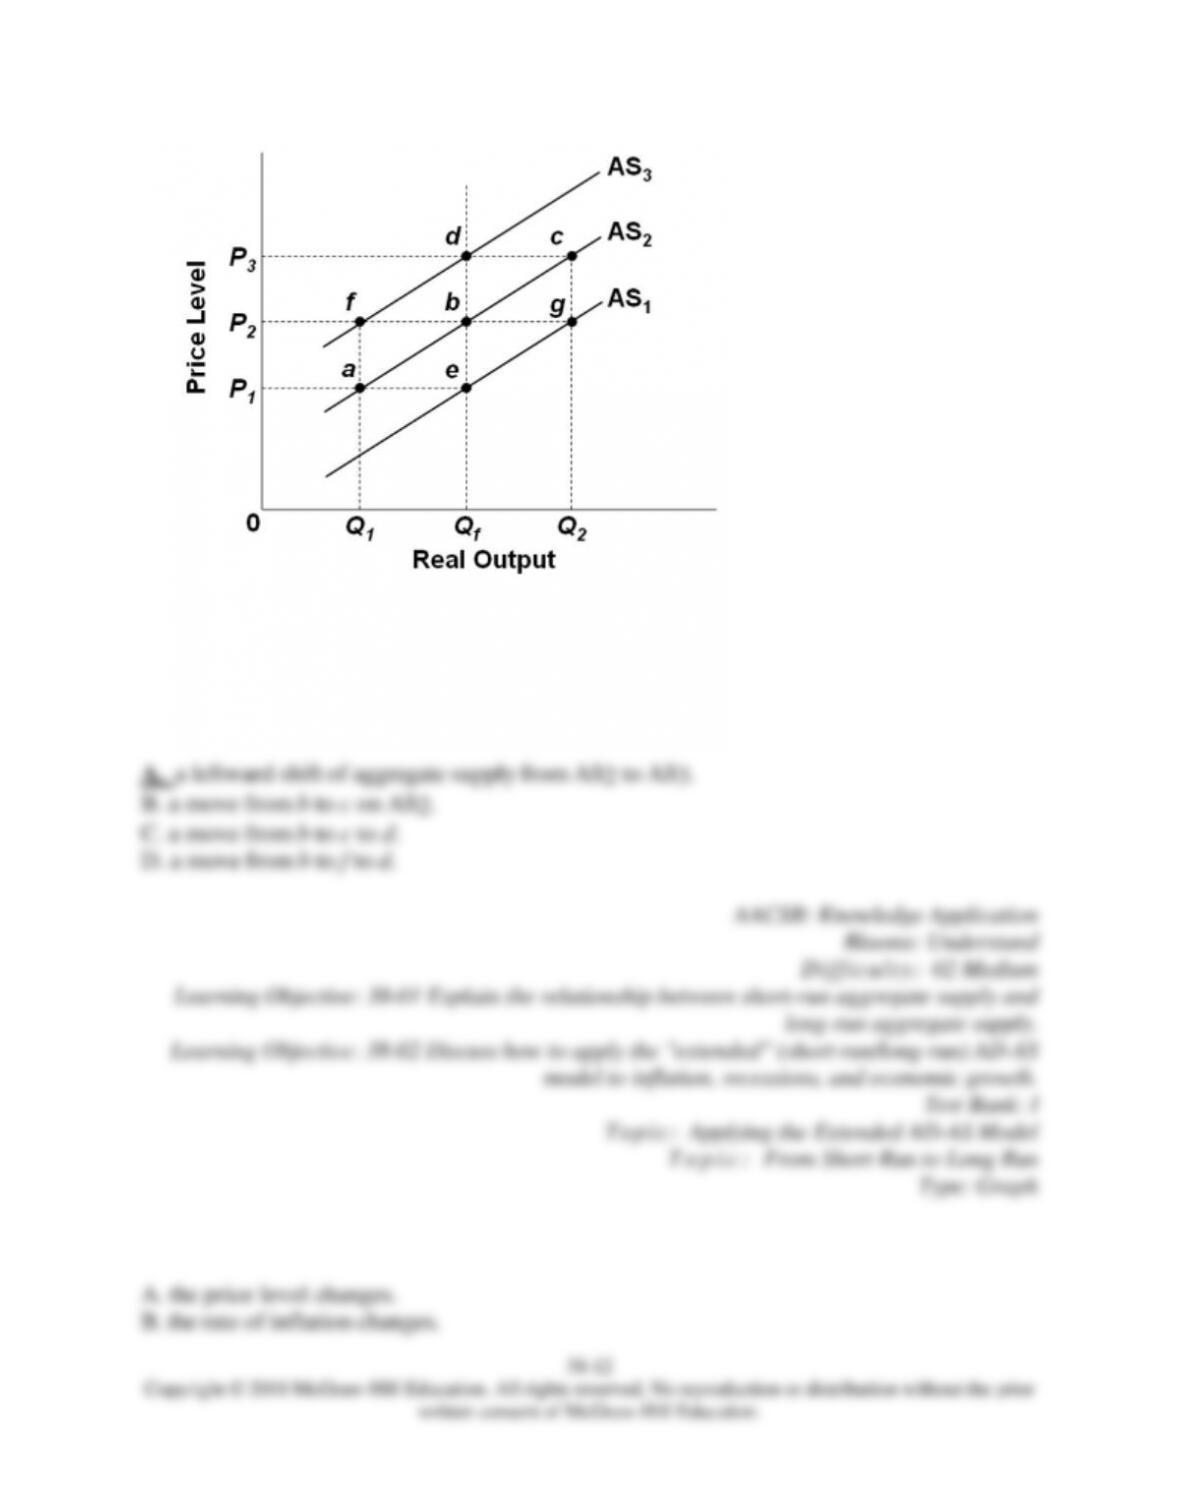
Refer to the diagram. Assume that nominal wages initially are set on the basis of the price
level P2 and that the economy initially is
operating at its full-employment level of output
Qf. In the short run, cost-push inflation could best be shown as
20. Other things equal, the short-run aggregate supply curve shifts positions when
38–13
Copyright © 2018 McGraw-Hill Education. All rights reserved. No reproduction or distribution without the prior
written consent of McGraw-Hill Education.
C.
nominal wages and other input prices change.
D. aggregate demand changes.
AACSB: Knowledge Application
A c c e s s i bi l i t y : Keyboard Navigation
Blooms: Understand
Difficulty: 02 Medium
Learning Objective: 38-01 Explain the relationship between short-run aggregate supply and
long-run aggregate supply.
Test Bank: I
Topic: From Short Run to Long Run
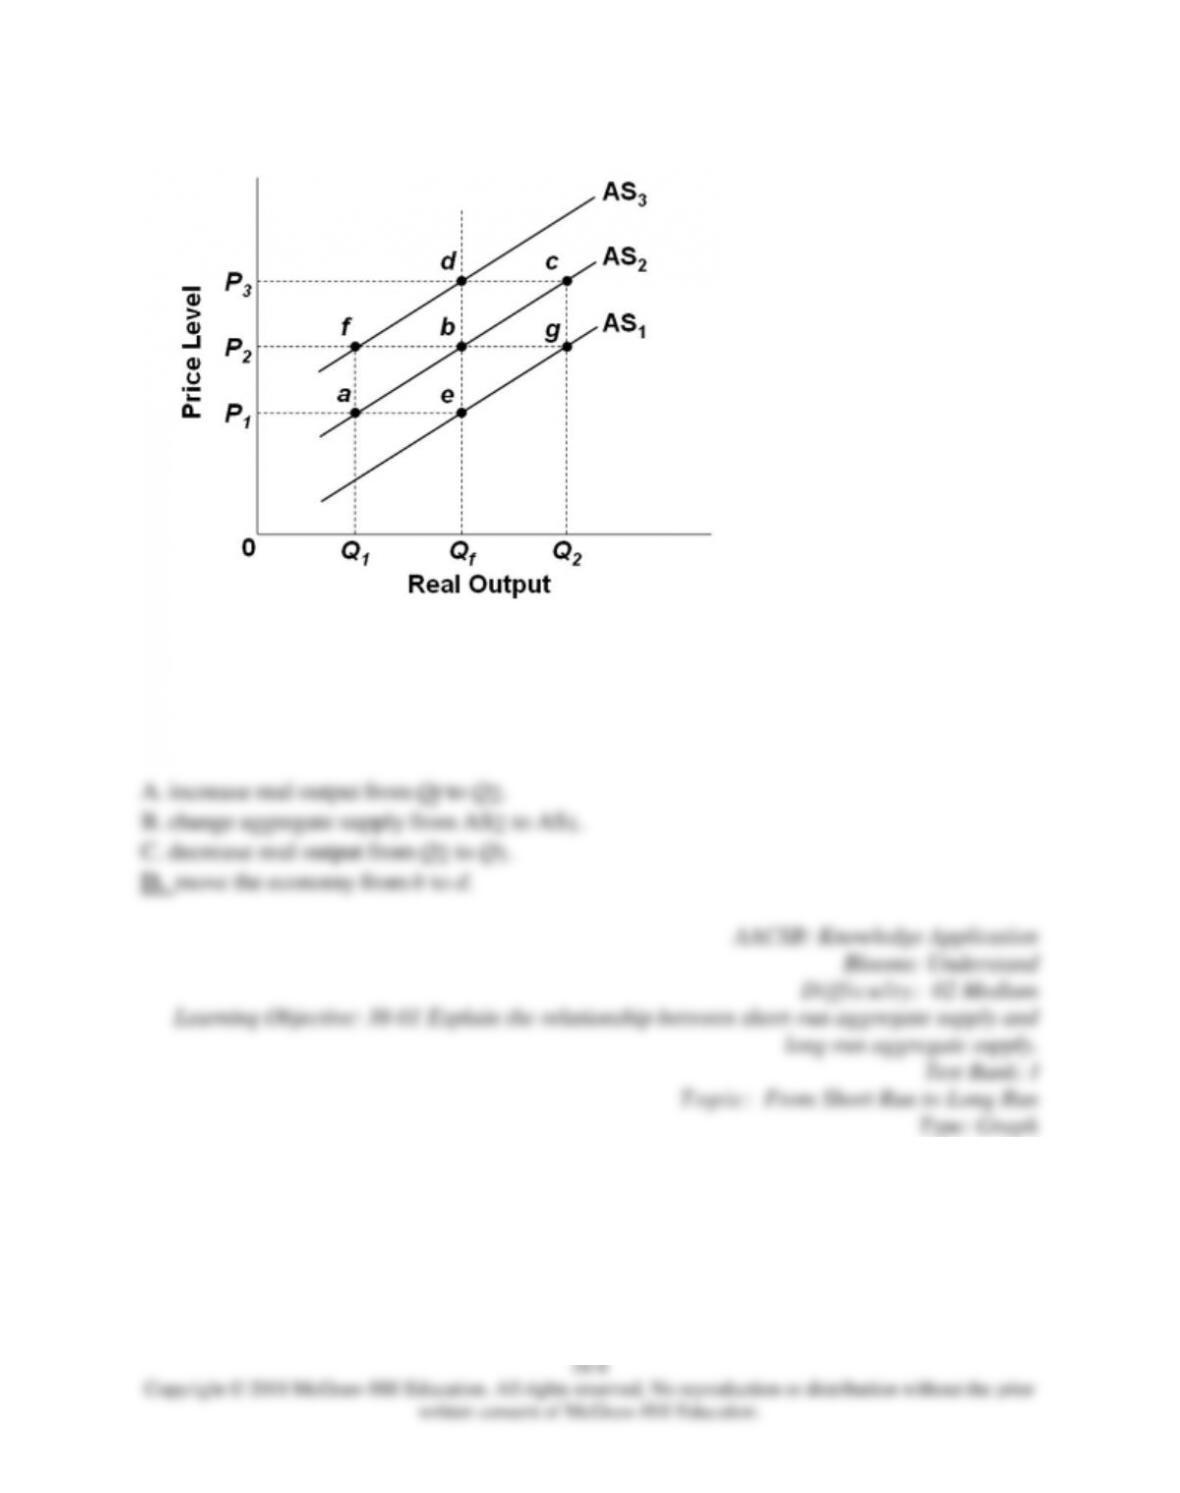
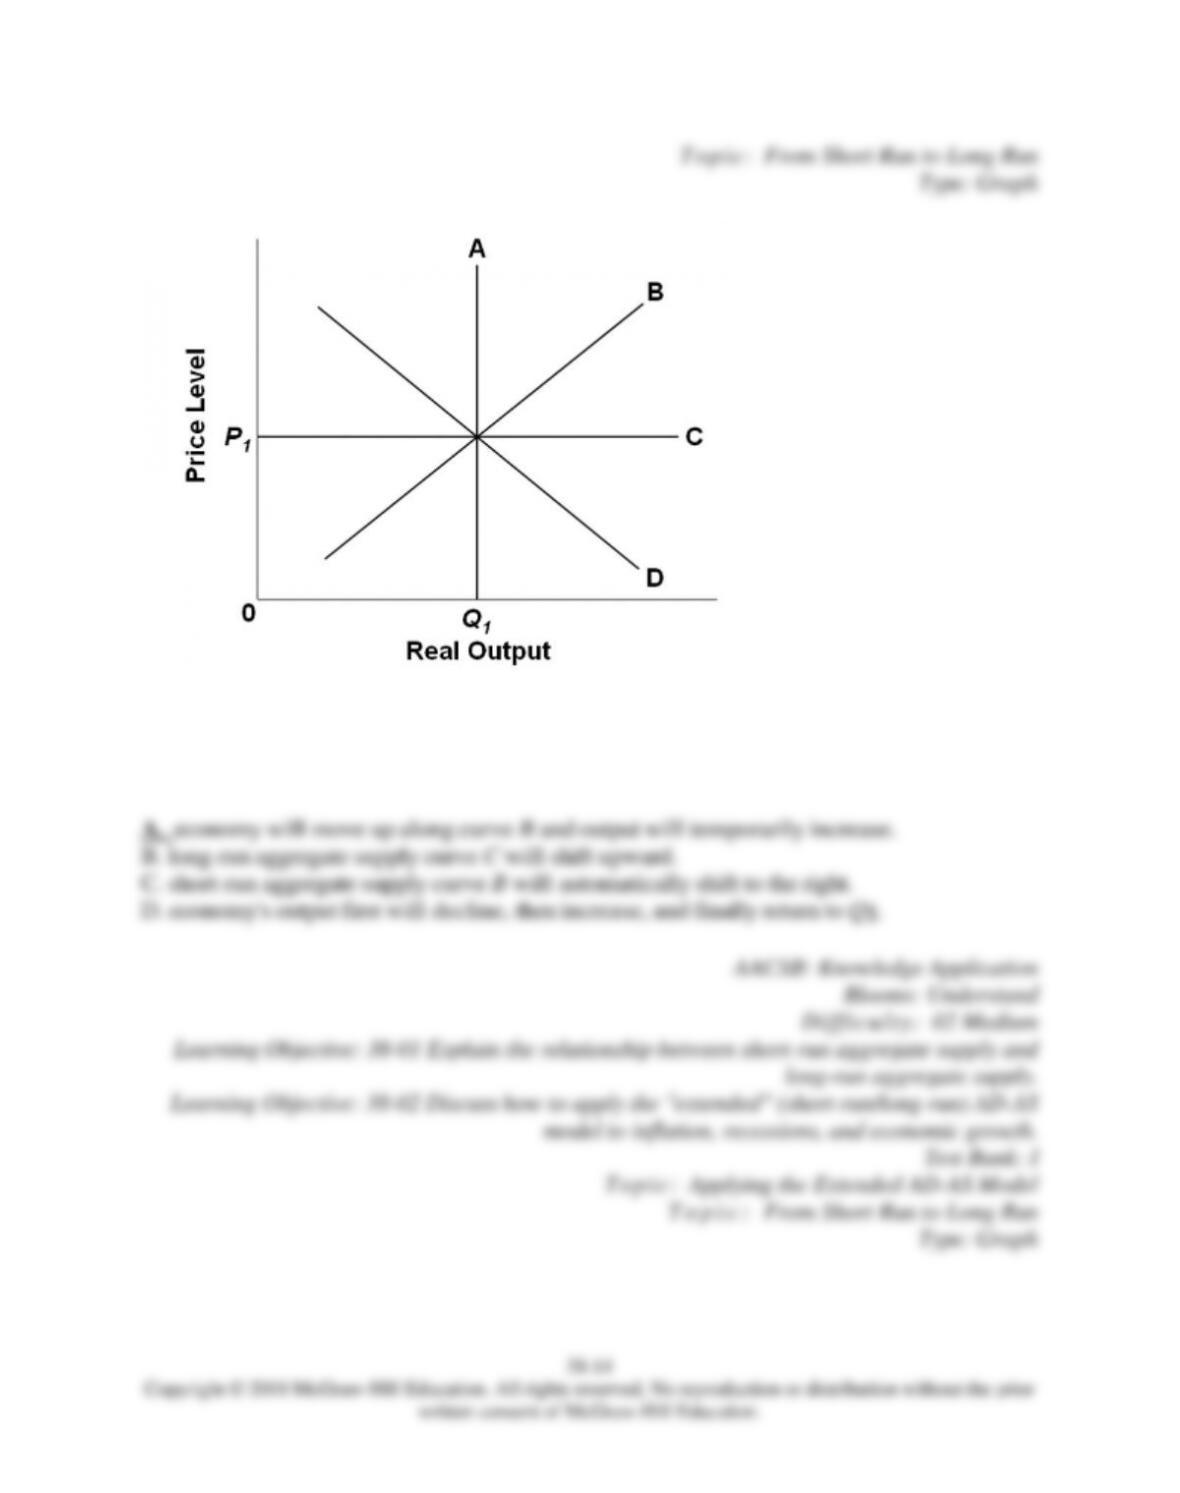
21.
Refer to the diagram relating to short-run and long-run aggregate supply. The
38–14
Copyright © 2018 McGraw-Hill Education. All rights reserved. No reproduction or distribution without the prior
written consent of McGraw-Hill Education.
Topic: From Short Run to Long Run
Type: Graph
22.
Refer to the diagram. If the price level rises above P1 because of an increase in aggregate
demand, the
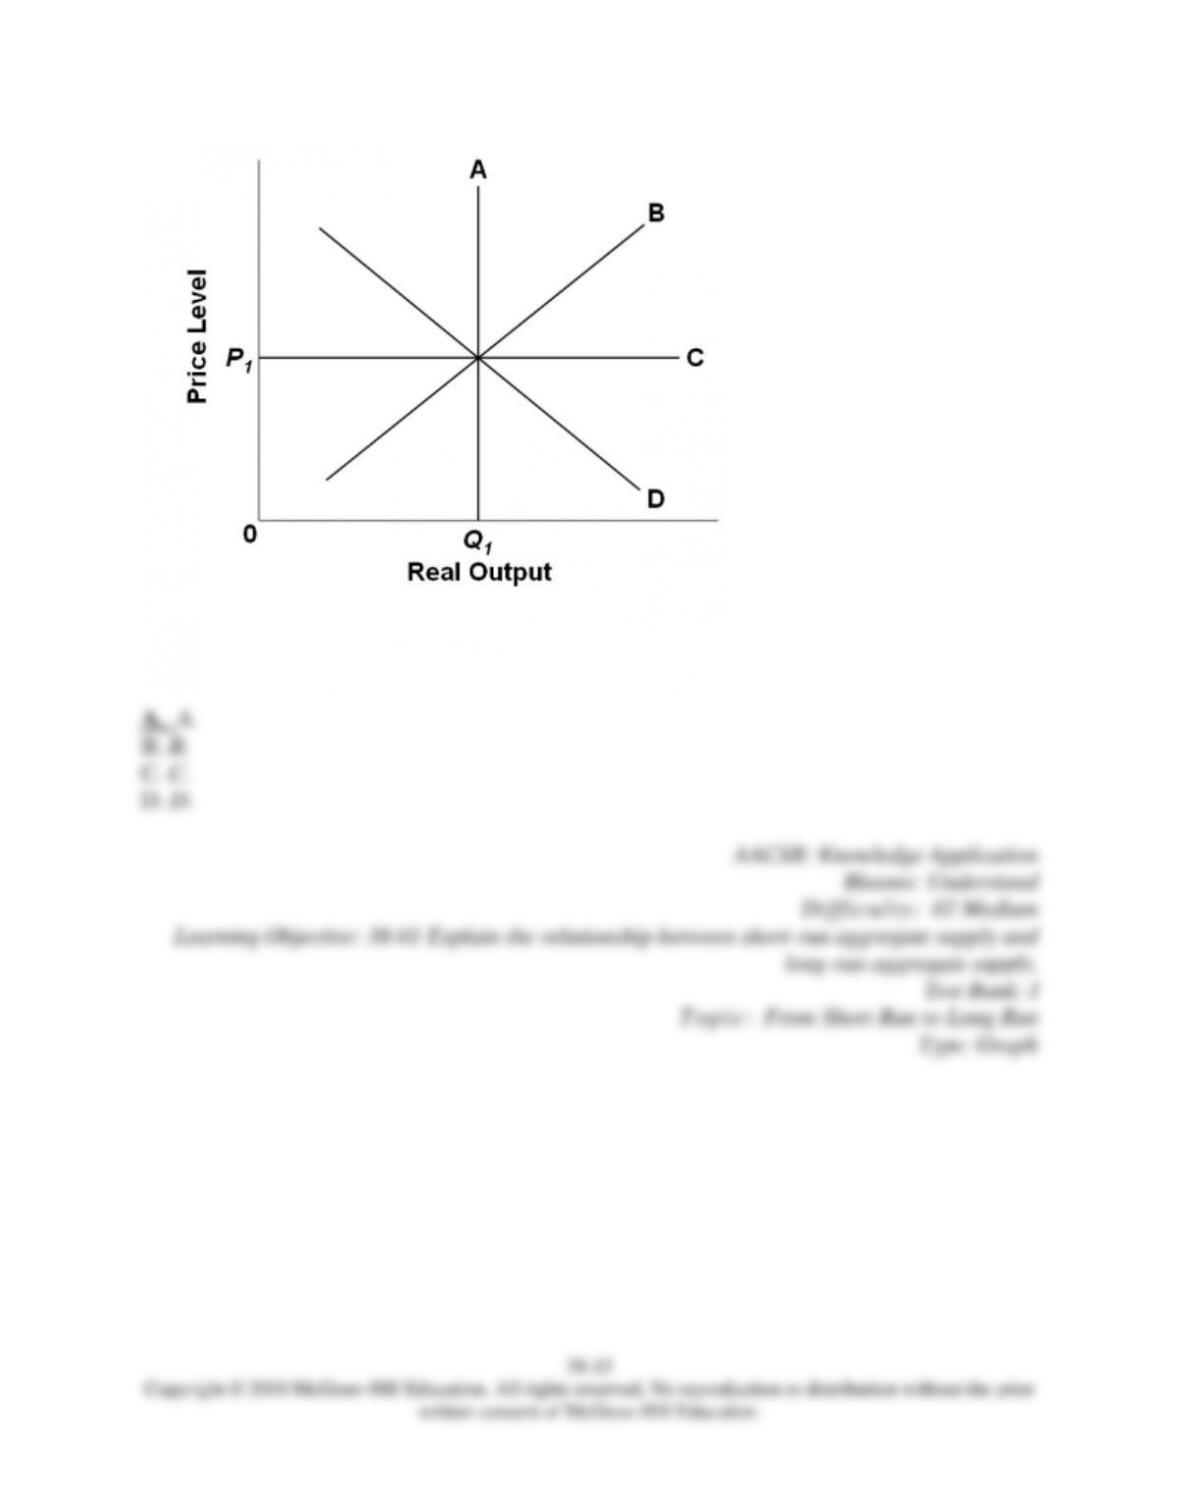
23.
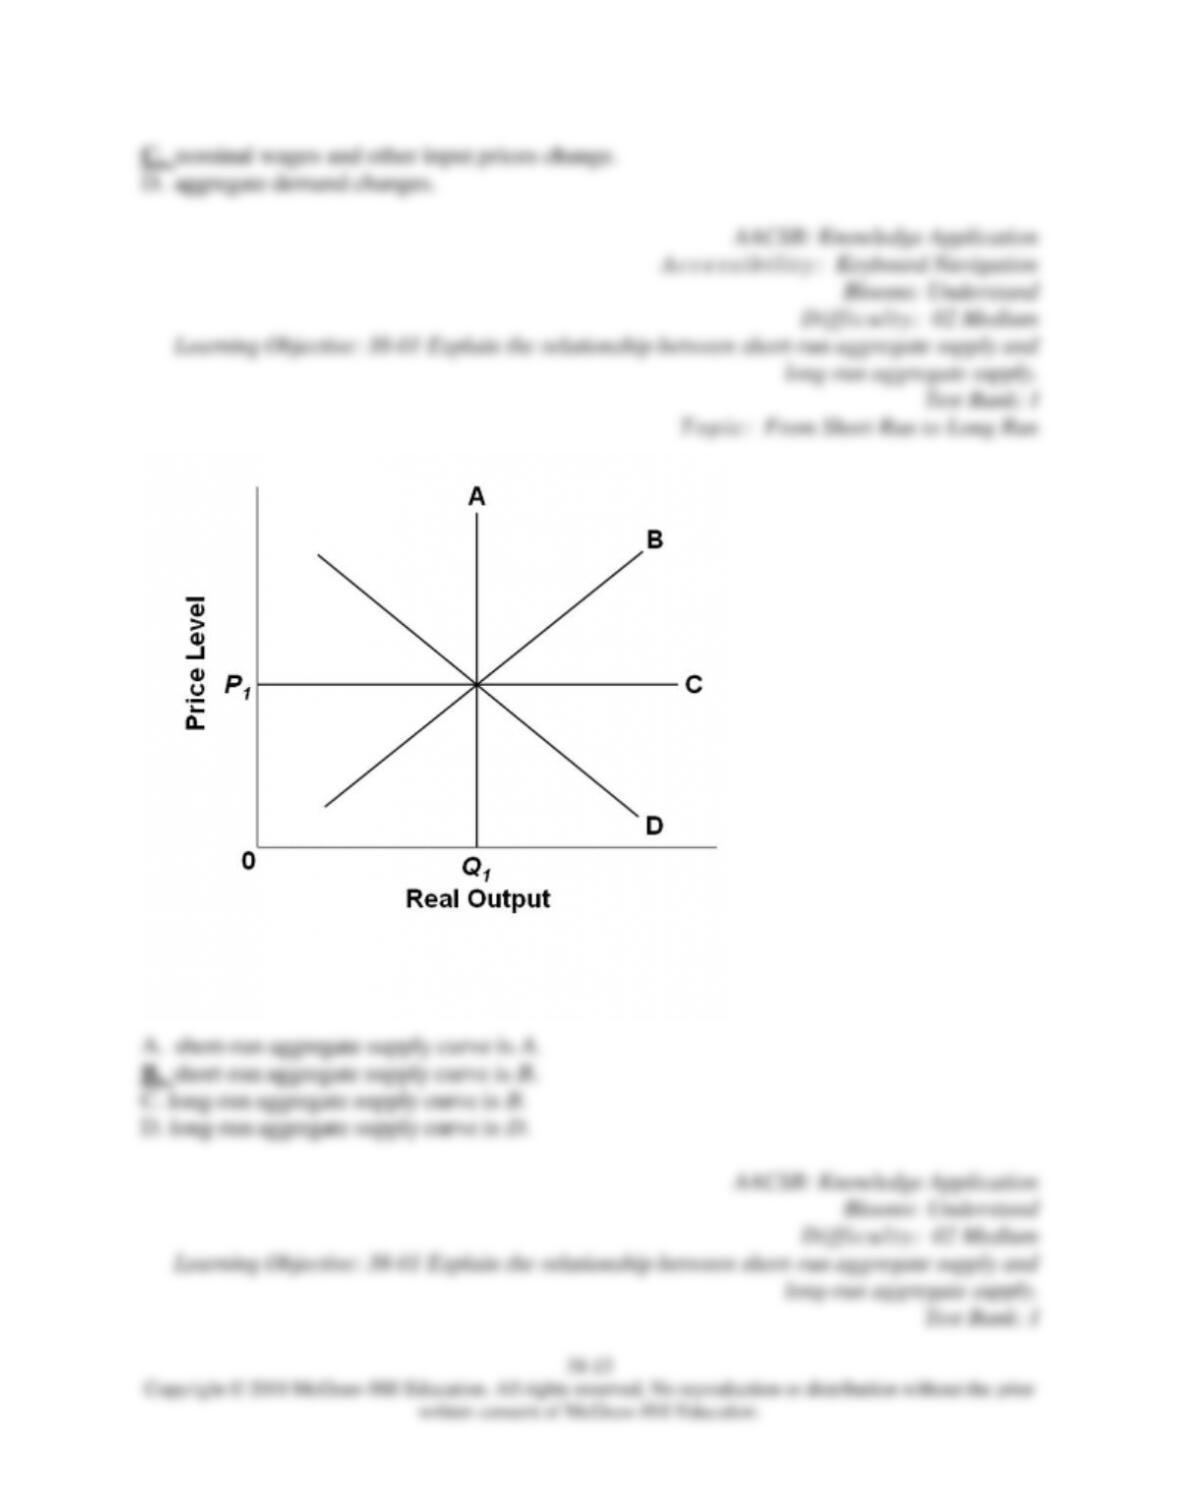
Refer to the diagram. The long-run aggregate supply curve is
24.
Refer to the diagram and assume the economy is operating at equilibrium point w. In the
short run, an increase in the price level from P2 to
P3 would move the economy from point w to point
25.
Refer to the diagram and assume the economy is operating at equilibrium point w. In the
long run, an increase in the price level from P2 to
P3 would move the economy from point w to point
26.
Refer to the diagram and assume the economy is operating at equilibrium point w. In the
short run, a decrease in the price level from P2 to
P1 would move the economy from point w to point

27.
Refer to the diagram and assume the economy is operating at equilibrium point w. If wages
and other resource prices are flexible
downward, in the long run a decrease in the price
level from P2 to P1 would move the economy from point w to point
28.
Refer to the diagram. If drawn, the long-run aggregate supply curve would include points
29.
The level of potential output and location of the long–run aggregate supply curve are
determined by