
119.
Which of the following did not contribute directly to the Great Recession?
120.
The American Recovery and Reinvestment Act of 2009
33–82
Copyright © 2018 McGraw-Hill Education. All rights reserved. No reproduction or distribution without the prior
written consent of McGraw-Hill Education.
Test Bank: I
Topic:
Recent and Projected U.S. Fiscal Policy
121.
The cyclically adjusted budget deficit for the United States
122.
The American Recovery and Reinvestment Act of 2009 was implemented primarily to
123.
Increases in the federal budget deficit from 2007 to 2009 were caused
33–83
Copyright © 2018 McGraw-Hill Education. All rights reserved. No reproduction or distribution without the prior
written consent of McGraw-Hill Education.
AACSB: Knowledge Application
A c c e s s i b i l i t y :
Keyboard Navigation
Blooms: Understand
Diff i cult y :
02 Medium
Learning Objective: 33-04 Summarize recent U.S. fiscal policy and the projections for U.S.
fiscal policy over the next few years.
Test Bank: I
Topic: Recent and Projected U.S. Fiscal Policy
124.
Since actual budget deficits surpassed 10 percent of GDP in 2009,
125.
According to Congressional Budget Office (CBO) projections,
126.
Answer the question on the basis of the following sequence of events involving fiscal
policy: (1) The composite index of leading indicators turns downward for
three consecutive
months, suggesting the possibility of a recession. (2) Economists reach agreement that the
33–84
economy is moving into a recession. (3) A tax cut is
proposed in Congress. (4) The tax cut is
passed by Congress and signed by the president. (5) Consumption spending begins to rise,
aggregate demand increases, and the economy begins to recover. The operational lag of fiscal
policy is reflected in event(s)
127.
Answer the question on the basis of the following sequence of events involving fiscal policy:
(1) The composite index of leading indicators turns downward for
three consecutive months,
suggesting the possibility of a recession. (2) Economists reach agreement that the economy is
moving into a recession. (3) A tax cut is
proposed in Congress. (4) The tax cut is passed by
Congress and signed by the president. (5) Consumption spending begins to rise, aggregate
demand increases, and the economy begins to recover. The recognition lag of fiscal policy is
reflected in events
128.
Answer the question on the basis of the following sequence of events involving fiscal policy:
(1) The composite index of leading indicators turns downward for
three consecutive months,
suggesting the possibility of a recession. (2) Economists reach agreement that the economy is
moving into a recession. (3) A tax cut is
proposed in Congress. (4) The tax cut is passed by
Congress and signed by the president. (5) Consumption spending begins to rise, aggregate demand
increases, and the economy begins to recover. The administrative lag of fiscal policy is reflected
in events
129.
Which of the following best describes the idea of a political business cycle?
130.
The political business cycle refers to the possibility that
33–86
Copyright © 2018 McGraw-Hill Education. All rights reserved. No reproduction or distribution without the prior
written consent of McGraw-Hill Education.
D.
recessions coincide with election years.
131.
The crowding-out effect of expansionary fiscal policy suggests that
132.
The crowding-out effect of expansionary fiscal policy suggests that
133.
The financing of a government deficit increases interest rates and, as a result, reduces
investment spending. This statement describes
134.
The crowding-out effect is
135.
Which of the following fiscal policy actions is most likely to increase aggregate supply?
33–88
Copyright © 2018 McGraw-Hill Education. All rights reserved. No reproduction or distribution without the prior
written consent of McGraw-Hill Education.
Learning Objective: 33-05 Discuss the problems that governments may encounter in
enacting and applying fiscal policy.
Test Bank: I
Topic:
Problems, Criticisms, and Complications of Implementing Fiscal Policy
136.
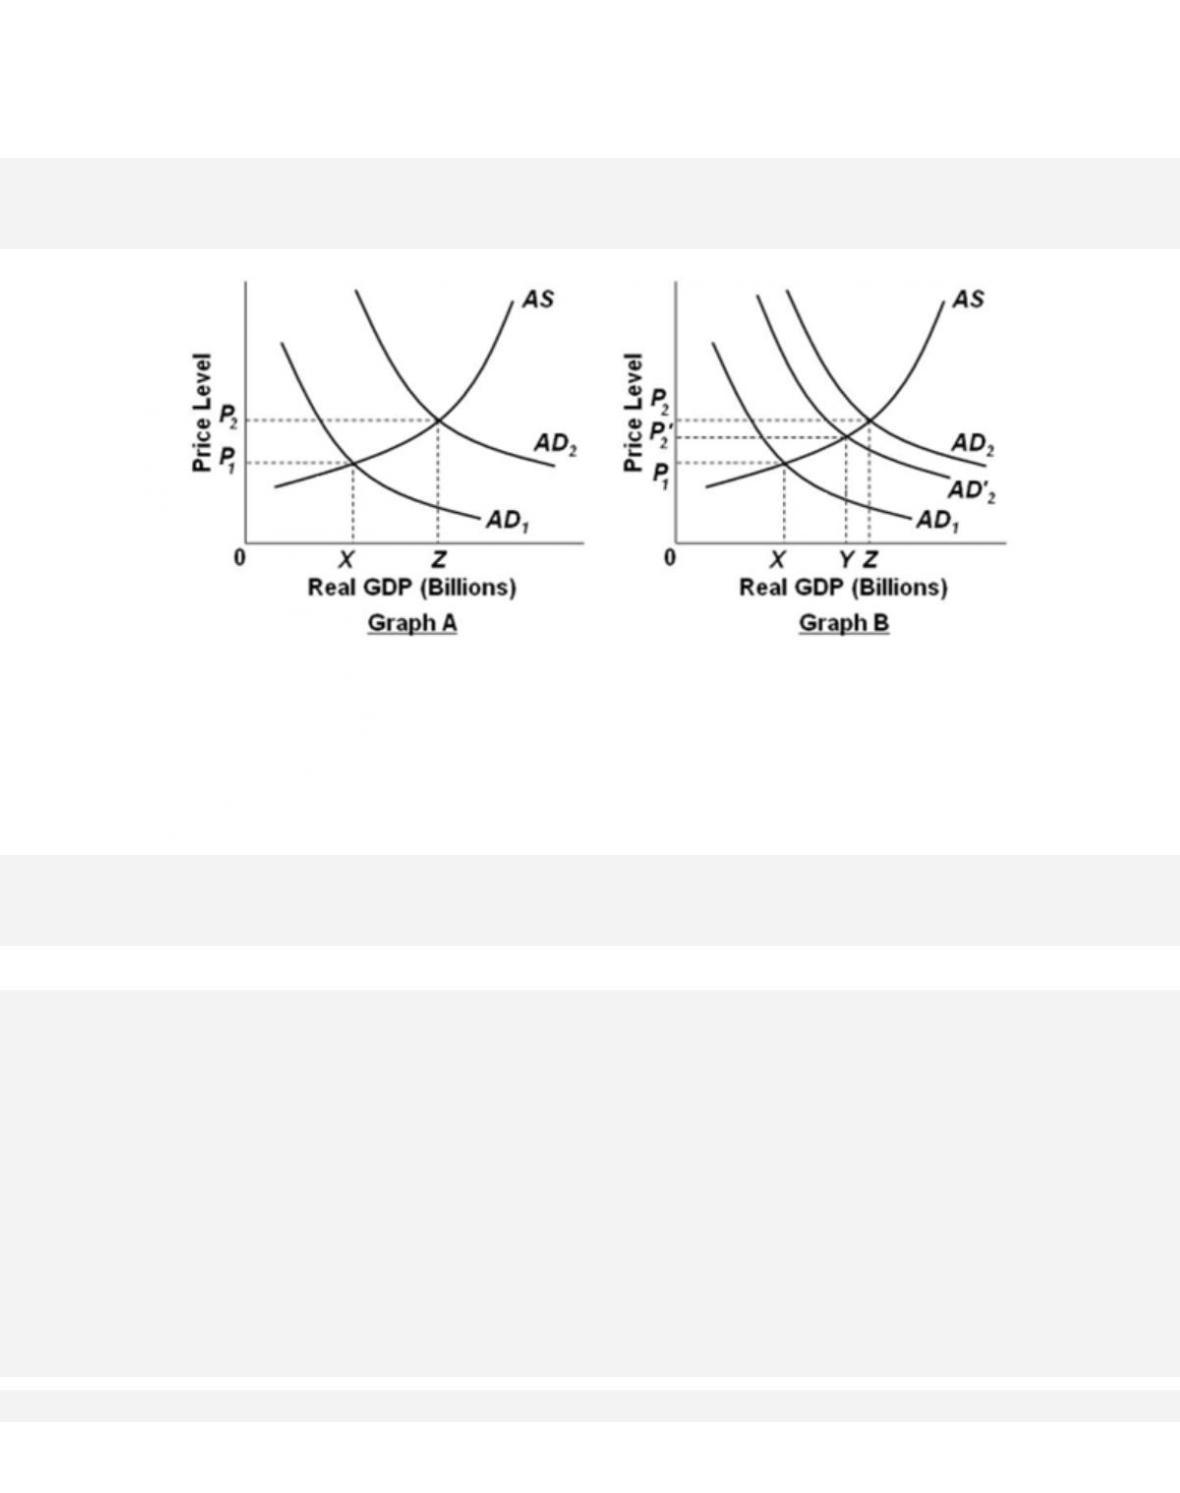
Refer to the diagrams. Suppose that government undertakes fiscal policy designed to increase
aggregate demand from AD1 to AD2 and thereby to increase GDP from
X to Z. In terms of graph B, which of the following might explain why GDP increases to Y rather
than to Z?
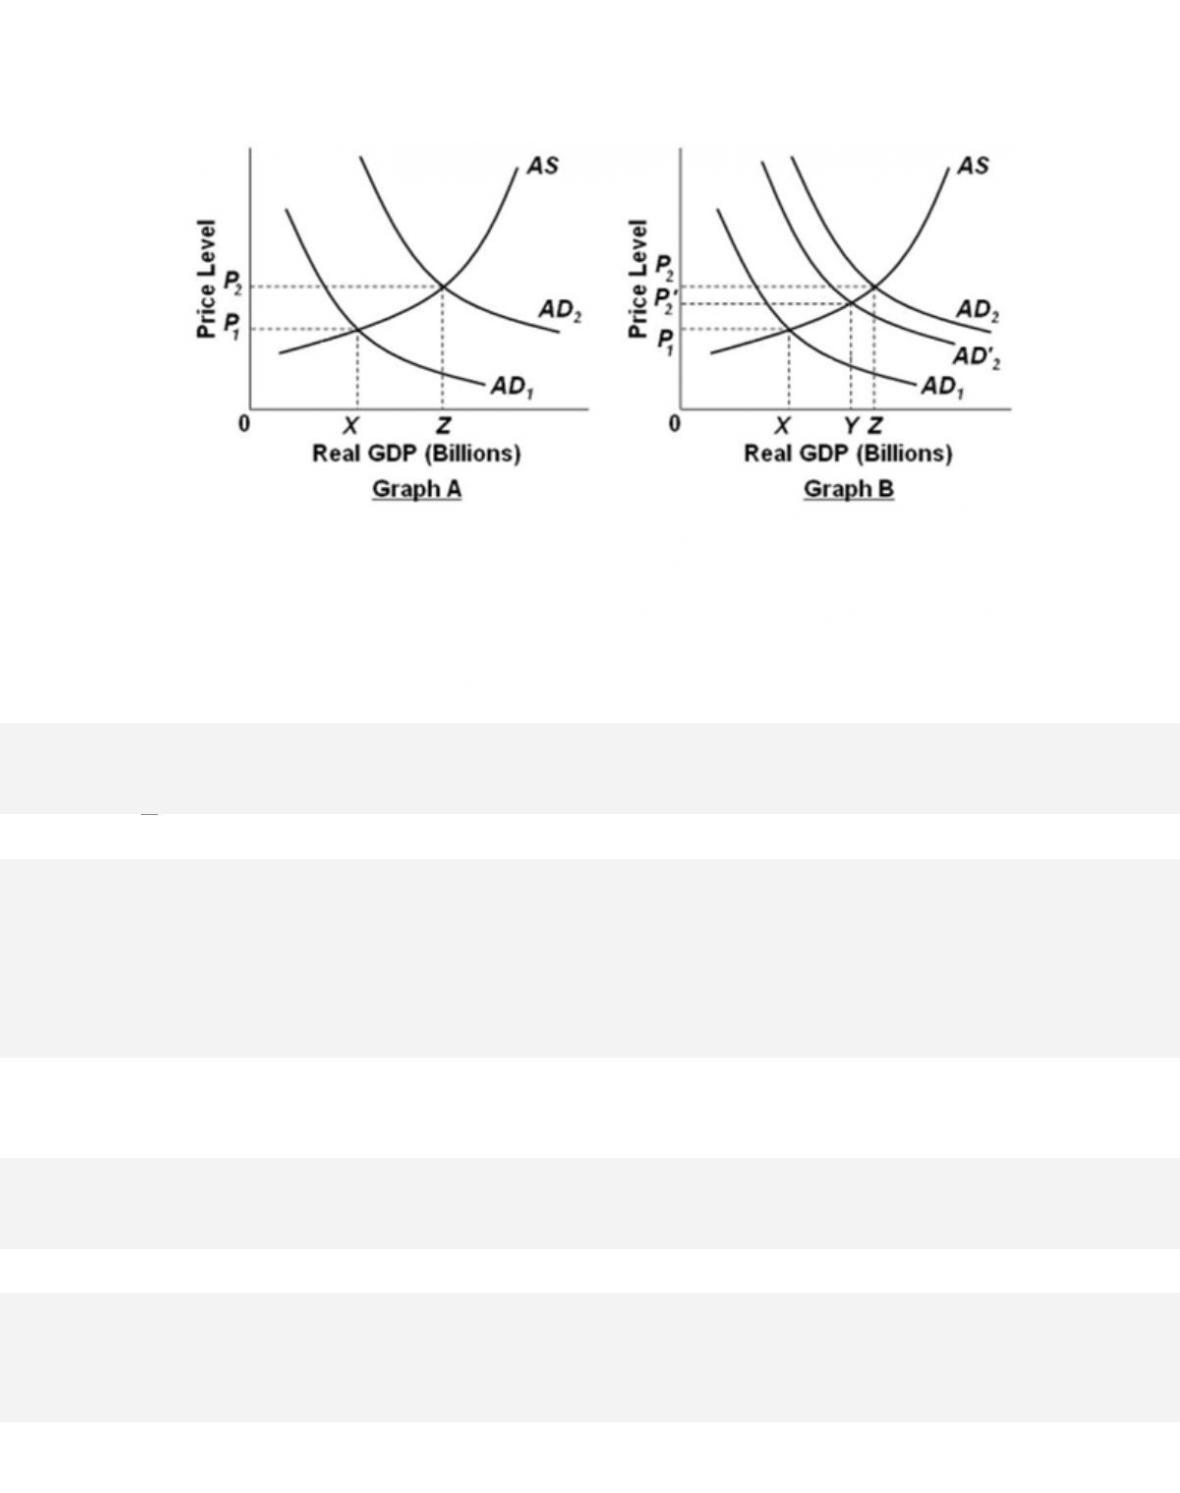
137.
Refer to the diagrams. Suppose that government undertakes fiscal policy designed to increase
aggregate demand from AD1 to AD2 and thereby to increase GDP from
X to Z. In terms of graph B, which of the following might explain why GDP increases to Y rather
than to Z?
138.
The U.S. public debt
33–90
Copyright © 2018 McGraw-Hill Education. All rights reserved. No reproduction or distribution without the prior
written consent of McGraw-Hill Education.
Blooms: Understand
Diffic ult y: 02 Medium
Learning Objective: 33-06 Discuss the size, composition, and consequences of the U.S.
public debt.
Test Bank: I
Topic:
The U.S. Public Debt
139.
The public debt is the amount of money that
140.
The public debt is held as
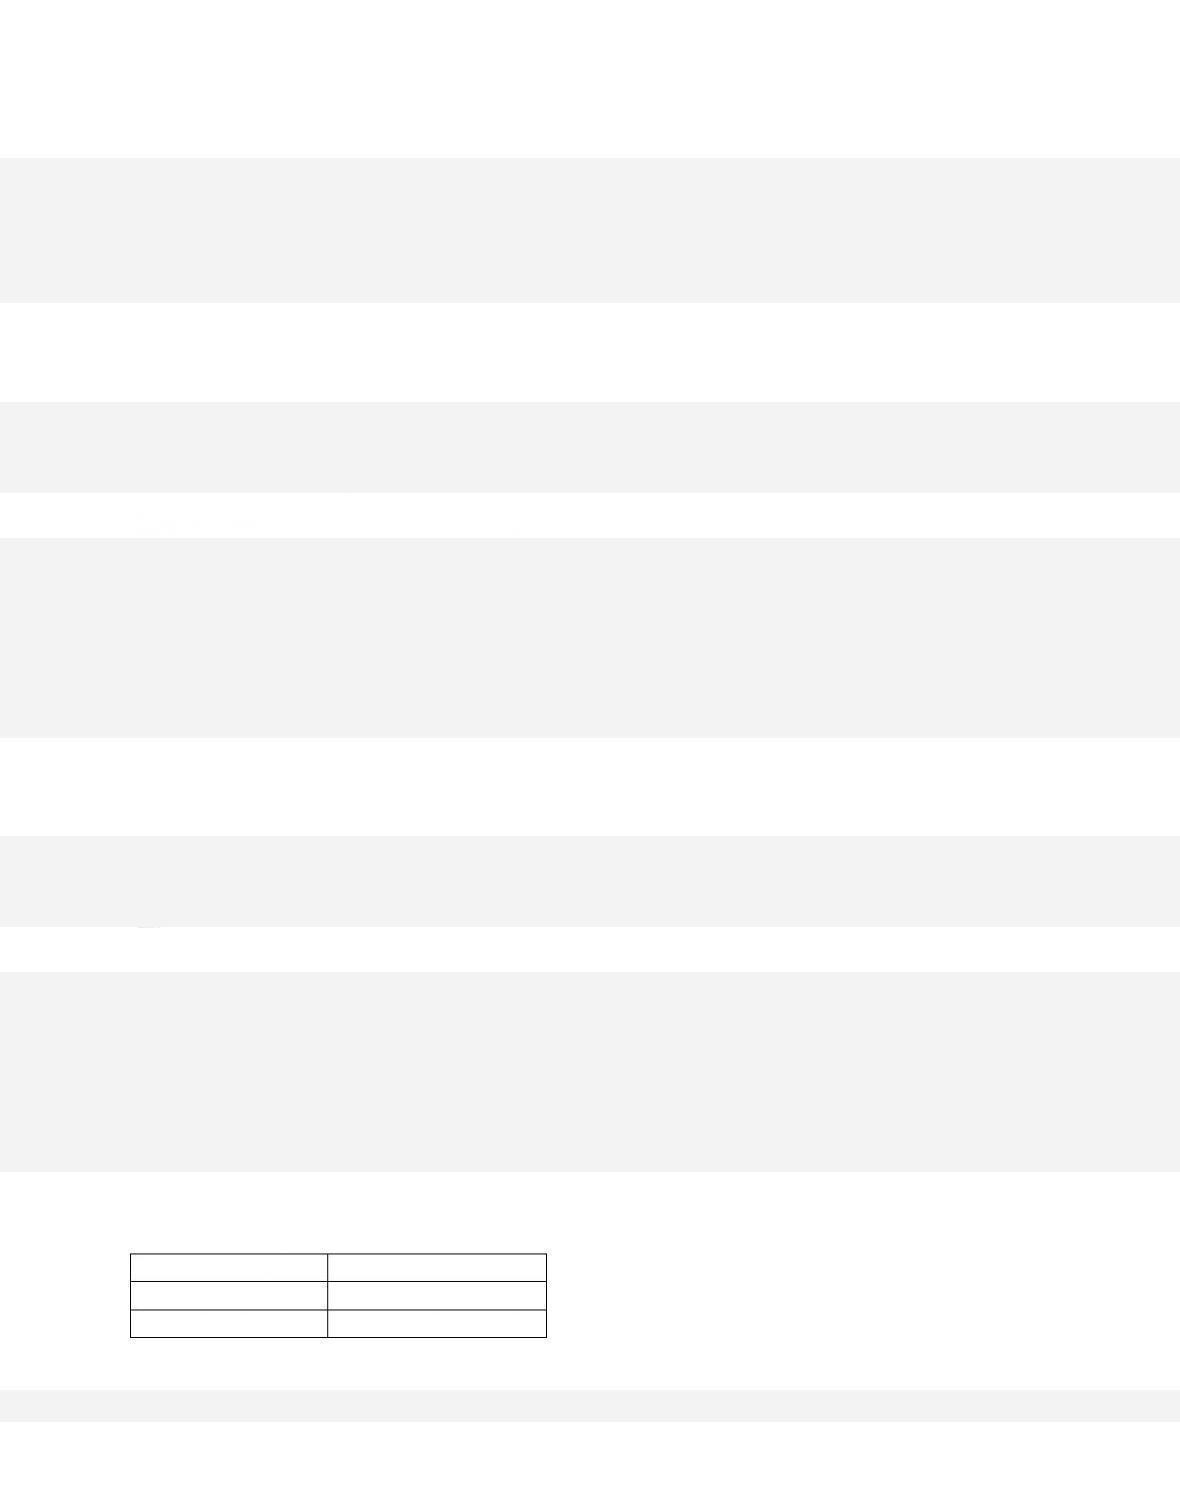
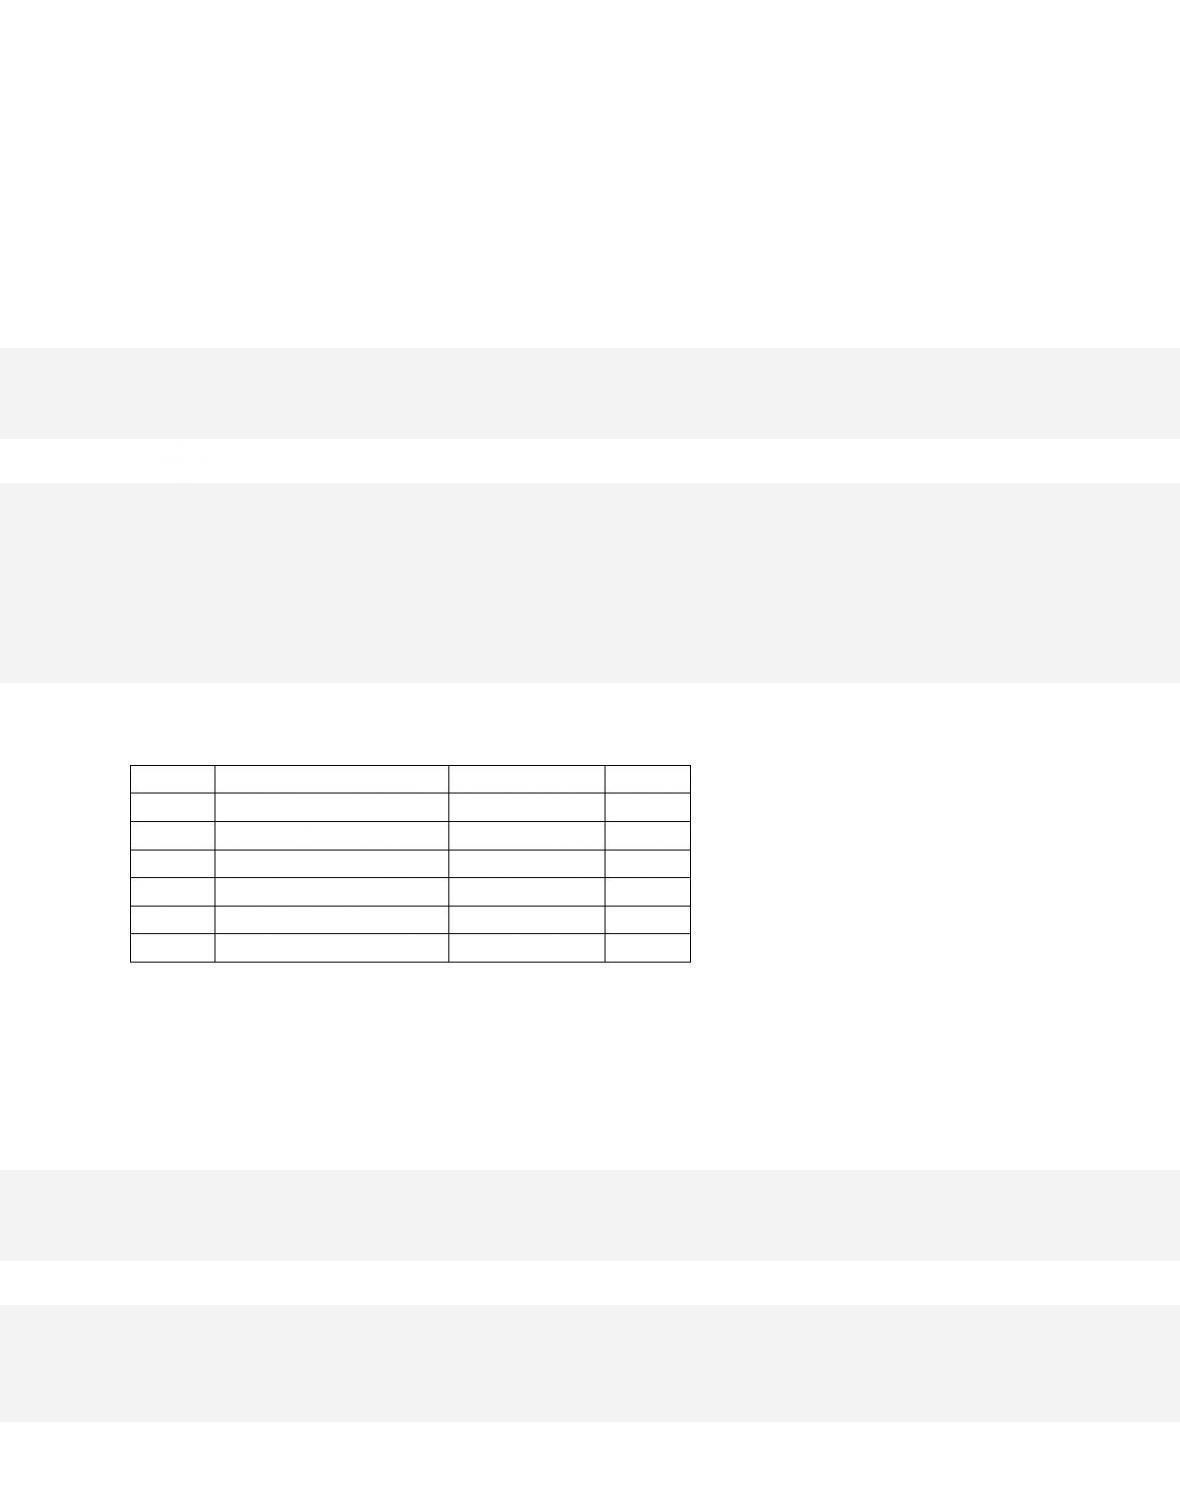
141.
Security
Amount (in Billions)
Treasury Bills
$220
Corporate Bonds
140
Treasury Notes
80
Corporate Stock
200
US Savings Bonds
60
Treasury Bonds
100
The public debt for the economy is
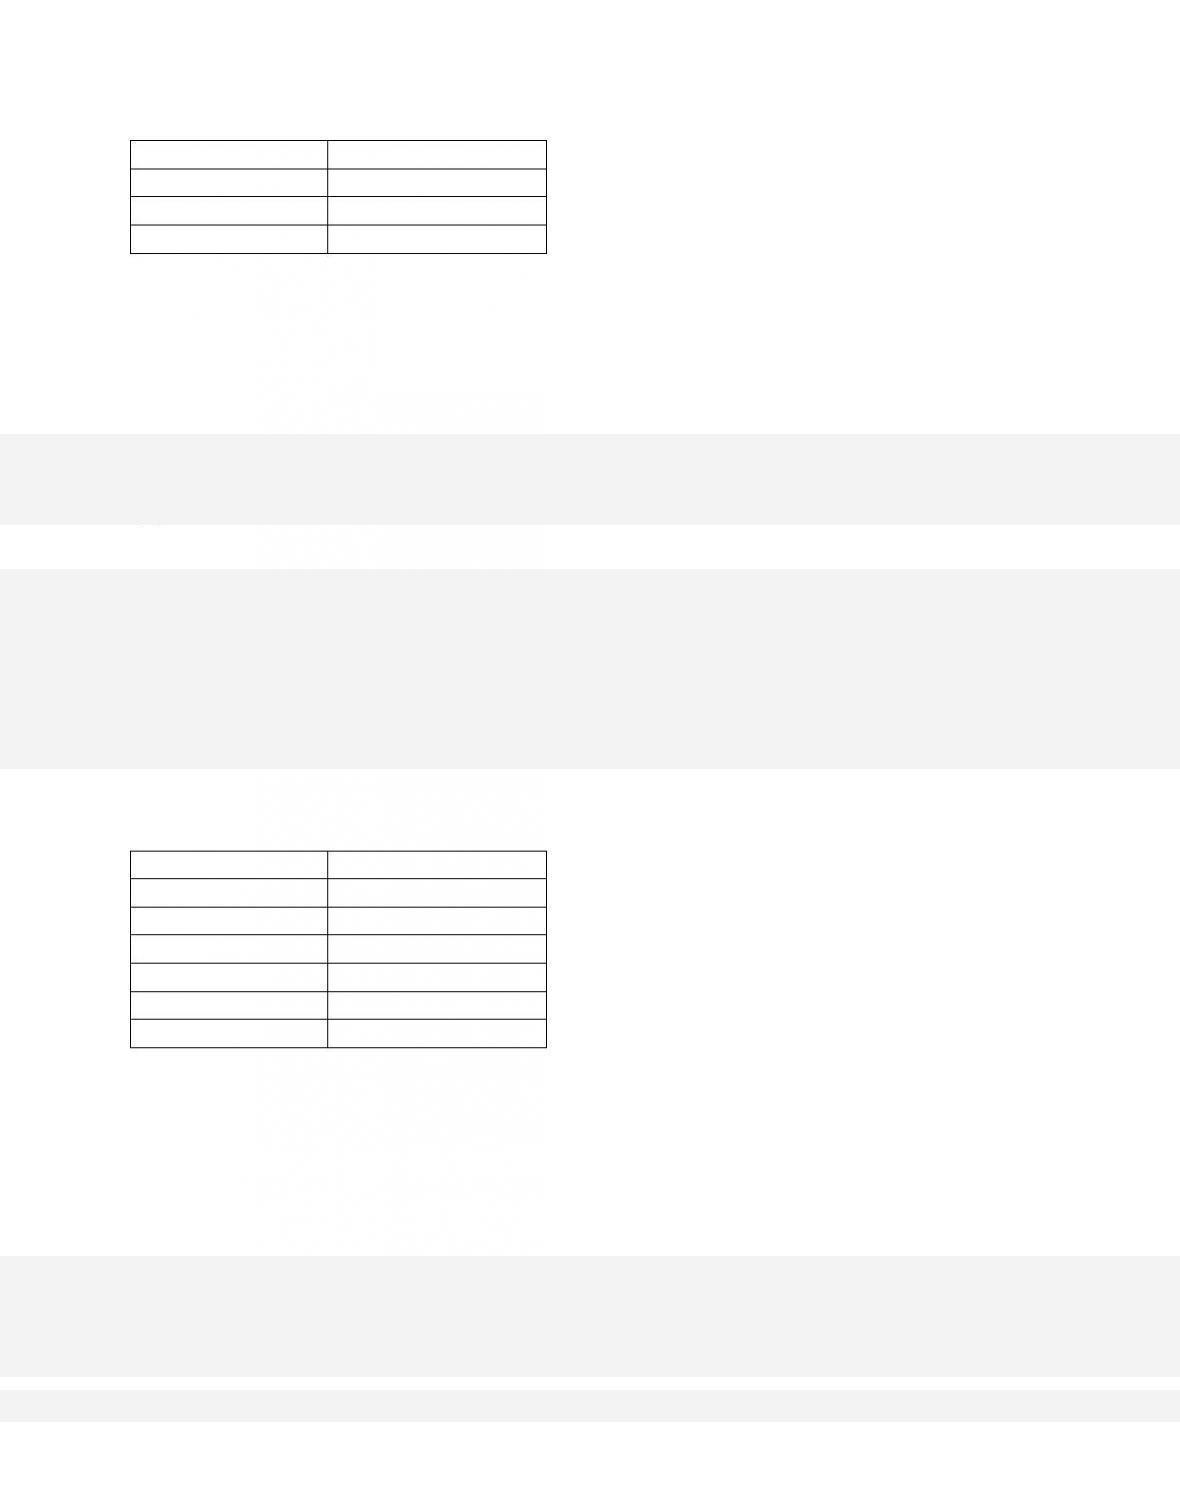
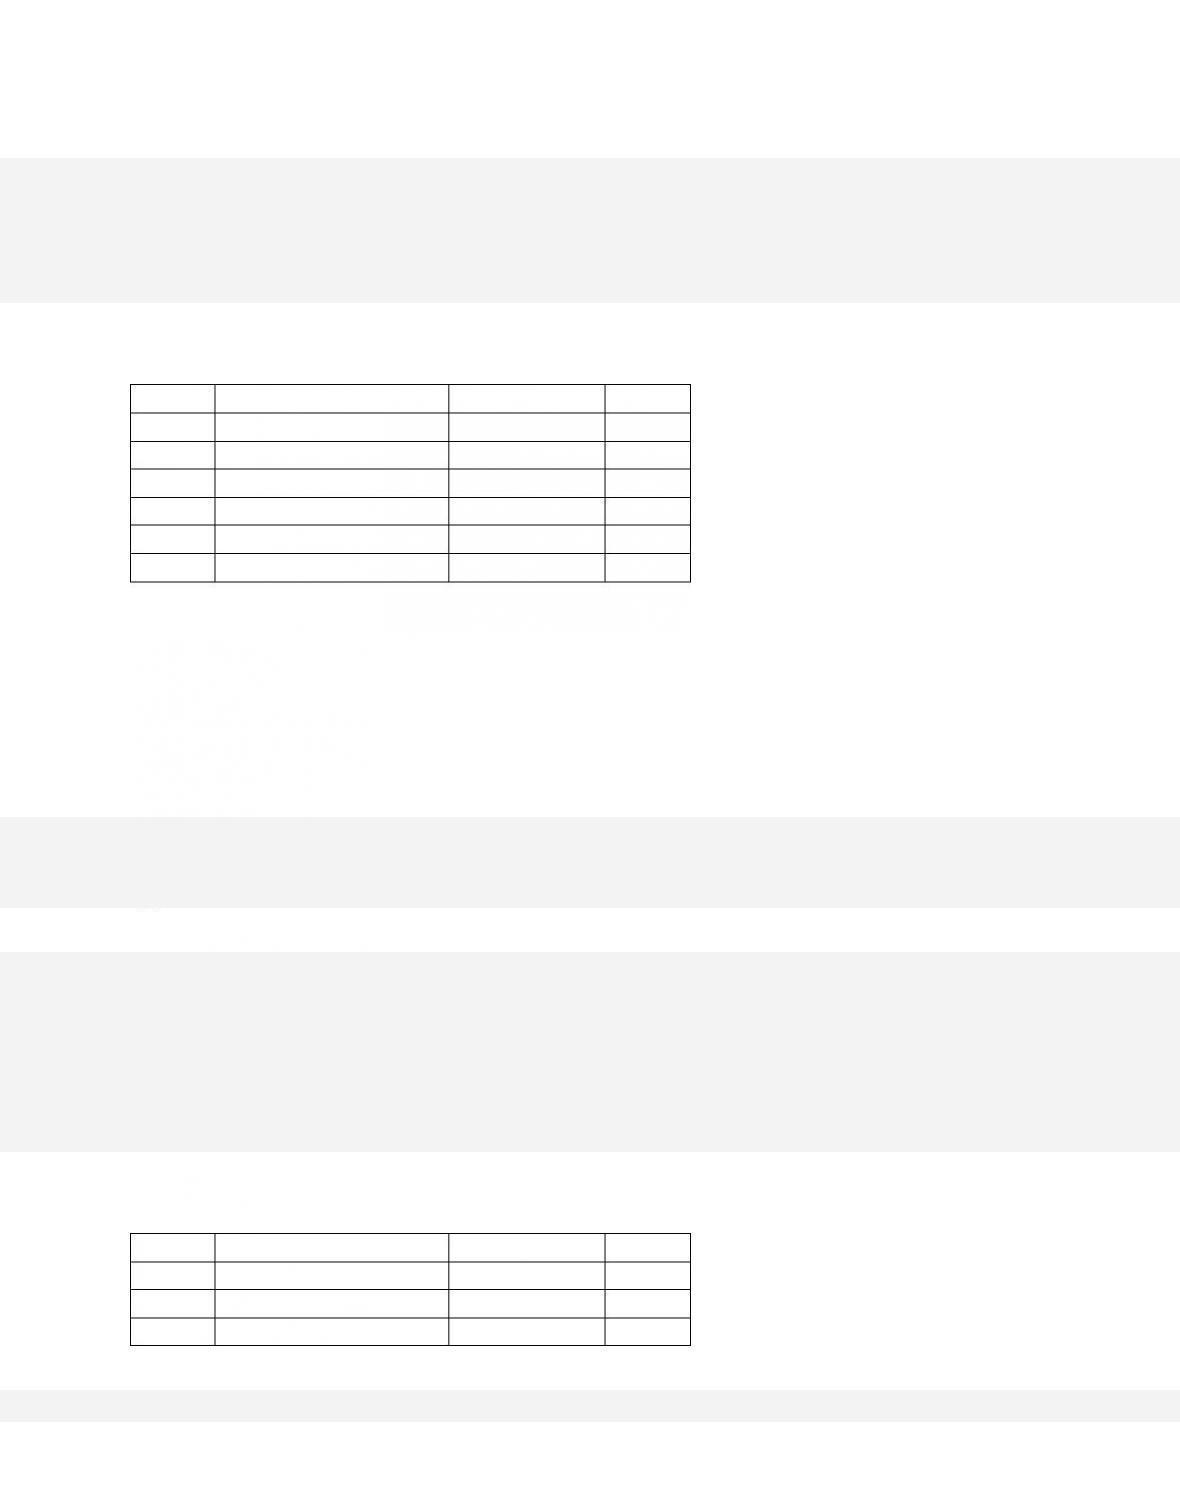
142.
Security
Amount (in Billions)
Treasury Bills
$220
Corporate Bonds
140
Treasury Notes
80
Corporate Stock
200
US Savings Bonds
60
Treasury Bonds
100
Other things equal, an increase of Treasury bonds from $100 billion to $120 billion in the
economy would
33–92
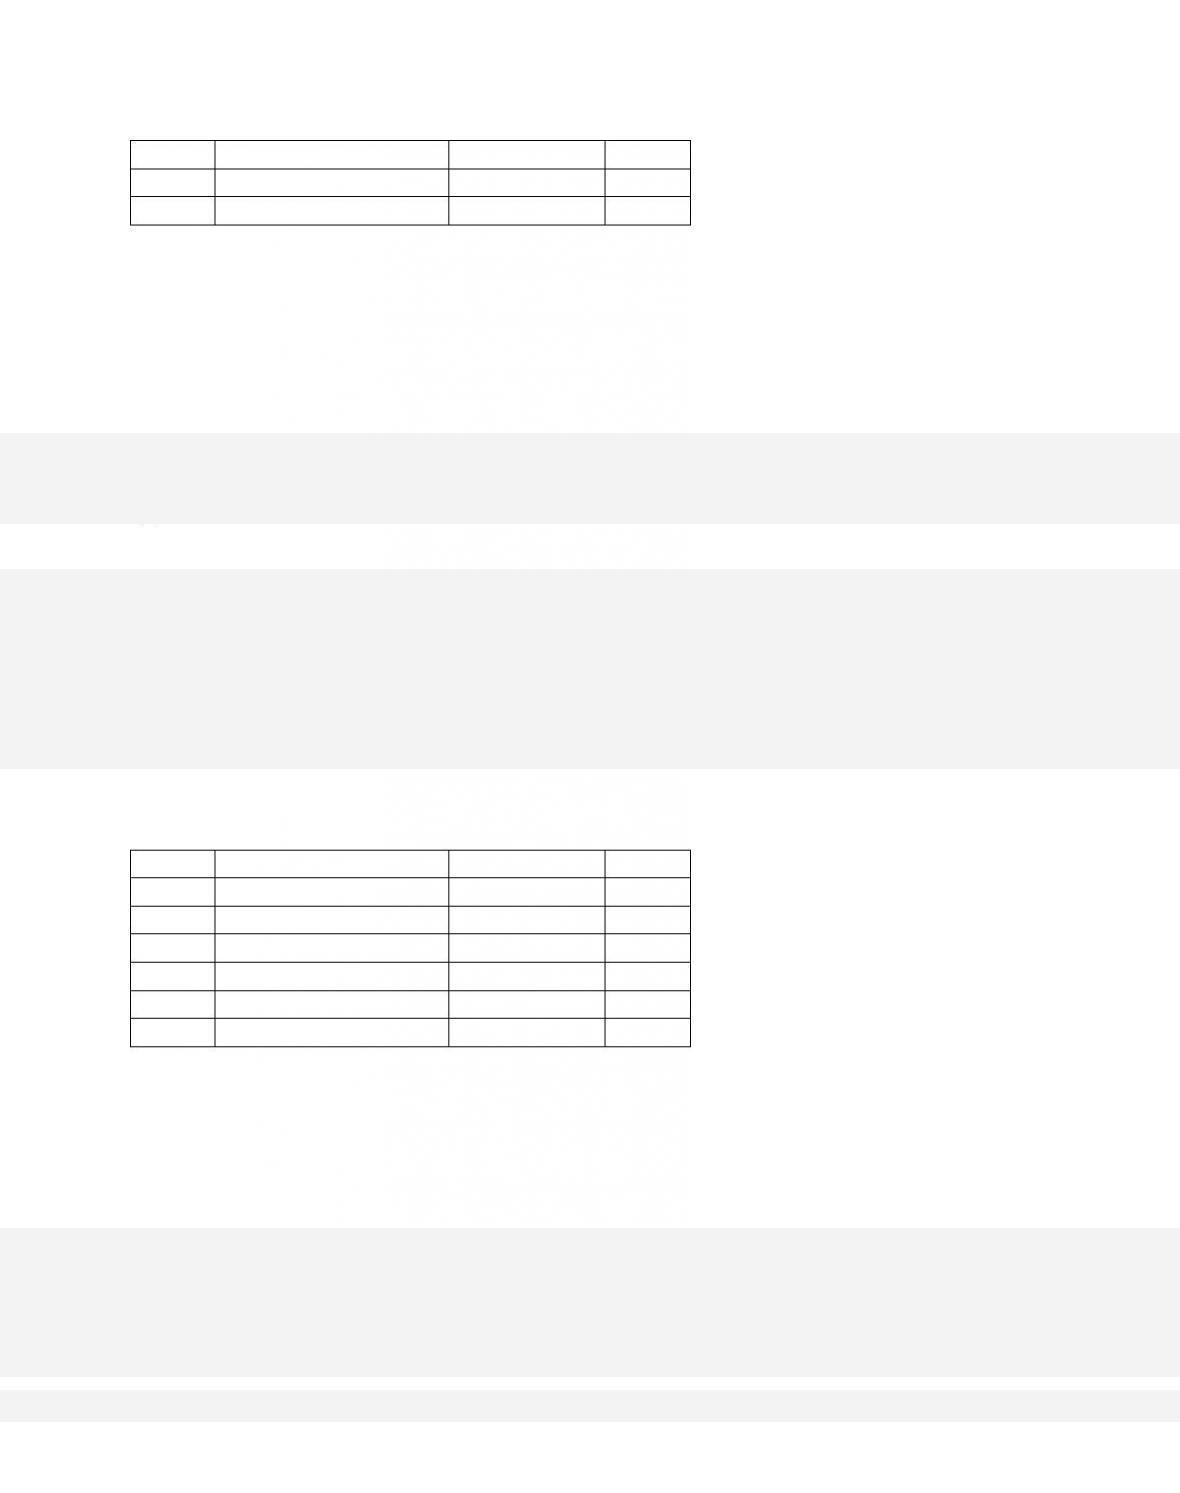
143.
Security
Amount (in Billions)
Treasury Bills
$220
Corporate Bonds
140
Treasury Notes
80
Corporate Stock
200
US Savings Bonds
60
Treasury Bonds
100
Other things equal, an increase of corporate bonds from $140 billion to $150 billion in the
economy would
in year 2 but had budget surpluses of $20 billion in year 3 and $50
billion in year 4. Also assume
that it used its budget surpluses to pay down the public debt. At the end of these four years, the
federal government’s public debt
would have
33–93
145.
Suppose the federal government had budget surpluses of $80 billion in year 1 and $120
billion in year 2 but had budget deficits of $10 billion in year 3 and $40
billion in year 4. Also
assume that it used its budget surpluses to pay down the public debt. At the end of these four
years, the federal government‘s public debt
would have
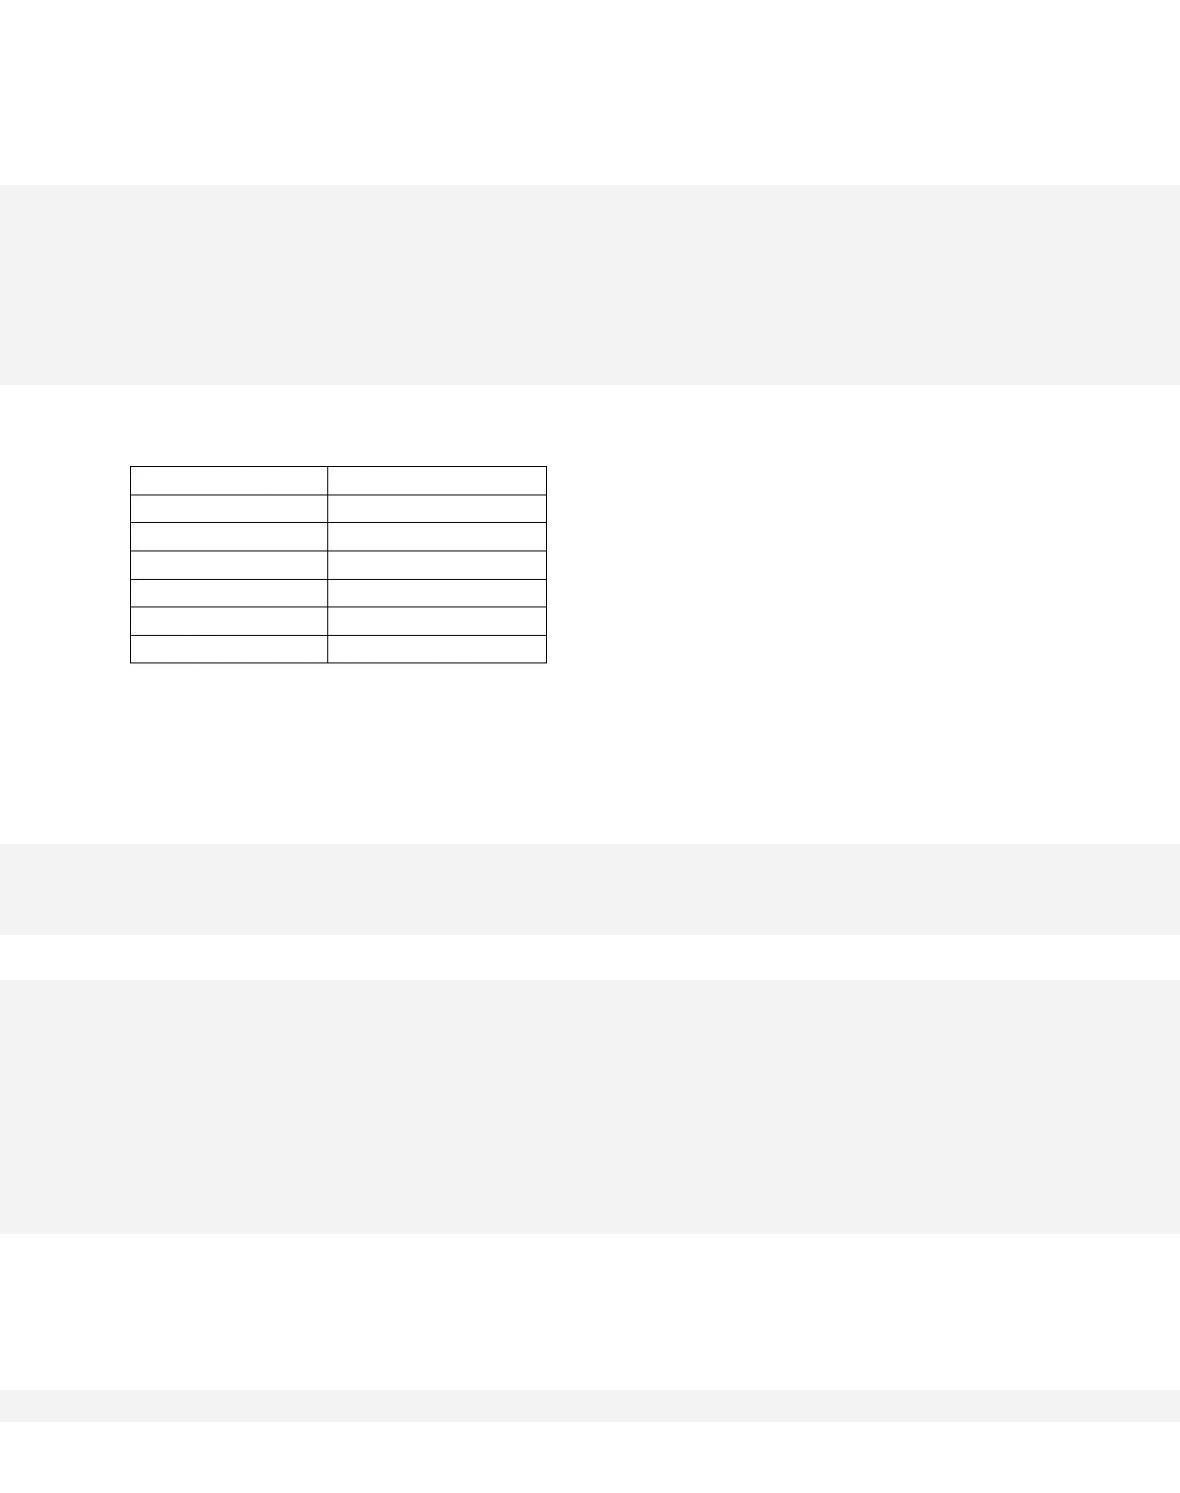
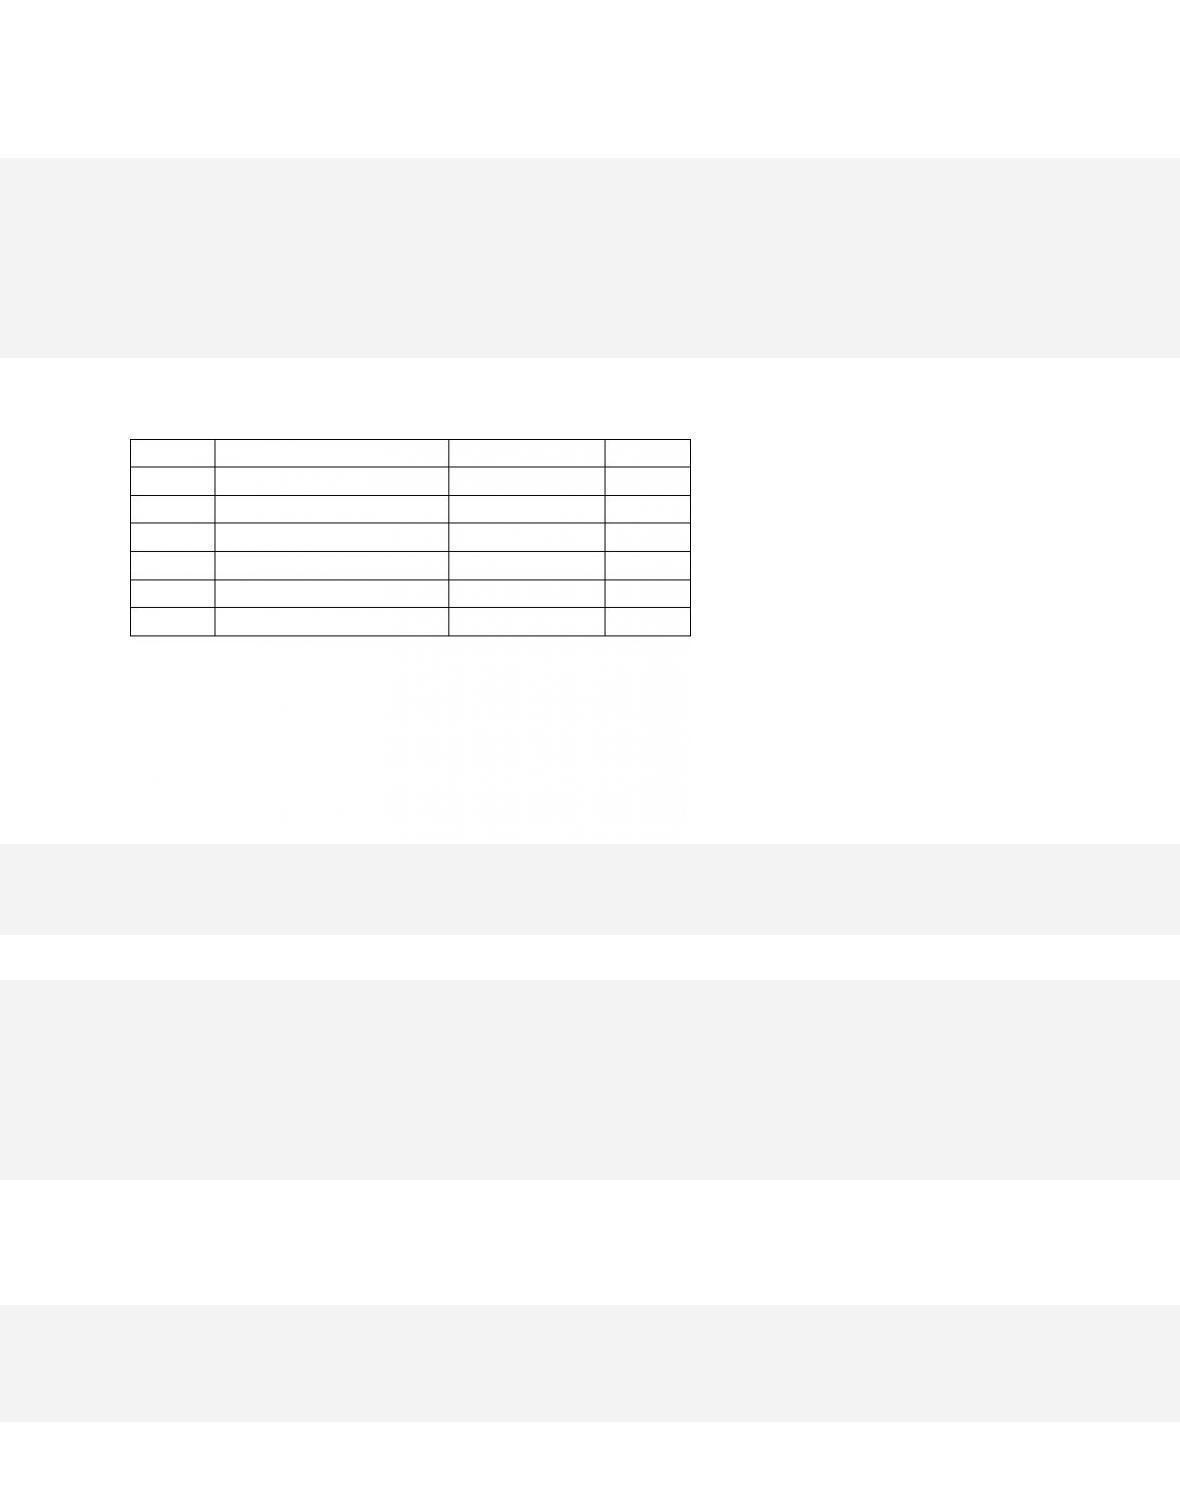
146.
Government Spending
Tax Revenues
GDP
Year 1
$450
$425
$2,000
Year 2
500
450
3,000
Year 3
600
500
4,000
Year 4
640
620
5,000
Year 5
680
580
4,800
Year 6
600
620
5,000
The accompanying table gives budget information for a hypothetical economy. Assume that all
budget surpluses are used to pay down the public debt. If year 1 is the
first year of this nation‘s
existence and year 6 is the present year, this nation‘s public debt is
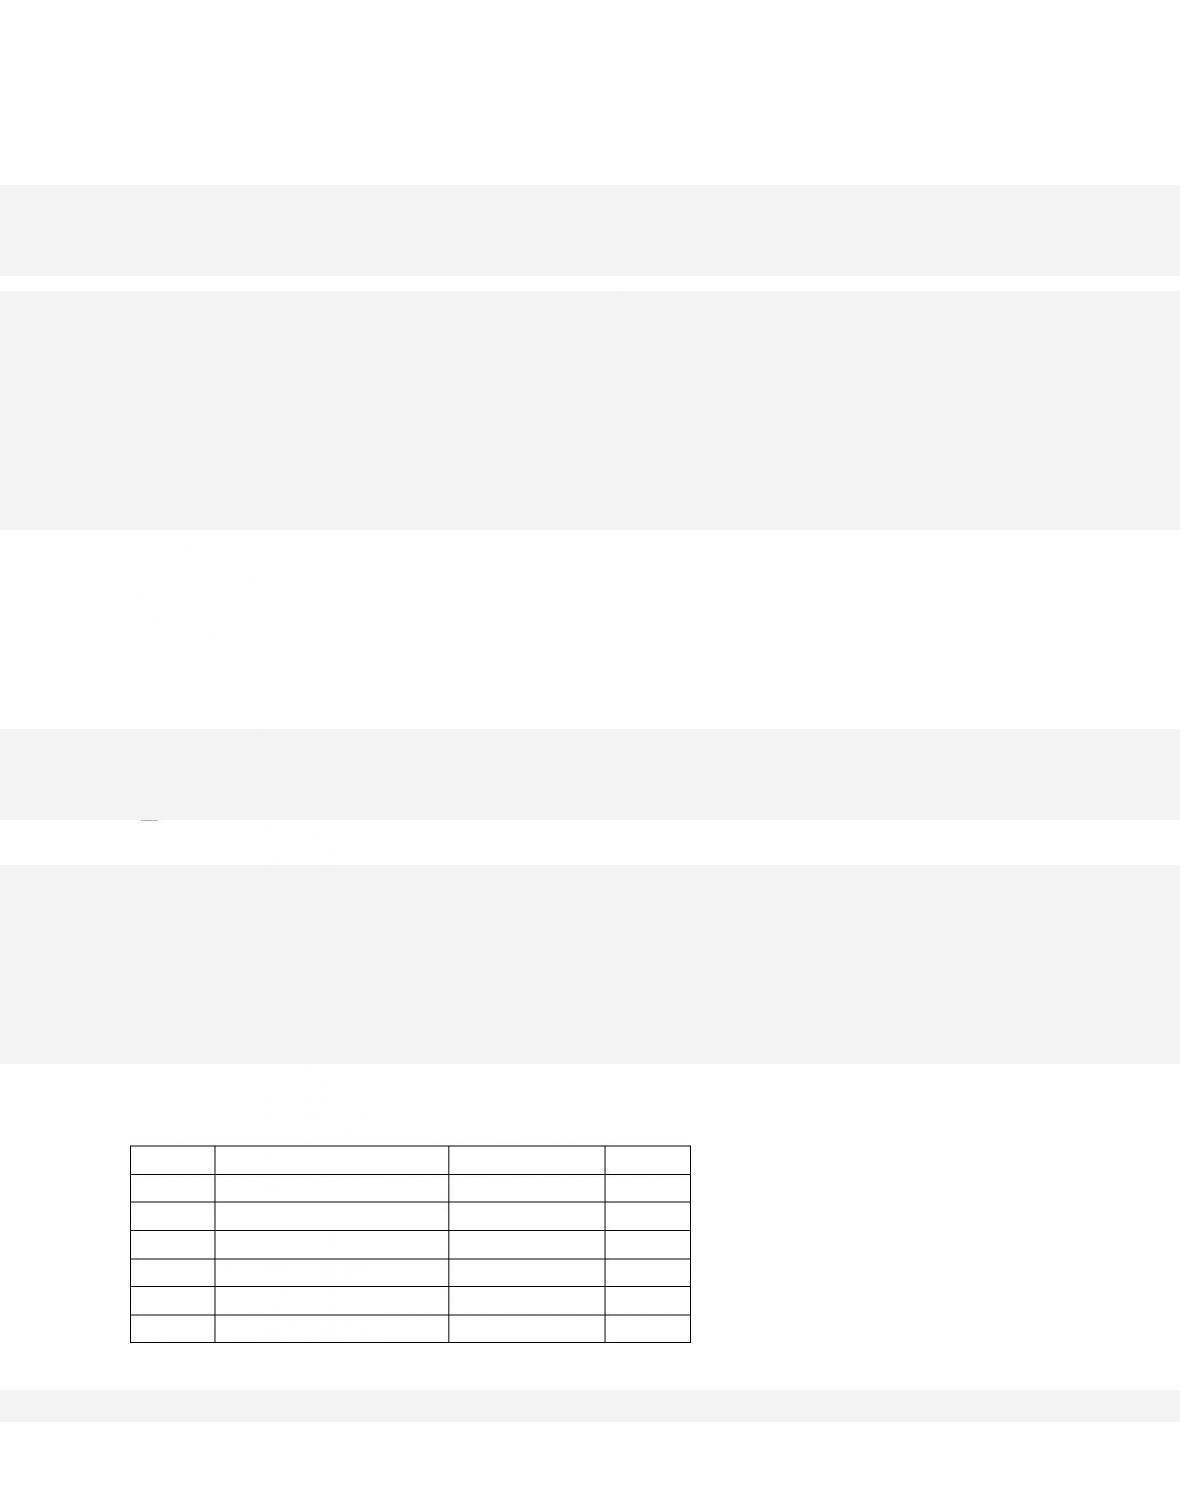
147.
Government Spending
Tax Revenues
GDP
Year 1
$450
$425
$2,000
Year 2
500
450
3,000
Year 3
600
500
4,000
Year 4
640
620
5,000
Year 5
680
580
4,800
Year 6
600
620
5,000
The accompanying table gives budget information for a hypothetical economy. Assume that all
budget surpluses are used to pay down the public debt. The budget
deficit in year 3 is
33–95
Copyright © 2018 McGraw-Hill Education. All rights reserved. No reproduction or distribution without the prior
written consent of McGraw-Hill Education.
Diff i cult y :
02 Medium
Learning Objective: 33-06 Discuss the size, composition, and consequences of the U.S.
public debt.
Test Bank: I
Topic: The U.S. Public Debt
Type: Table
148.
Government Spending
Tax Revenues
GDP
Year 1
$450
$425
$2,000
Year 2
500
450
3,000
Year 3
600
500
4,000
Year 4
640
620
5,000
Year 5
680
580
4,800
Year 6
600
620
5,000
The accompanying table gives budget information for a hypothetical economy. Assume that all
budget surpluses are used to pay down the public debt. If year 1 is the
first year of this nation‘s
existence and year 4 is the present year, the public debt as a percentage of GDP in year 4 is
149.
Government Spending
Tax Revenues
GDP
Year 1
$450
$425
$2,000
Year 2
500
450
3,000
Year 3
600
500
4,000
Year 4
640
620
5,000
Year 5
680
580
4,800
Year 6
600
620
5,000
The accompanying table gives budget information for a hypothetical economy. Assume that all
budget surpluses are used to pay down the public debt. A budget
surplus occurred in year
150.
Government Spending
Tax Revenues
GDP
Year 1
$450
$425
$2,000
Year 2
500
450
3,000
Year 3
600
500
4,000
Year 4
640
620
5,000
Year 5
680
580
4,800
Year 6
600
620
5,000
The accompanying table gives budget information for a hypothetical economy. Assume that all
budget surpluses are used to pay down the public debt. The public
debt declined in year
33–97
Copyright © 2018 McGraw-Hill Education. All rights reserved. No reproduction or distribution without the prior
written consent of McGraw-Hill Education.
AACSB: Knowledge Application
Blooms: Understand
Diffic ult y: 02 Medium
Learning Objective: 33-06 Discuss the size, composition, and consequences of the U.S.
public debt.
Test Bank: I
Topic: The U.S. Public Debt
Type: Table
151.
Government Spending
Tax Revenues
GDP
Year 1
$450
$425
$2,000
Year 2
500
450
3,000
Year 3
600
500
4,000
Year 4
640
620
5,000
Year 5
680
580
4,800
Year 6
600
620
5,000
The accompanying table gives budget information for a hypothetical economy. Assume that all
budget surpluses are used to pay down the public debt. As a
percentage of GDP, the
152.
Which of the following historically has not been a significant contributor to the U.S. public
debt?
33–98
Copyright © 2018 McGraw-Hill Education. All rights reserved. No reproduction or distribution without the prior
written consent of McGraw-Hill Education.
C.
recessions
D. demand-pull inflation
153.
Recessions have contributed to the public debt by
154.
Which of the following statements is correct?

155.
In 2015, the U.S. federal debt held by the public was
156.
In 2015, the U.S. public debt was about
157.
The average tax rate required to service the public debt is roughly measured by
33-100
Copyright © 2018 McGraw-Hill Education. All rights reserved. No reproduction or distribution without the prior
written consent of McGraw-Hill Education.
public debt.
Test Bank: I
Topic:
The U.S. Public Debt
158.
What percentage of the U.S. public debt is held by U.S. government agencies and the
Federal Reserve (2015)?
159.
Approximately what percentage of the U.S. public debt is held by foreign individuals and
institutions (2015)?
160.
The portion of the public debt held outside federal agencies and the Federal Reserve is