1998
0
0
1999
-3
0
2000
-5
-2
2001
-2
-2
2002
+2
+1
Refer to the table for a fictional economy. The changes in the budget conditions between 2000
and 2001 best reflect
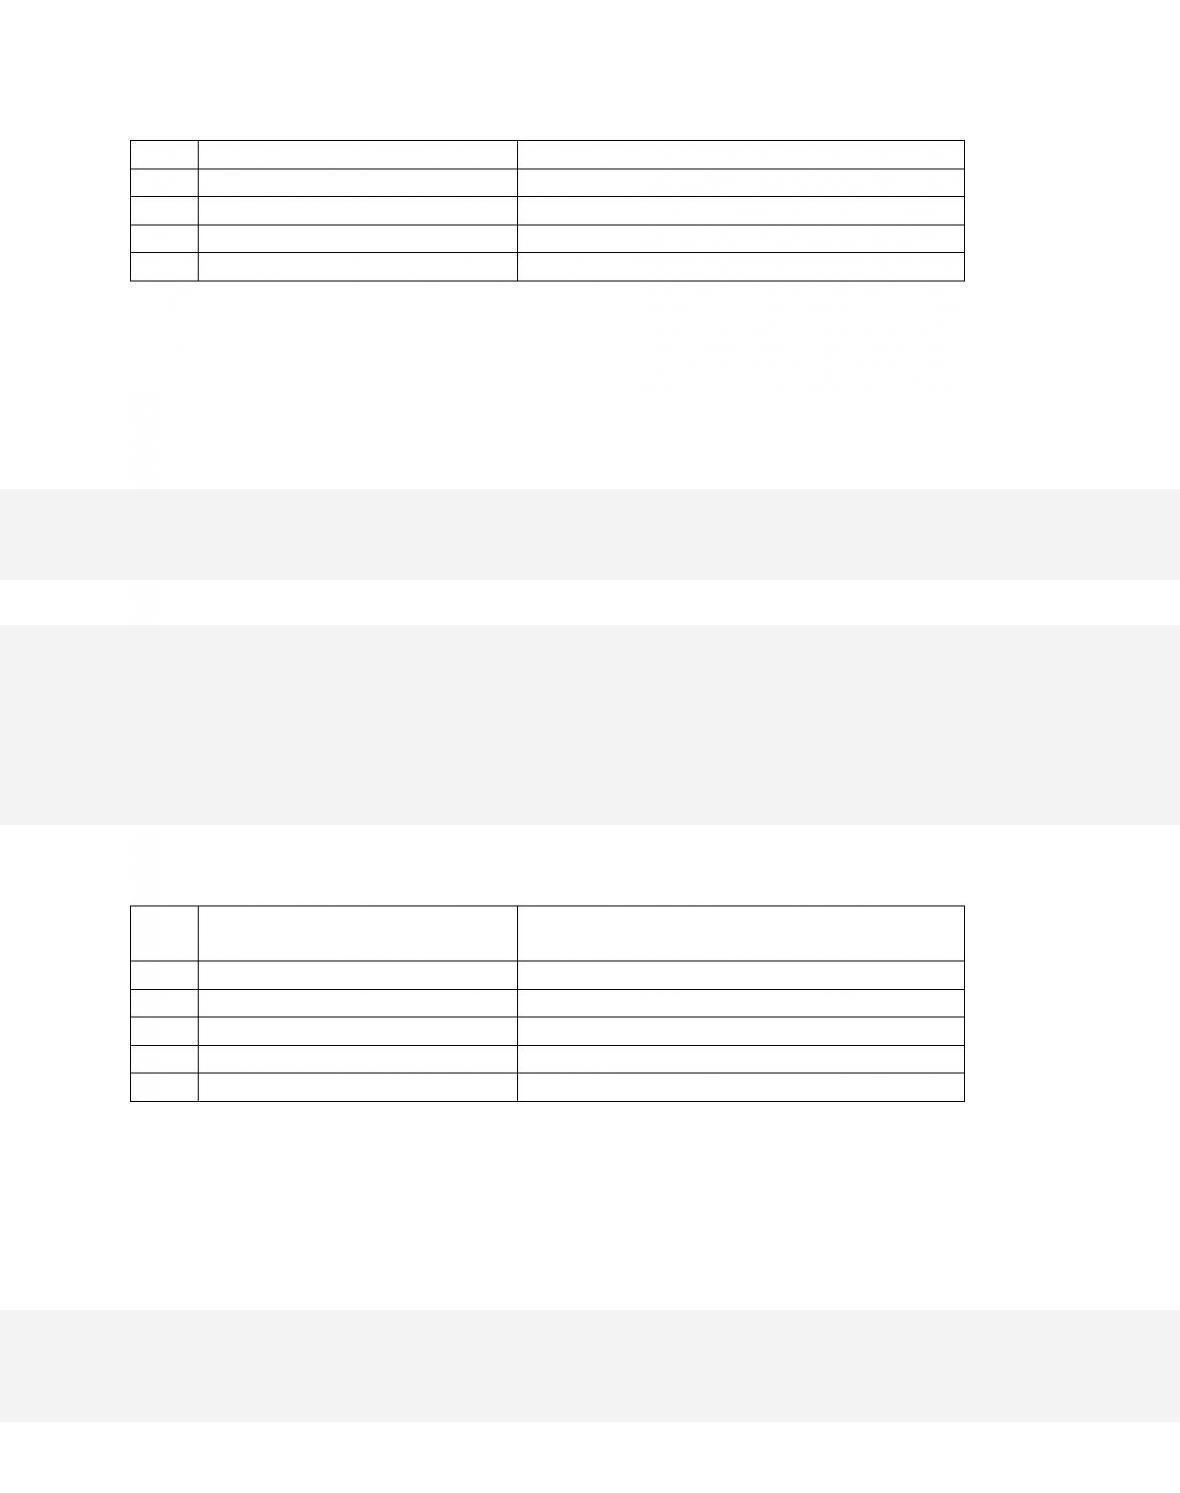
92.
Year
Actual Budget, Percent of GDP
(-deficits, +surpluses)
Cyclically-Adjusted Budget, Percent of GDP
(-deficits, +surpluses)
1998
0
0
1999
-3
0
2000
-5
-2
2001
-2
-2
2002
+2
+1
Refer to the table for a fictional economy. The changes in the budget conditions between 2001
and 2002 best reflect a(n)
33–62
Copyright © 2018 McGraw-Hill Education. All rights reserved. No reproduction or distribution without the prior
written consent of McGraw-Hill Education.
C.
tax increase.
D. contractionary fiscal policy.
93.
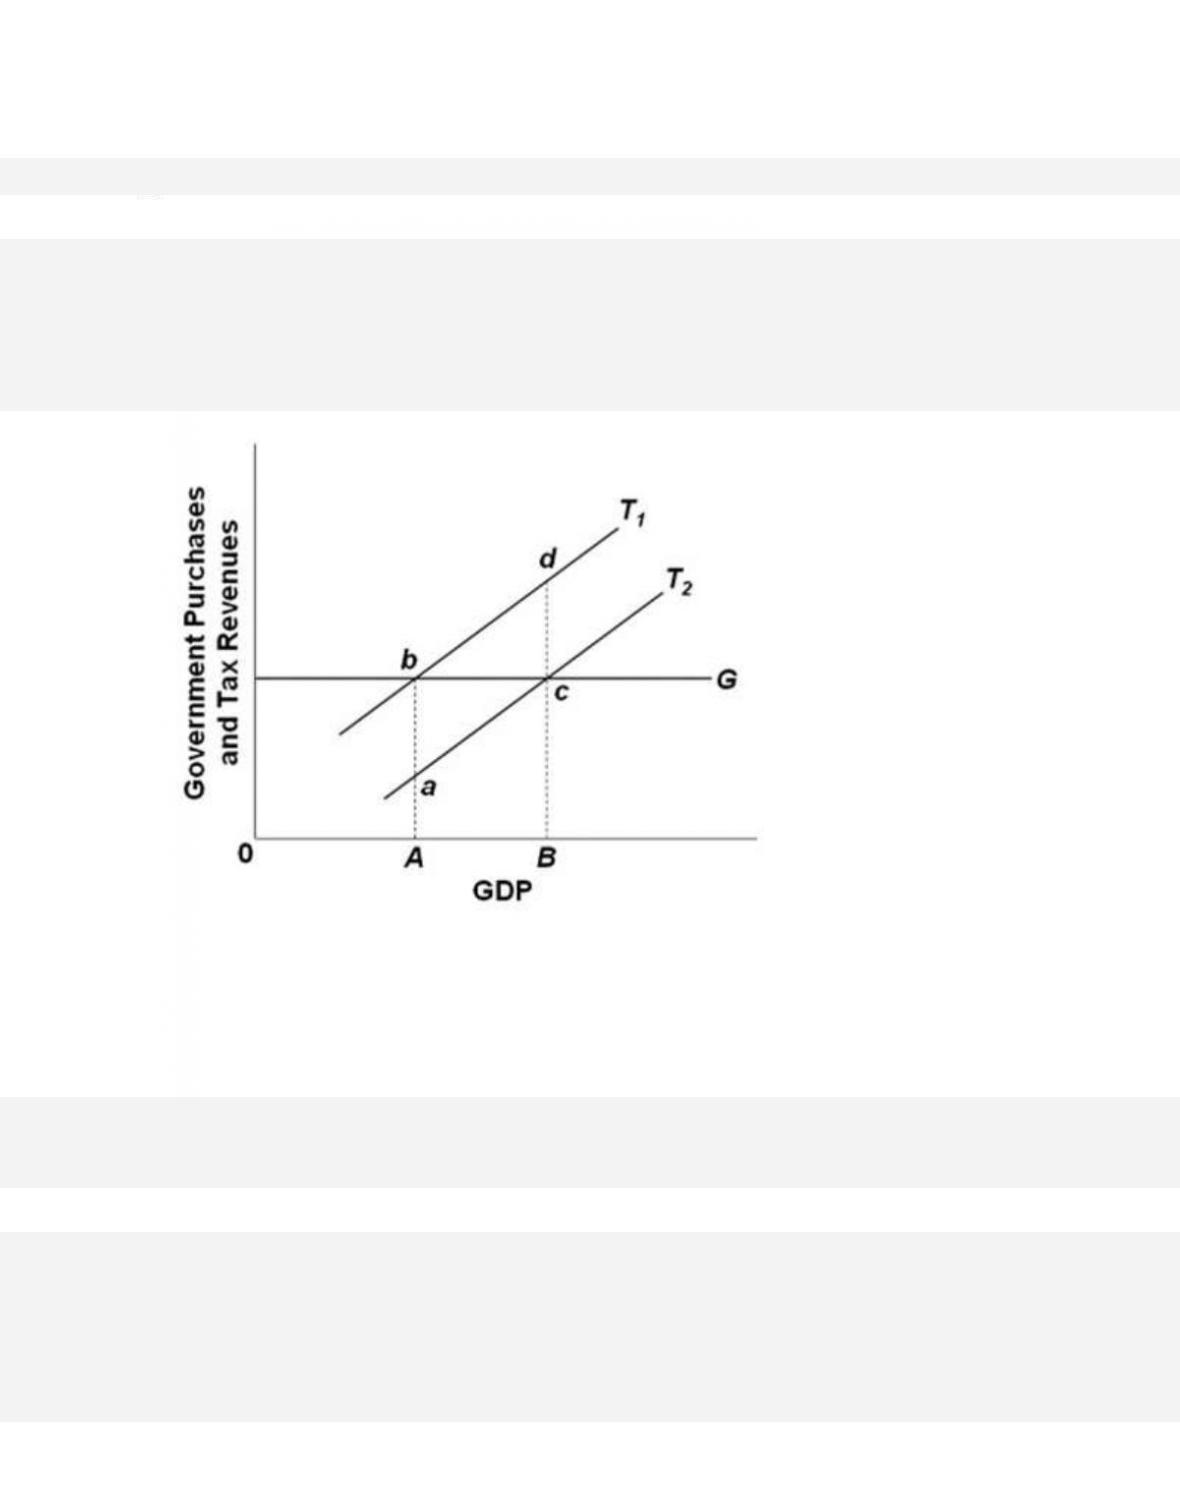
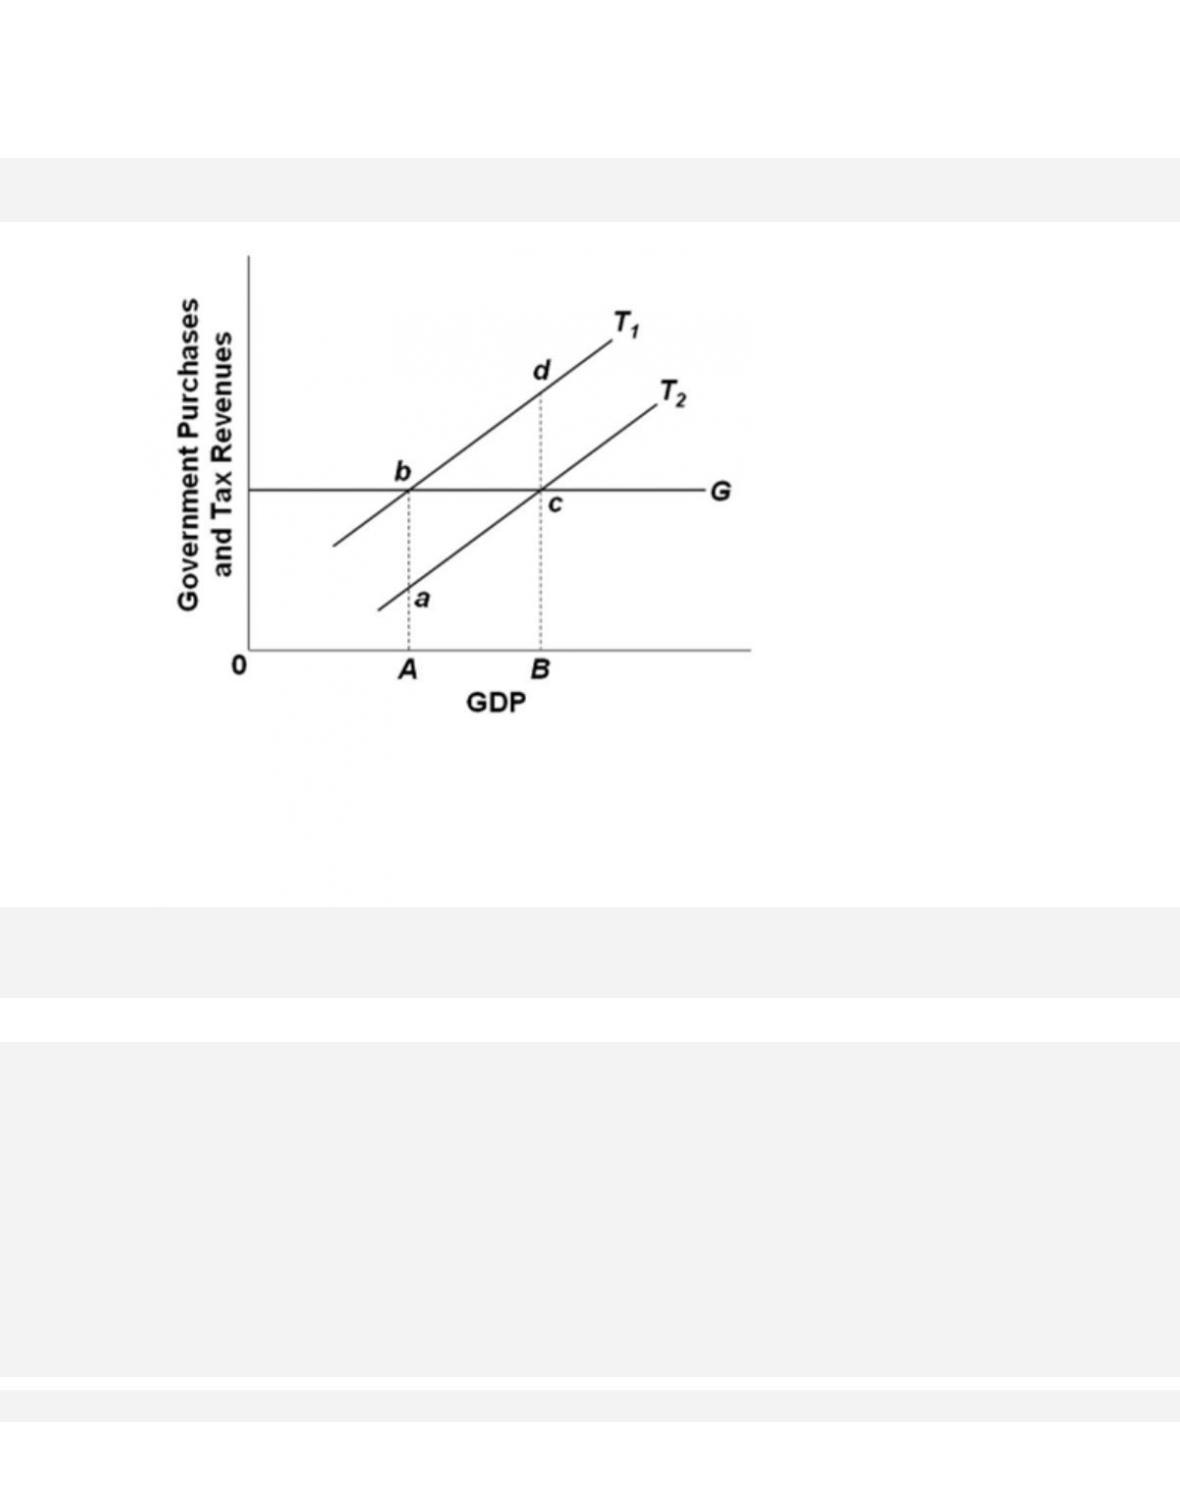
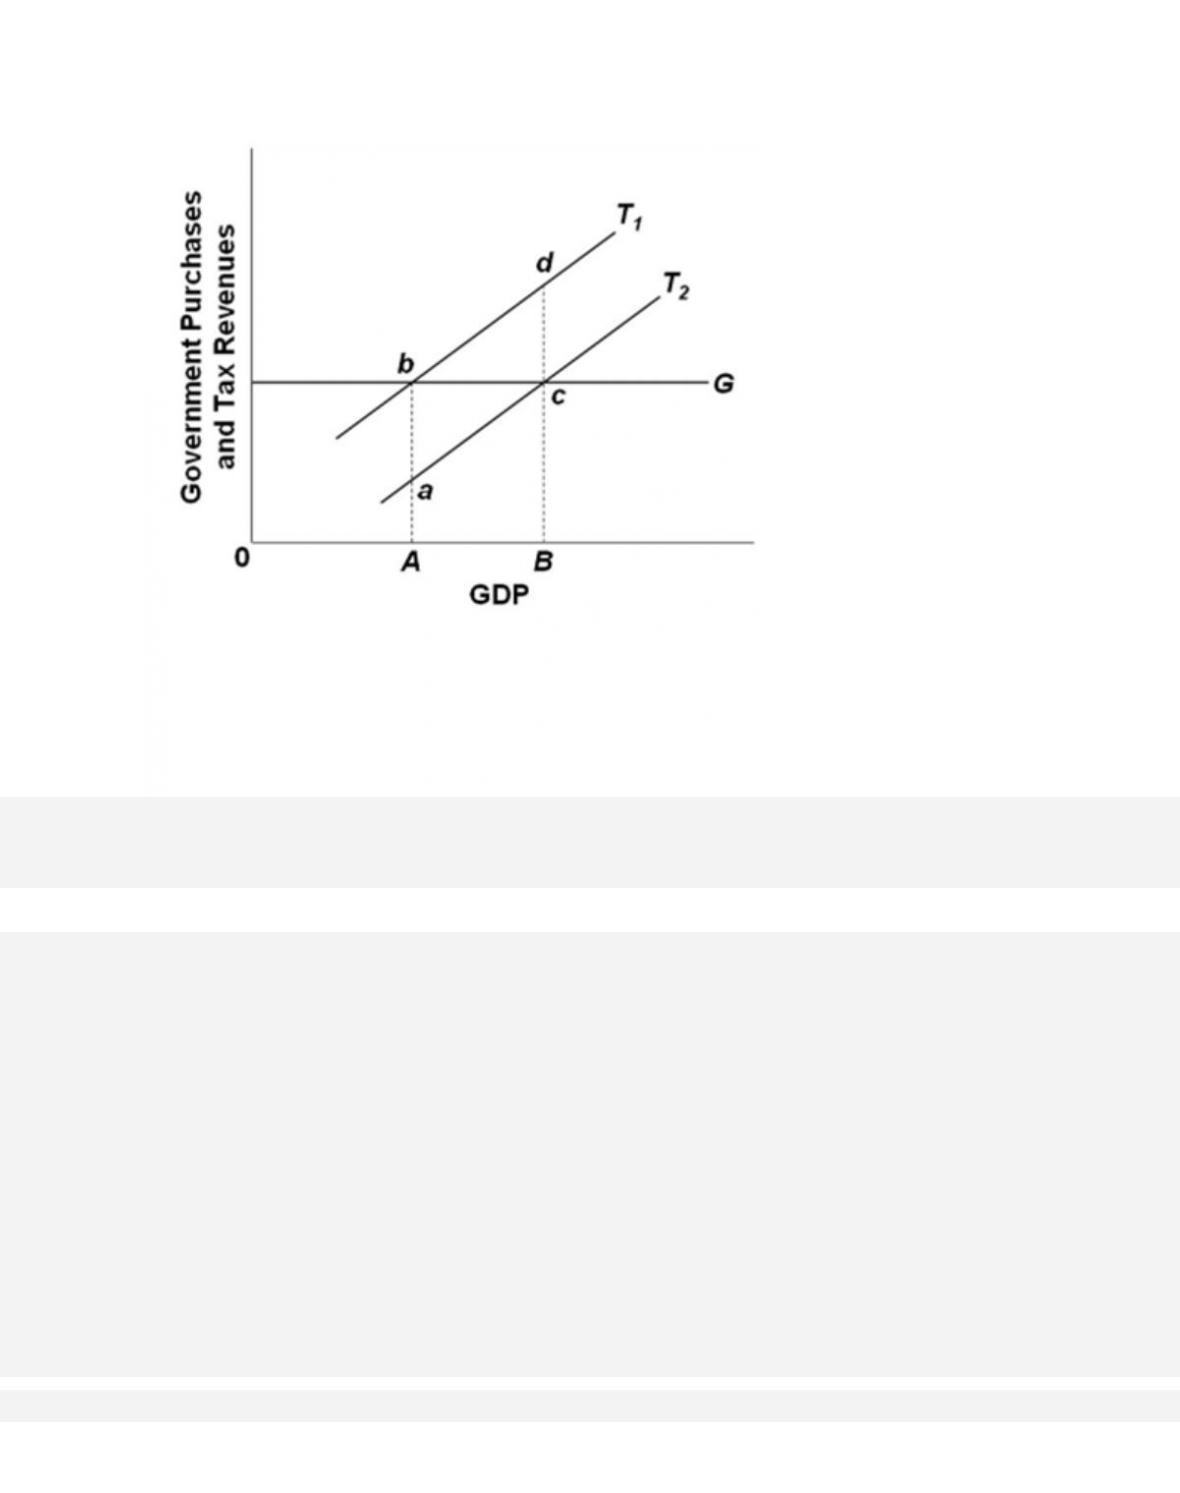
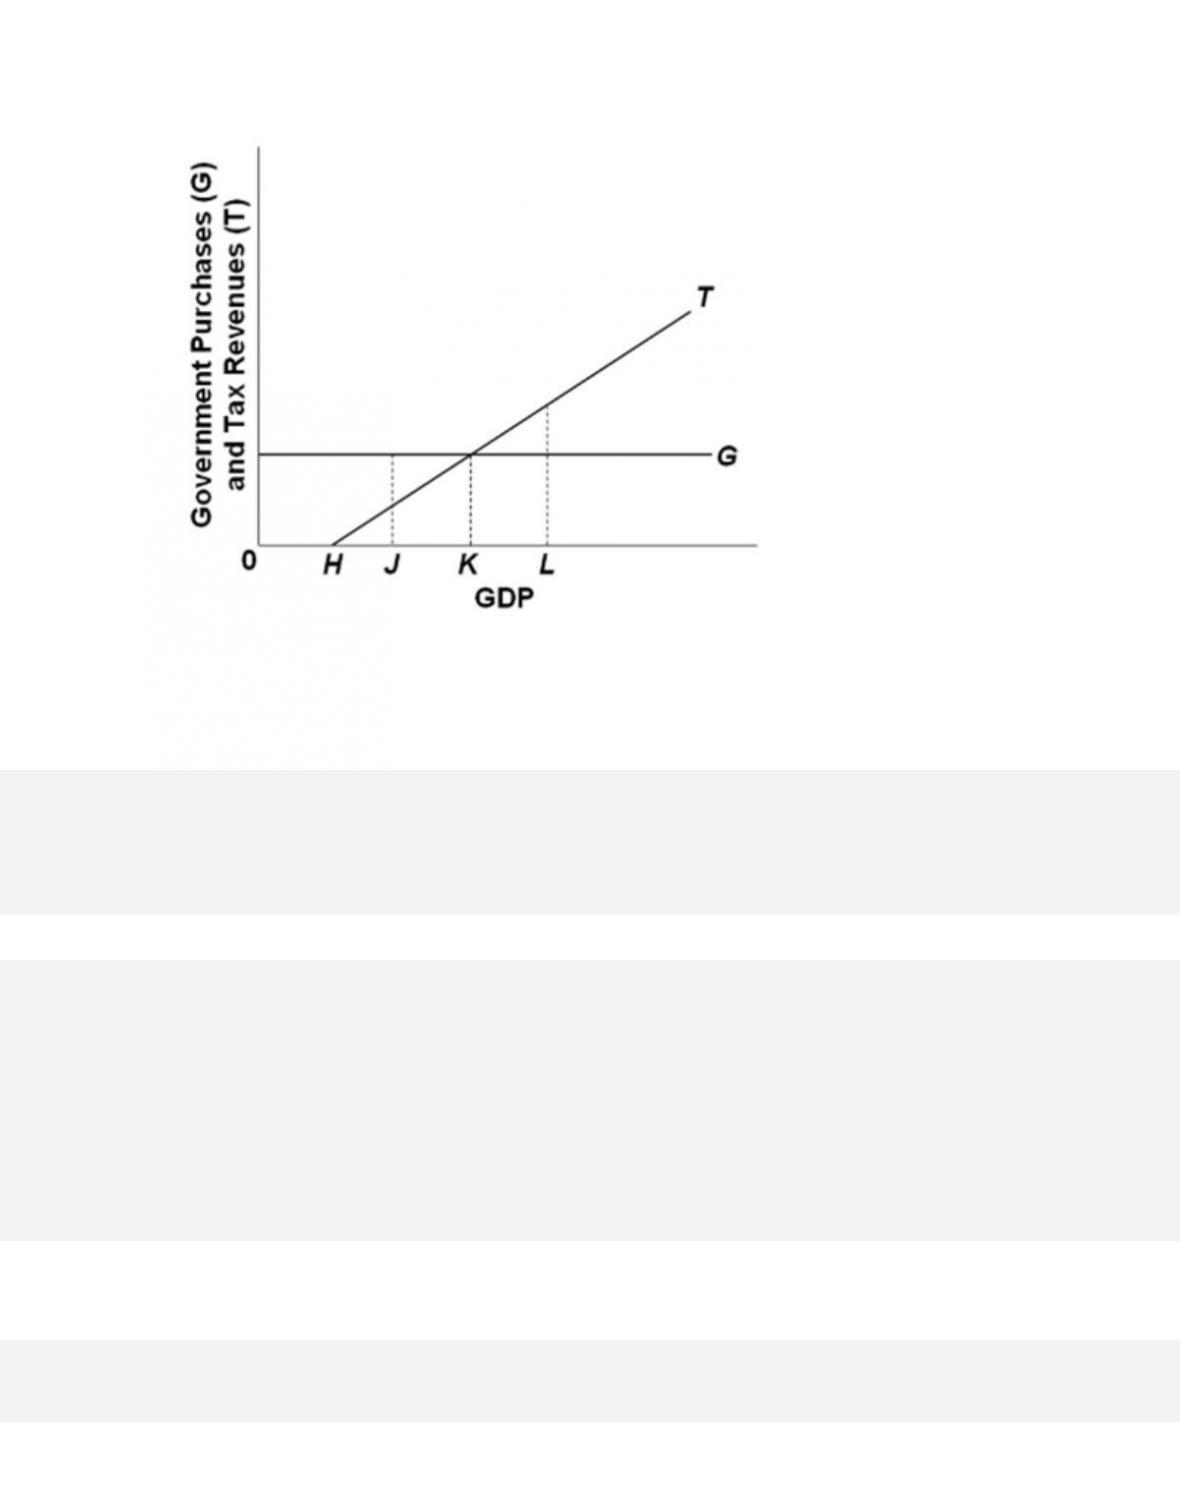
Refer to the diagram. Assume that G and T1 are the relevant curves and that the economy is
currently at B, which is its full-employment GDP. This economy has a
33–63
Copyright © 2018 McGraw-Hill Education. All rights reserved. No reproduction or distribution without the prior
written consent of McGraw-Hill Education.
Test Bank: I
Topic:
Evaluating How Expansionary or Contractionary Fiscal Policy Is Determined
Type: Graph
94.
Refer to the diagram. Assume that G and T1 are the relevant curves, the economy is currently at A,
and the full-employment GDP is B. This economy has a(n)
95.
Refer to the diagram. Assume that G and T1 are the relevant curves, the economy is currently at
A, and the full-employment GDP is B. This economy has
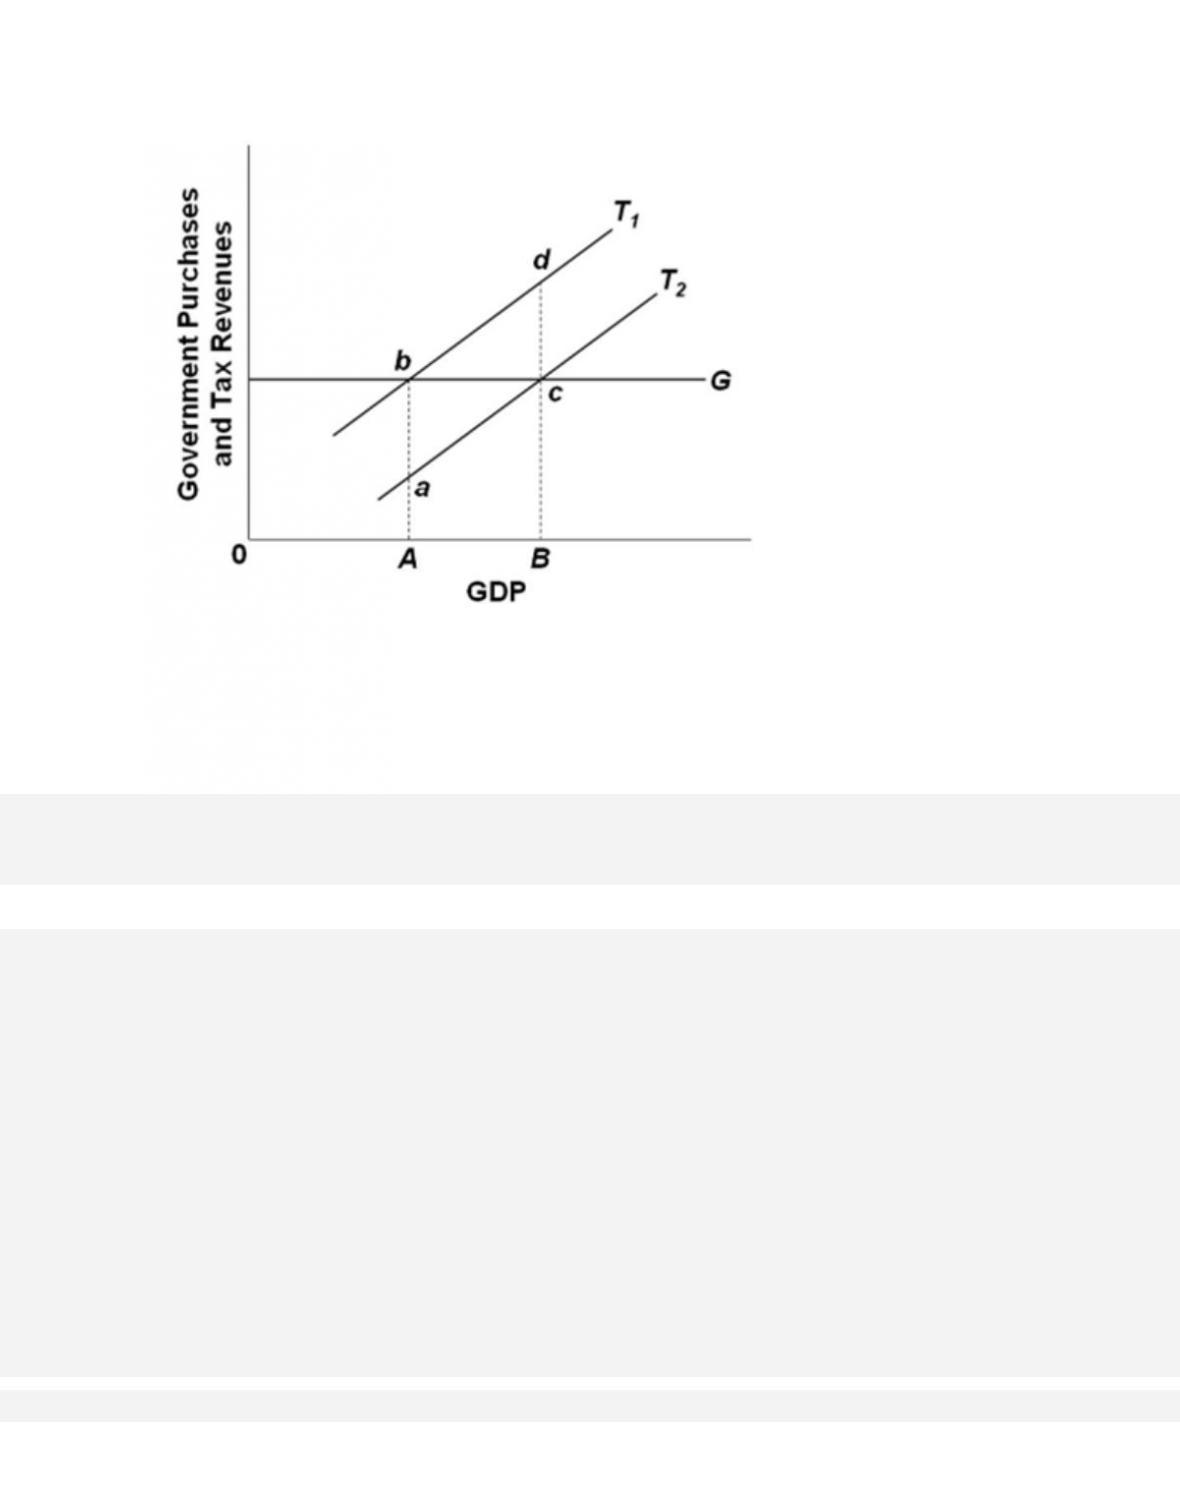
96.
Refer to the diagram. Assume that G and T2 are the relevant curves, the economy is currently at A,
and the full-employment GDP is B. This economy has a(n)
97.
Refer to the diagram. Assume that G and T1 are the relevant curves, the economy is currently at
B, and the full-employment GDP is A. This economy has a(n)
98.
Refer to the diagram. Discretionary fiscal policy designed to slow the economy is illustrated by

99.
Refer to the diagram. Discretionary fiscal policy designed to expand GDP is illustrated by
100.
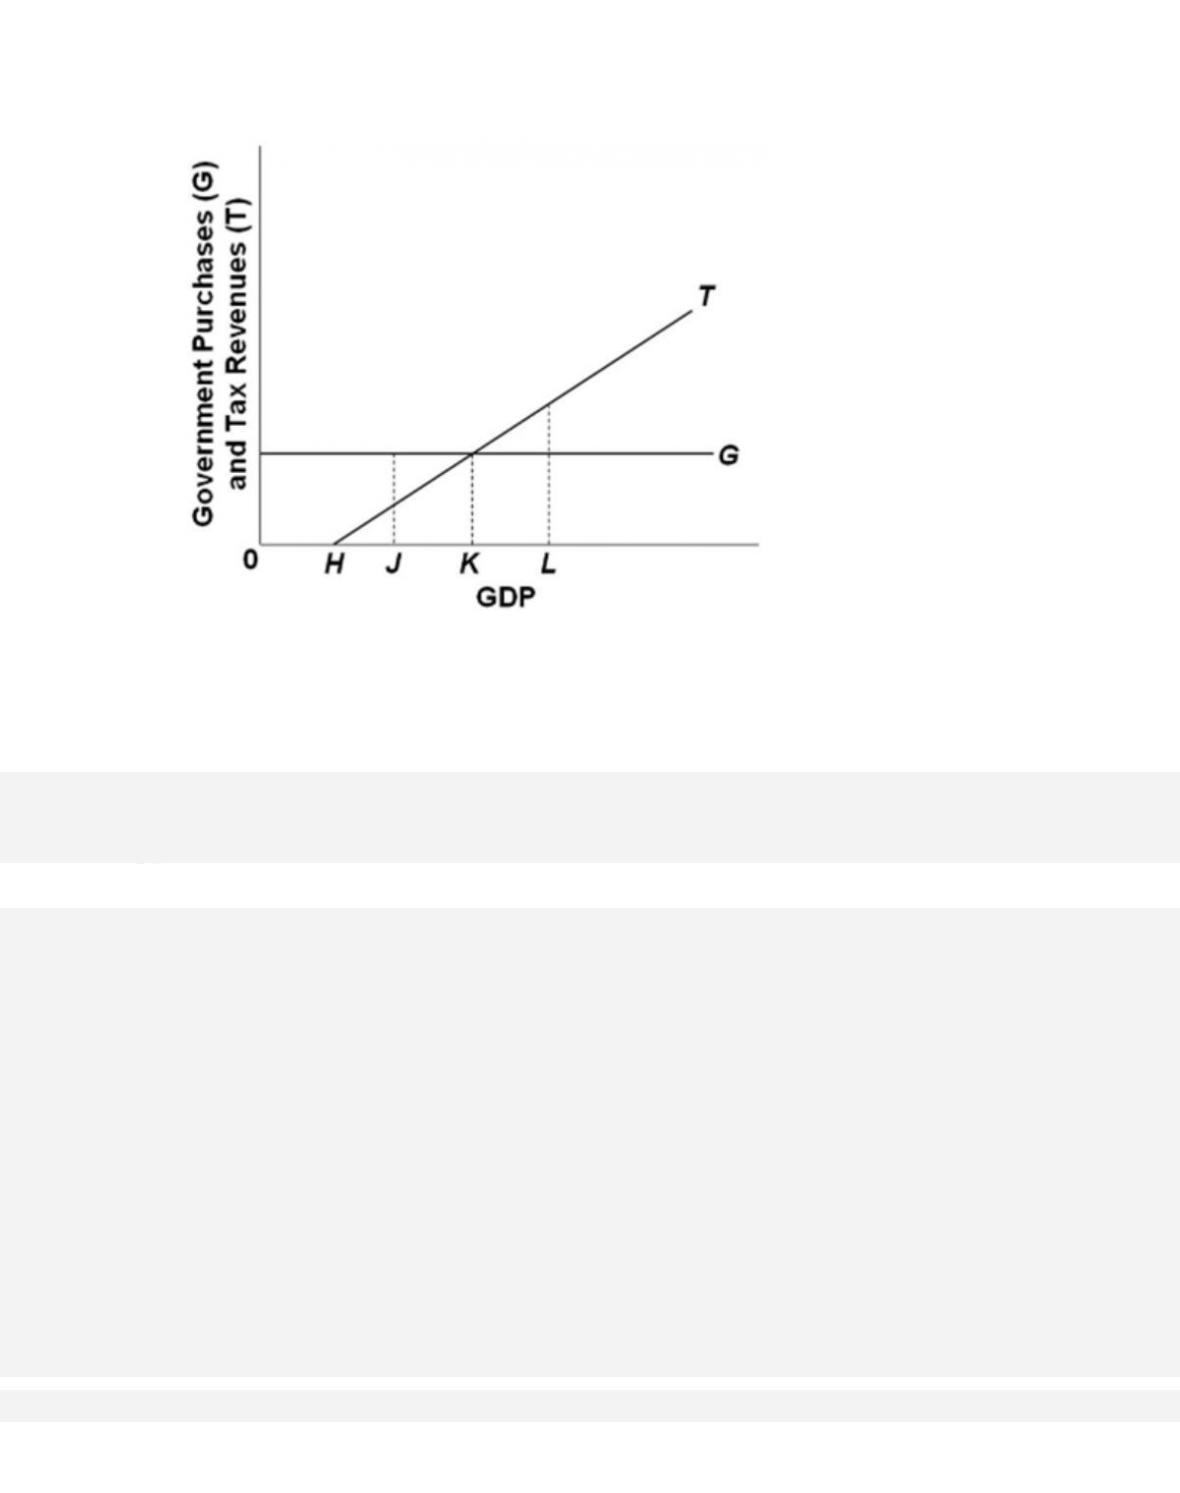
If the full-employment GDP for the economy is at L, then we can say with certainty that the

101.
With the expenditures programs and the tax system shown in the diagram,
102.
Refer to the diagram. The degree of built-in stability in the economy could be increased by
103. An effective expansionary fiscal policy will
33–72
Copyright © 2018 McGraw-Hill Education. All rights reserved. No reproduction or distribution without the prior
written consent of McGraw-Hill Education.
B.
reduce the cyclically adjusted deficit.
C. increase the cyclically adjusted deficit but reduce the actual deficit.
D. always result in a balanced actual budget once full employment is achieved.
104.
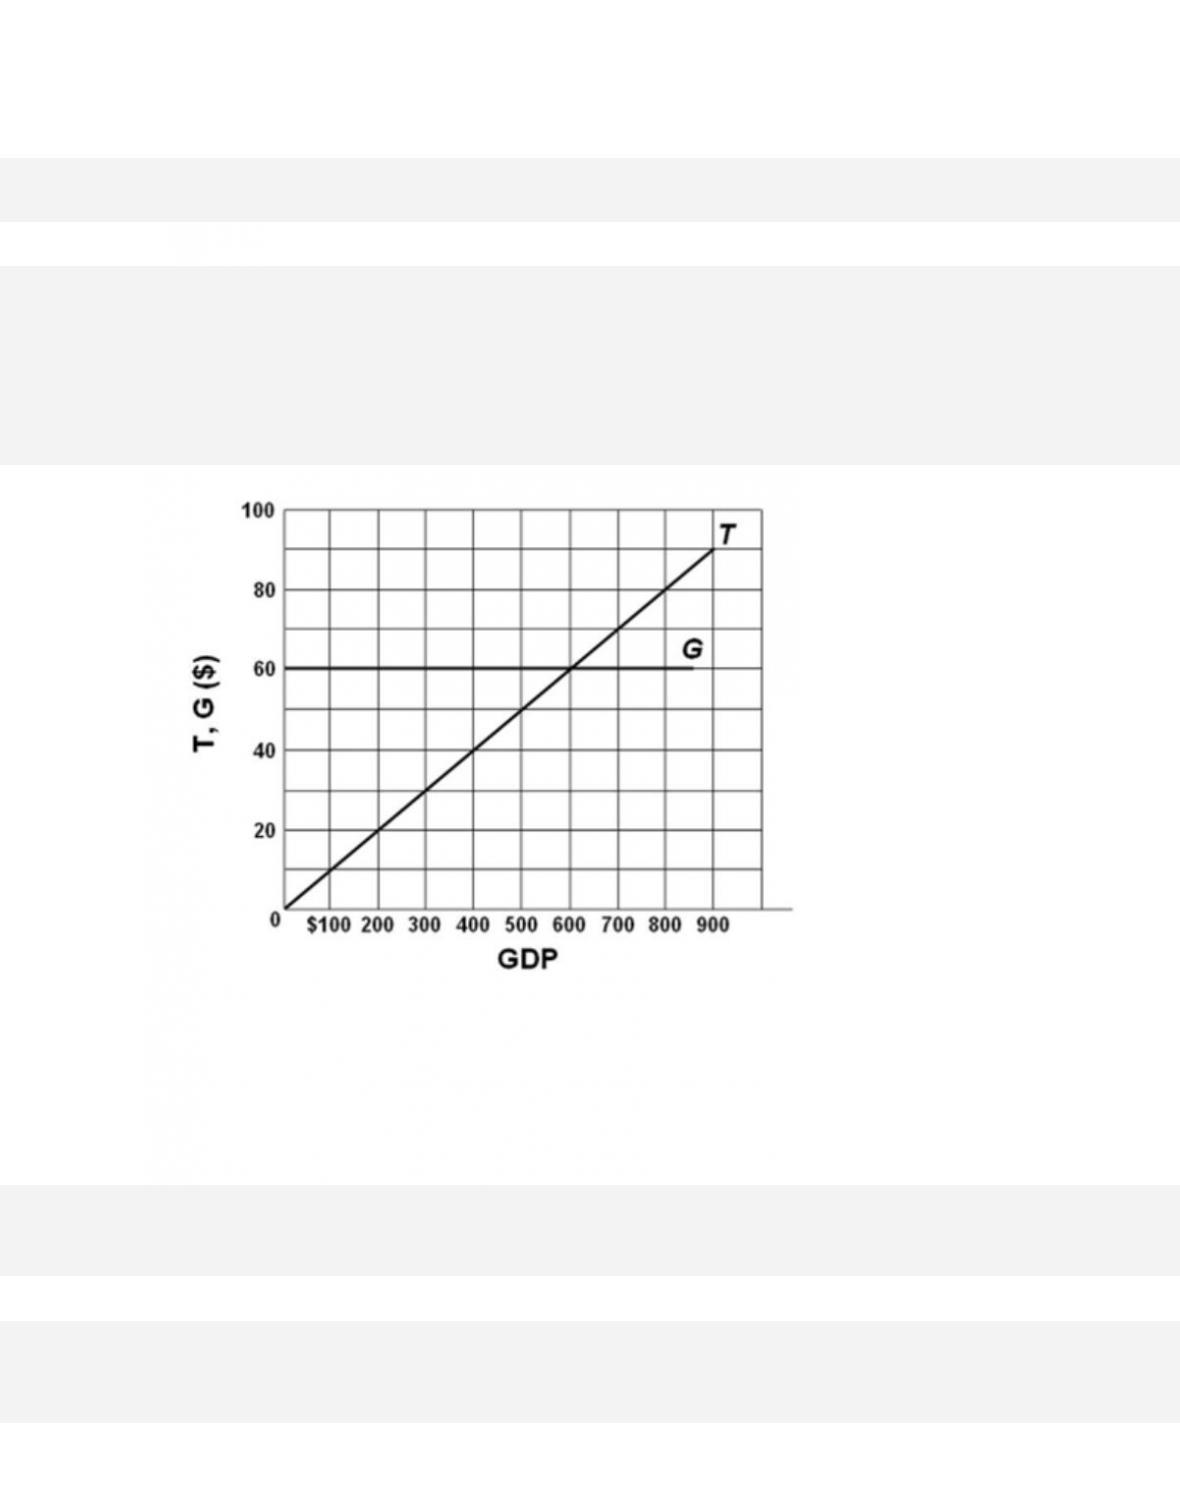
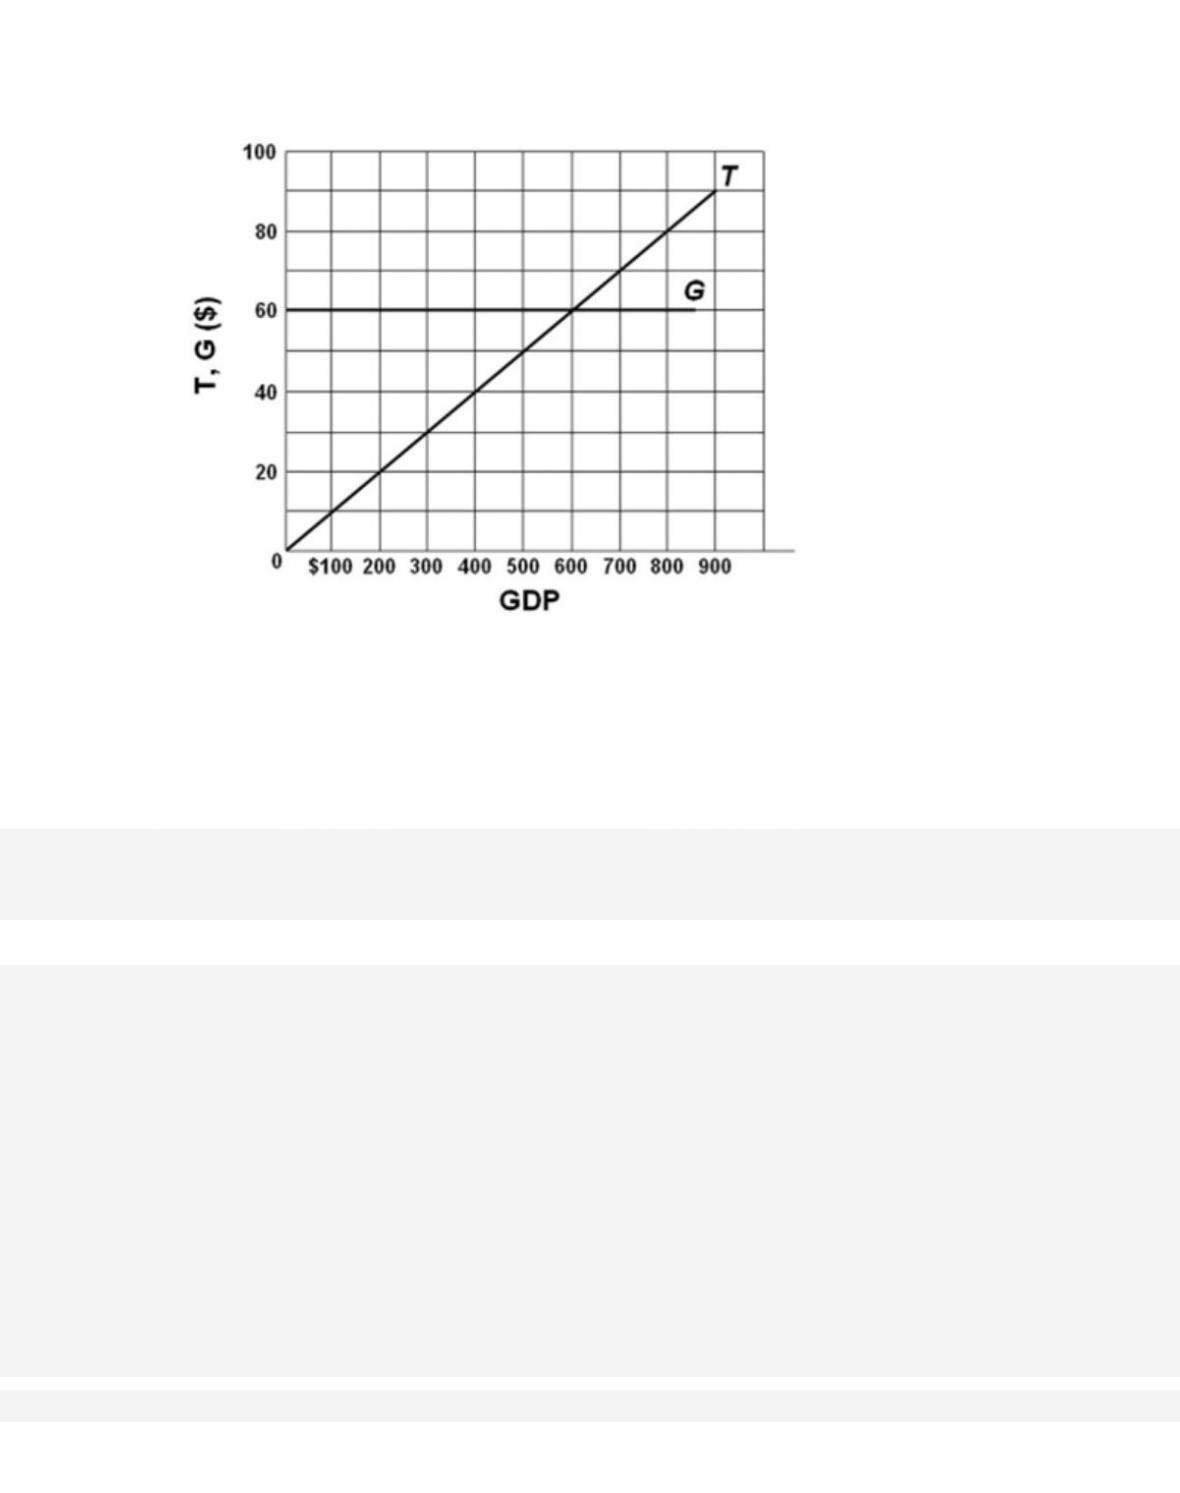
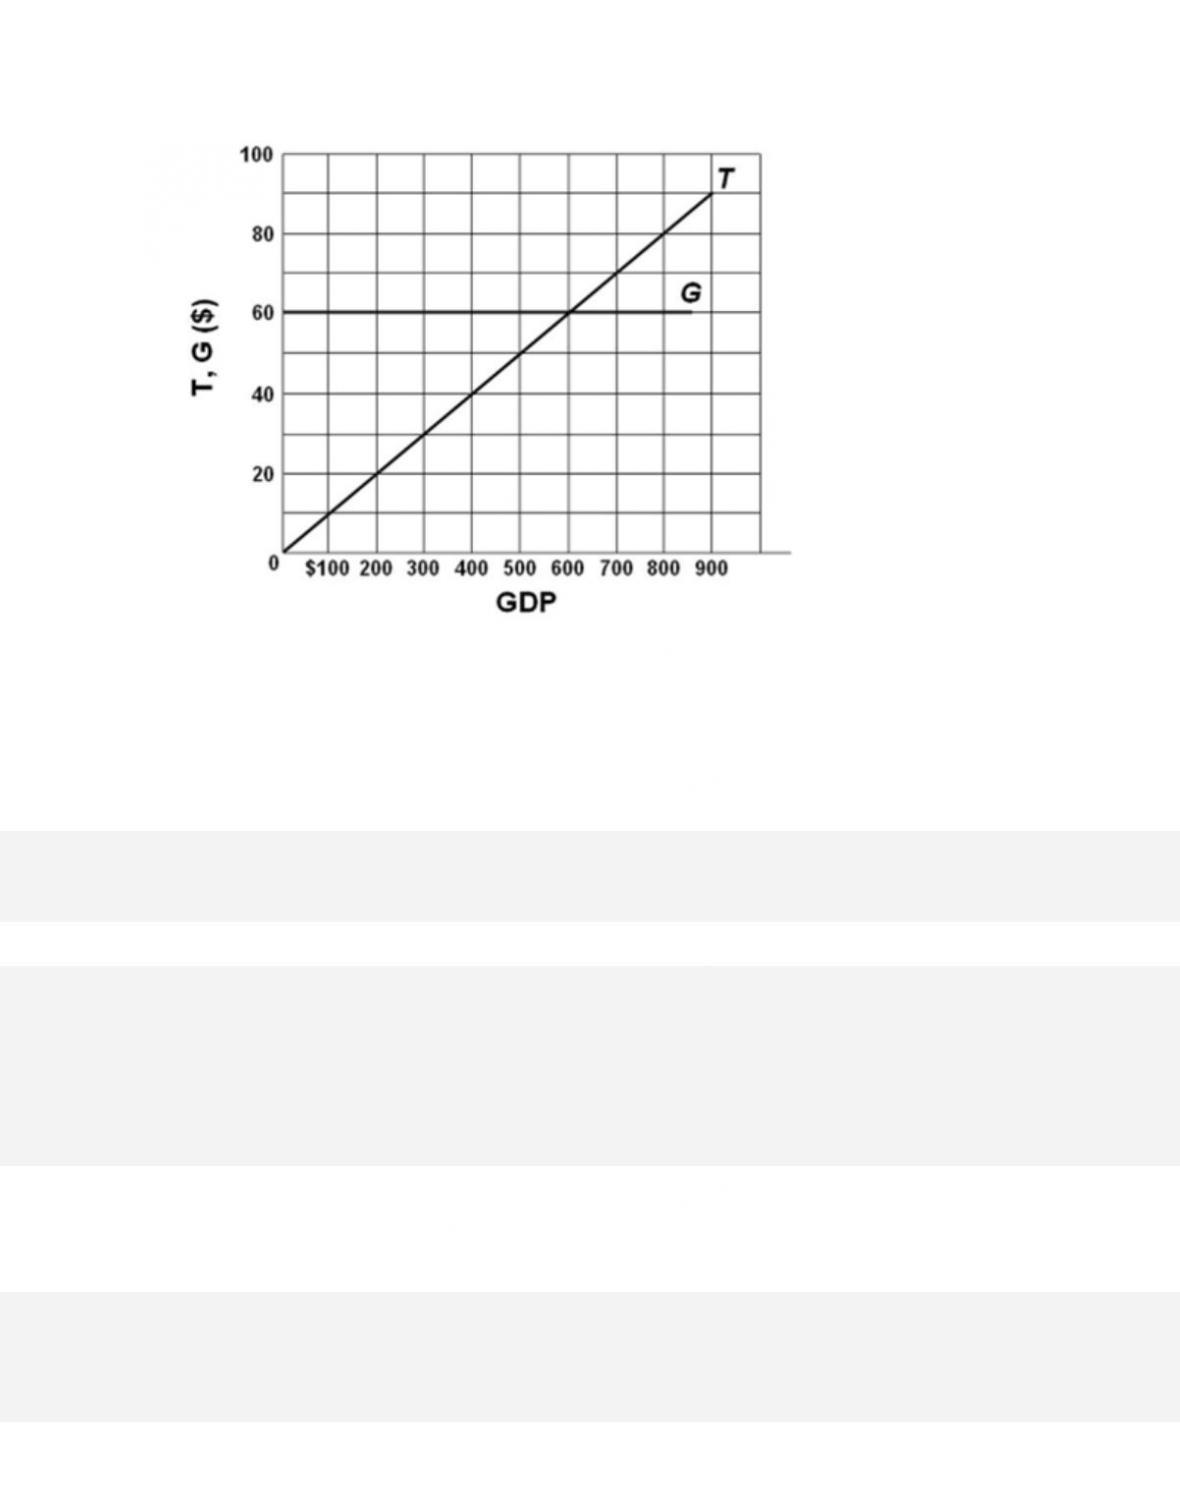
Refer to the diagram, where T is tax revenues and G is government expenditures. All figures are
in billions of dollars. If the full-employment GDP is $400 billion,
while the actual GDP is $200
billion, the actual budget deficit is
33–73
Copyright © 2018 McGraw-Hill Education. All rights reserved. No reproduction or distribution without the prior
written consent of McGraw-Hill Education.
Blooms: Understand
Diff i cult y :
02 Medium
Learning Objective: 33-03 Describe how the cyclically adjusted budget reveals the status
of U.S. fiscal policy.
Test Bank: I
Topic:
Evaluating How Expansionary or Contractionary Fiscal Policy Is Determined
Type: Graph
105.
Refer to the diagram, where T is tax revenues and G is government expenditures. All figures are
in billions of dollars. If the full-employment GDP is $400 billion,
while the actual GDP is $200
billion, the cyclically adjusted budget deficit is
33–74
Copyright © 2018 McGraw-Hill Education. All rights reserved. No reproduction or distribution without the prior
written consent of McGraw-Hill Education.
Topic:
Evaluating How Expansionary or Contractionary Fiscal Policy Is Determined
Type: Graph
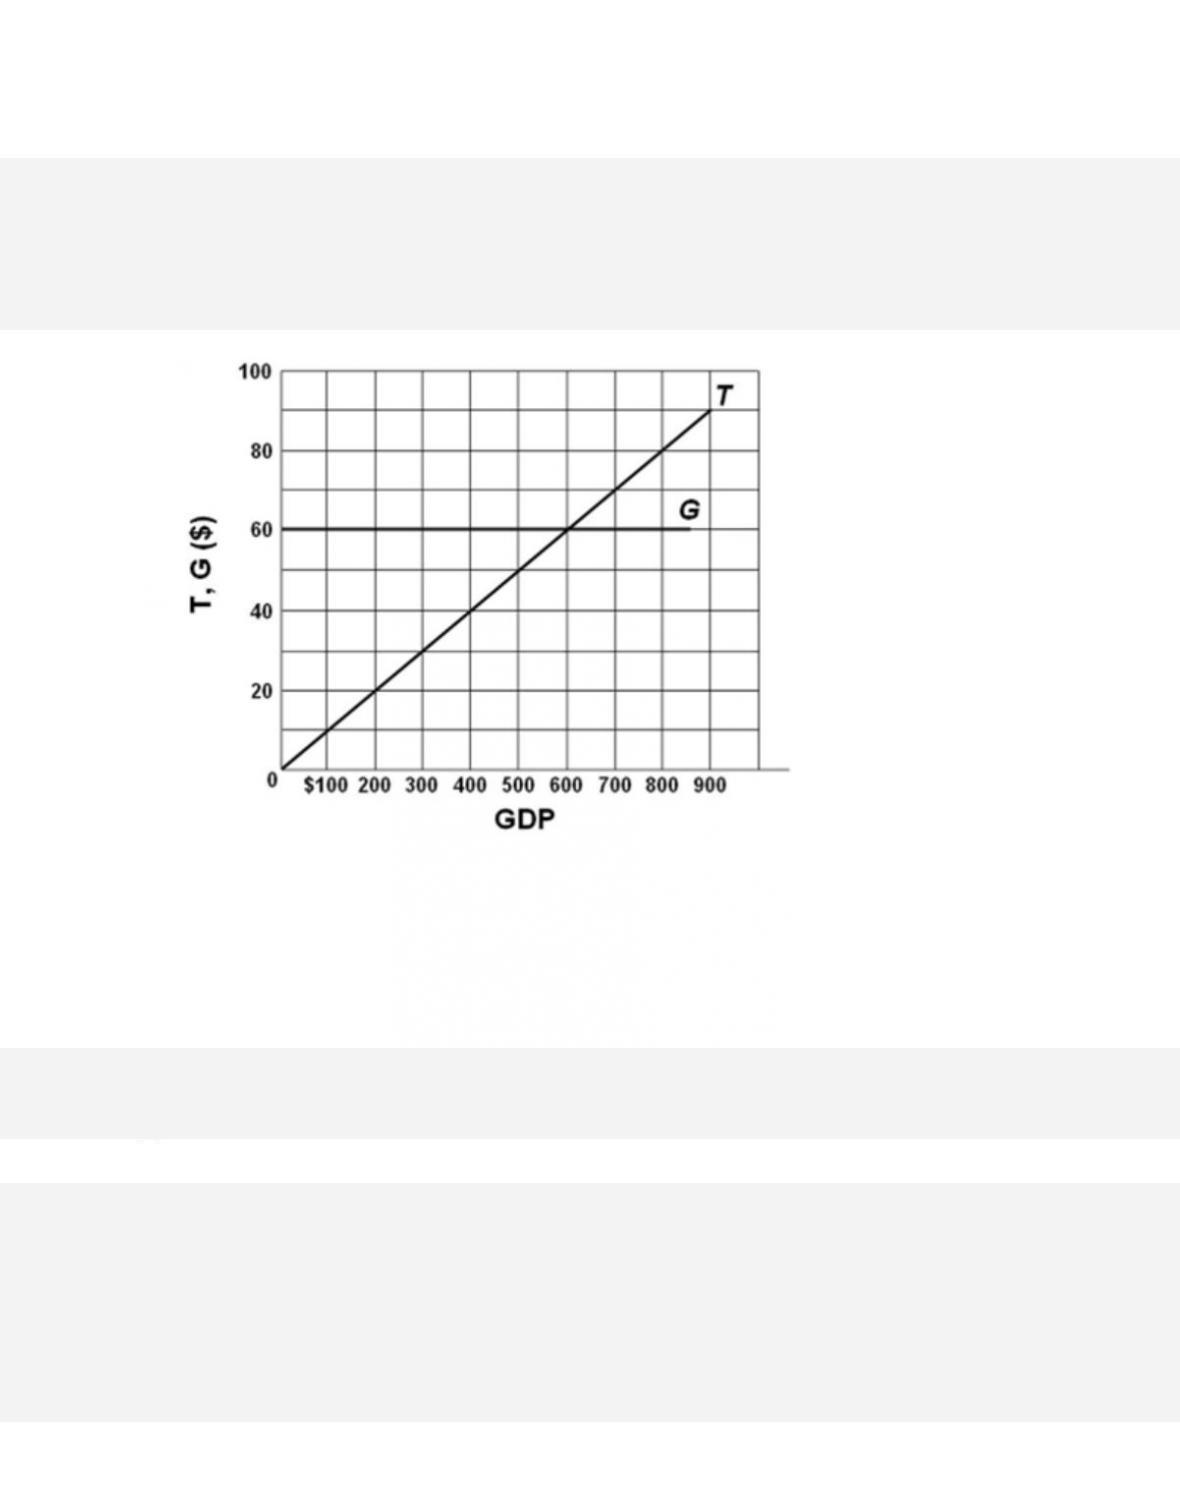
106.
Refer to the diagram, where T is tax revenues and G is government expenditures. All figures are
in billions of dollars. If the full-employment GDP is $400 billion,
while the actual GDP is $300
billion, the cyclical deficit is

107.
Refer to the diagram, where T is tax revenues and G is government expenditures. All figures are
in billions of dollars. If the full-employment GDP is $400 billion,
while the actual GDP is $200
billion, the
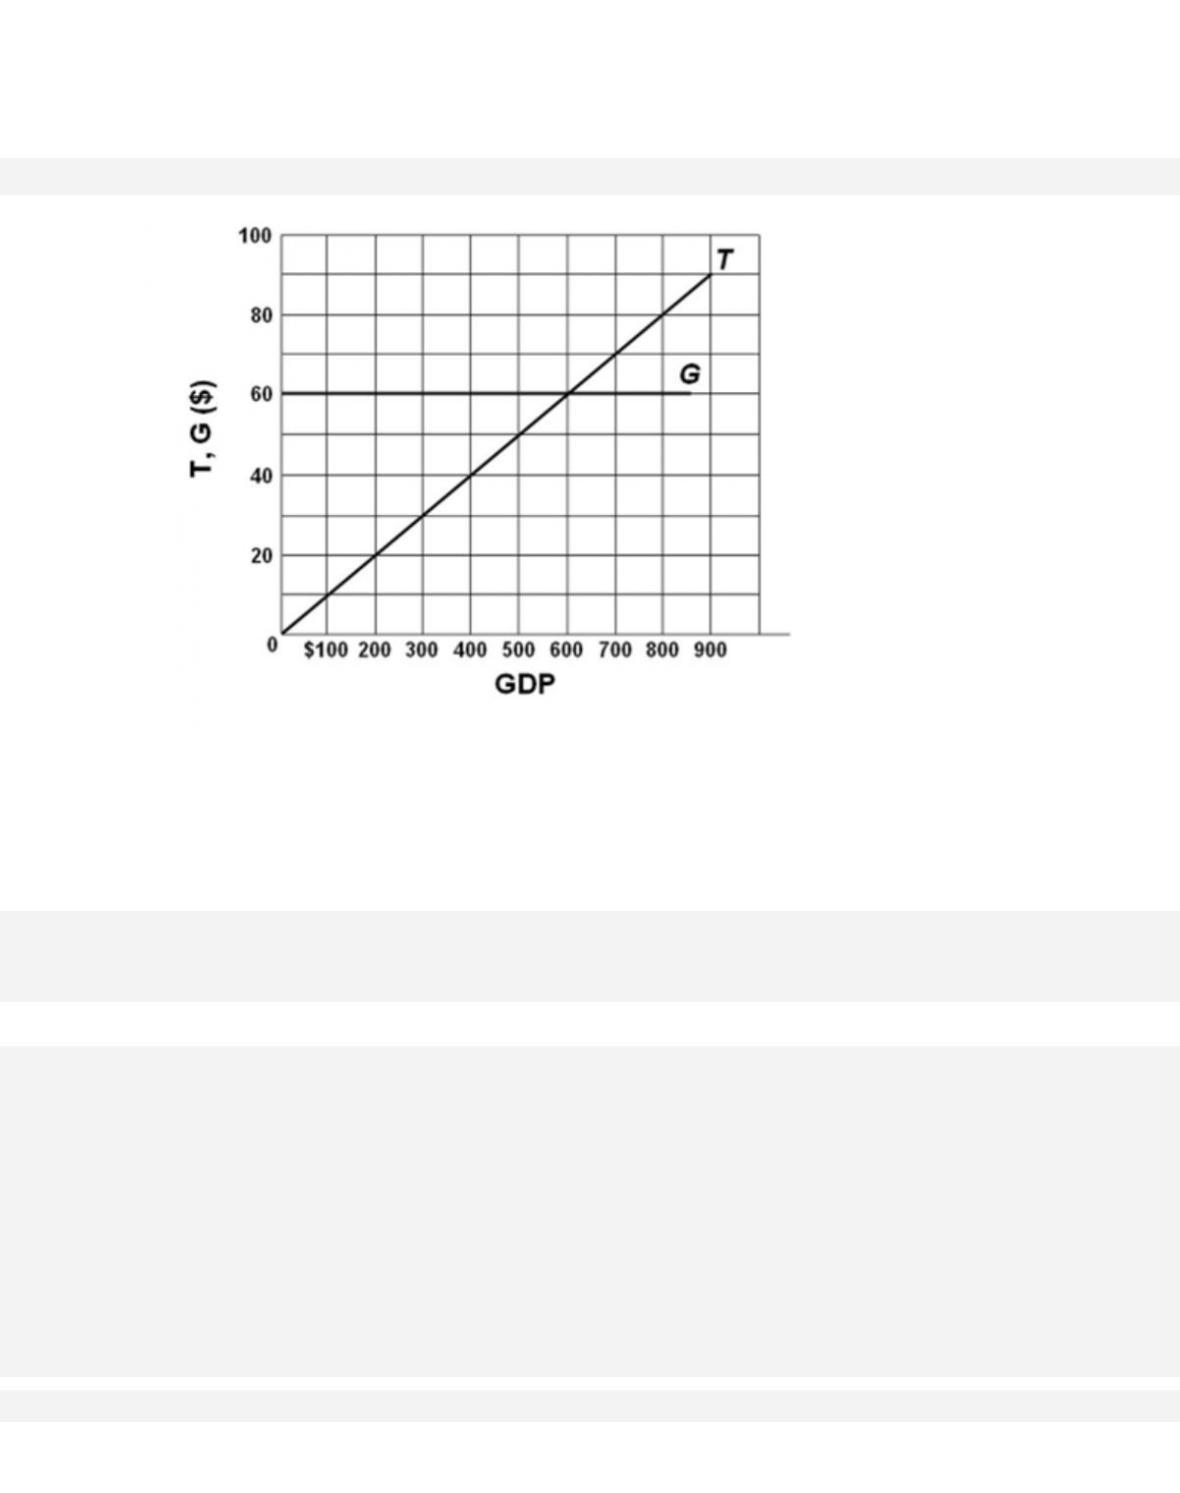
108.
Refer to the diagram, where T is tax revenues and G is government expenditures. All figures are
in billions of dollars. If the full-employment GDP and actual GDP
are each $400 billion, this
economy will realize a
109.
Refer to the diagram, where T is tax revenues and G is government expenditures. All figures are
in billions of dollars. If the full-employment and actual GDP are
each $400 billion, government
can balance its cyclically adjusted budget by
110.
Economists refer to a budget deficit that exists when the economy is achieving full
employment as a
33–78
Copyright © 2018 McGraw-Hill Education. All rights reserved. No reproduction or distribution without the prior
written consent of McGraw-Hill Education.
C.
natural deficit.
D.
nonrecurring deficit.
111.
When the economy is at full employment,
112.
If government increases the size of its cyclically adjusted surplus, we can
113.
The federal budget deficit is found by
114.
The amount by which government expenditures exceed revenues during a particular year is
the
115.
The amount by which federal tax revenues exceed federal government expenditures during a
particular year is the
33–80
116.
Since 2002, the United States has had
117.
Which of the following is a true statement?
118.
The immediate primary cause of the swing from federal budget surpluses in 2000 and 2001
to a budget deficit in 2002 was