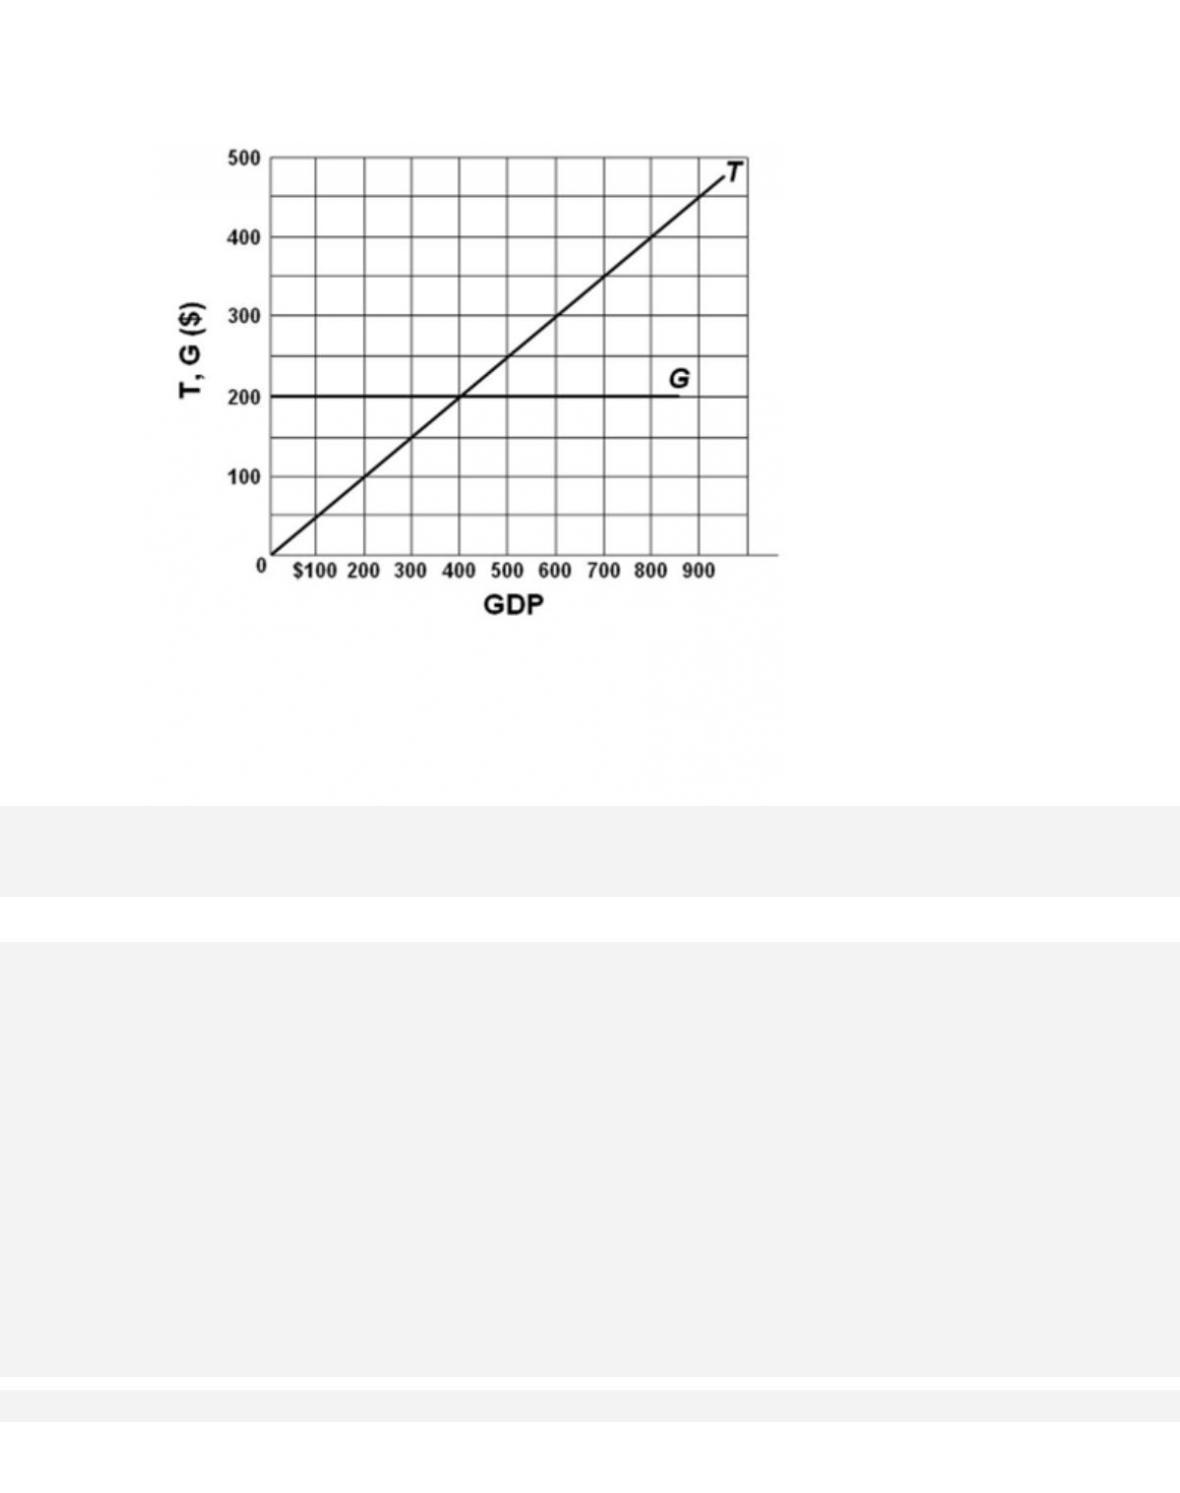
63.
Refer to the diagram, in which T is tax revenues and G is government expenditures. All figures
are in billions. In this economy,
64.
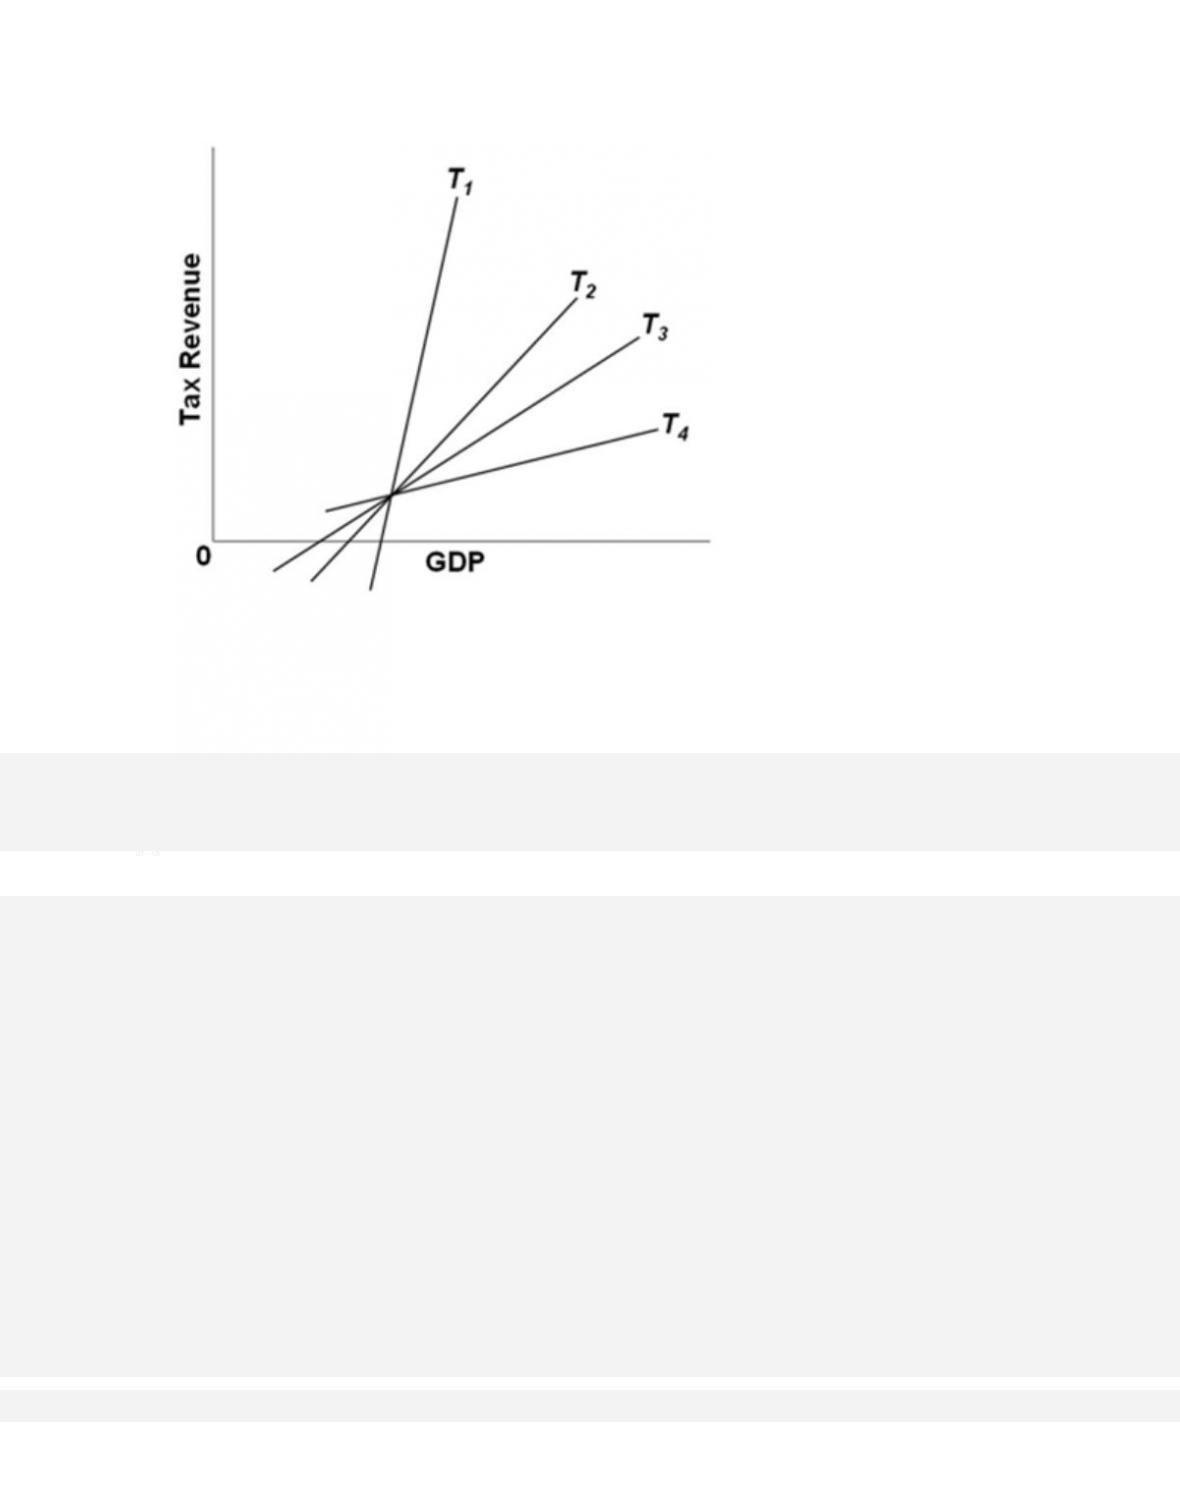
Refer to the diagram. Which tax system has the most built-in stability?

65.
Refer to the diagram. Which tax system has the least built-in stability?

66.
Refer to the diagram. Which tax system will generate the largest cyclical deficits?
67.
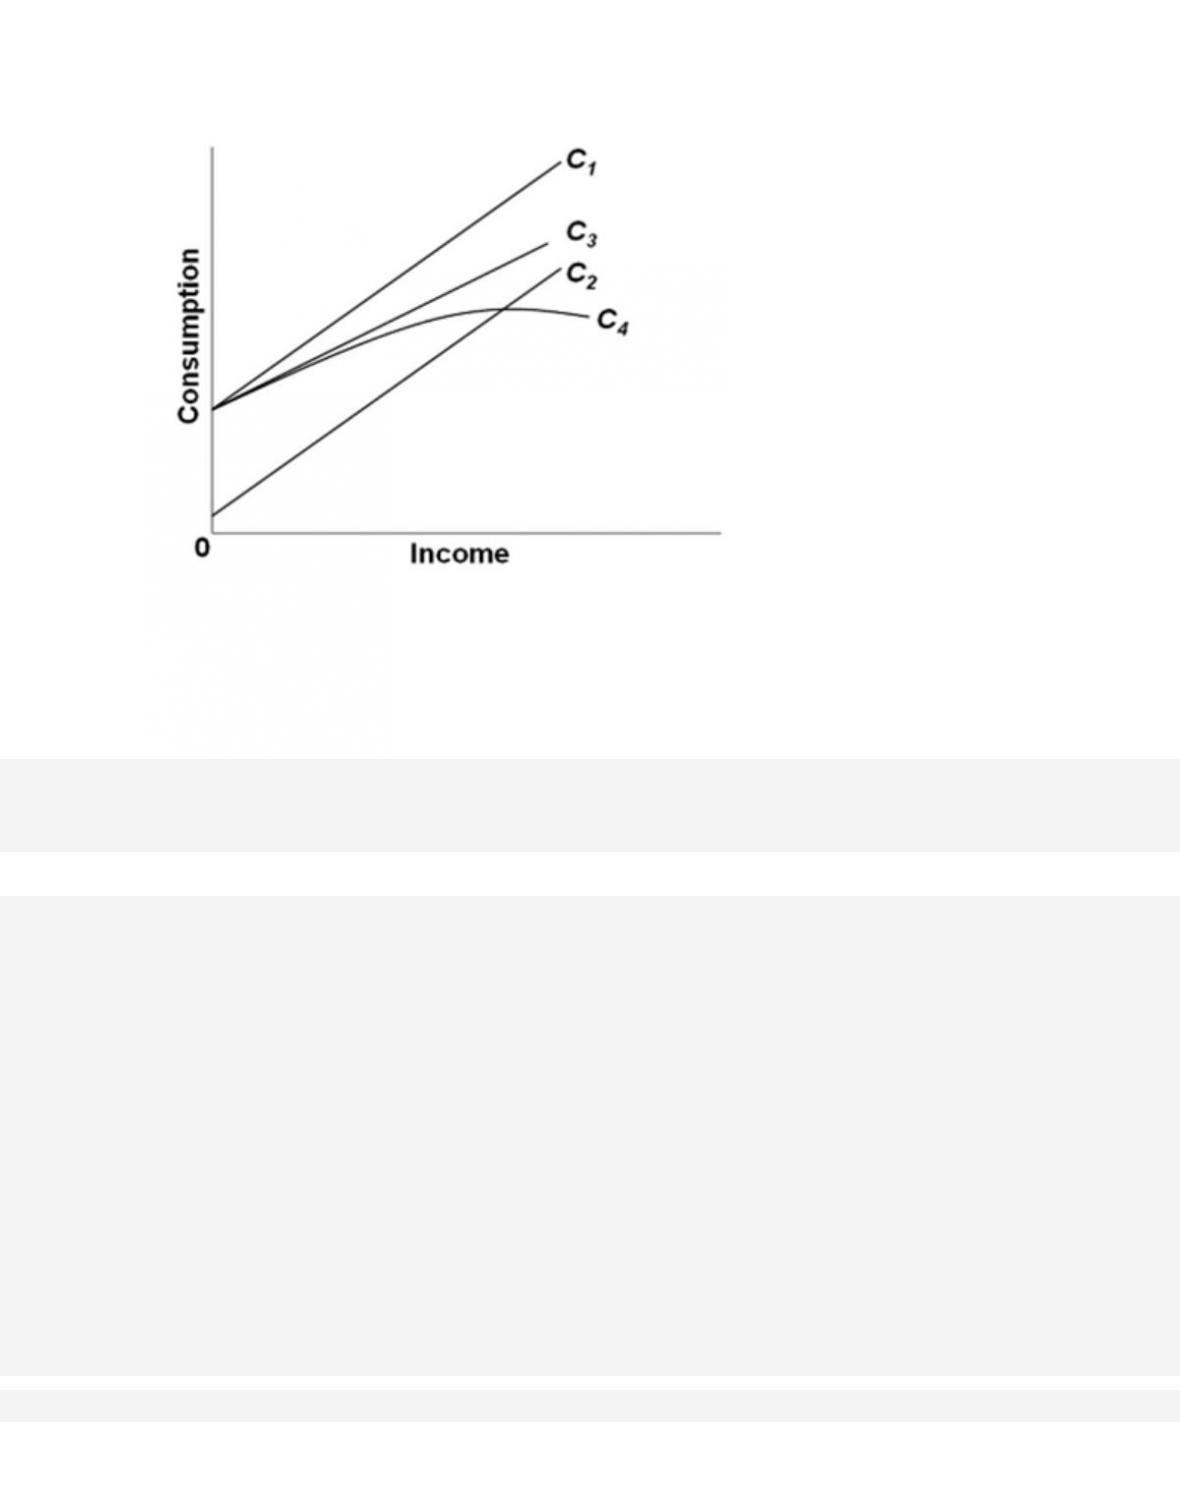
(Advanced analysis) Refer to the diagram, in which C3 is the before-tax consumption schedule.
The after-tax consumption schedule represented by C2 reflects

68.
(Advanced analysis) Refer to the diagram, in which C1 is the before-tax consumption schedule.
The consumption schedule represented by C3 reflects

69.
(Advanced analysis) Refer to the diagram, in which C1 is the before-tax consumption schedule.
The consumption schedule represented by C4 reflects
33–48
70.
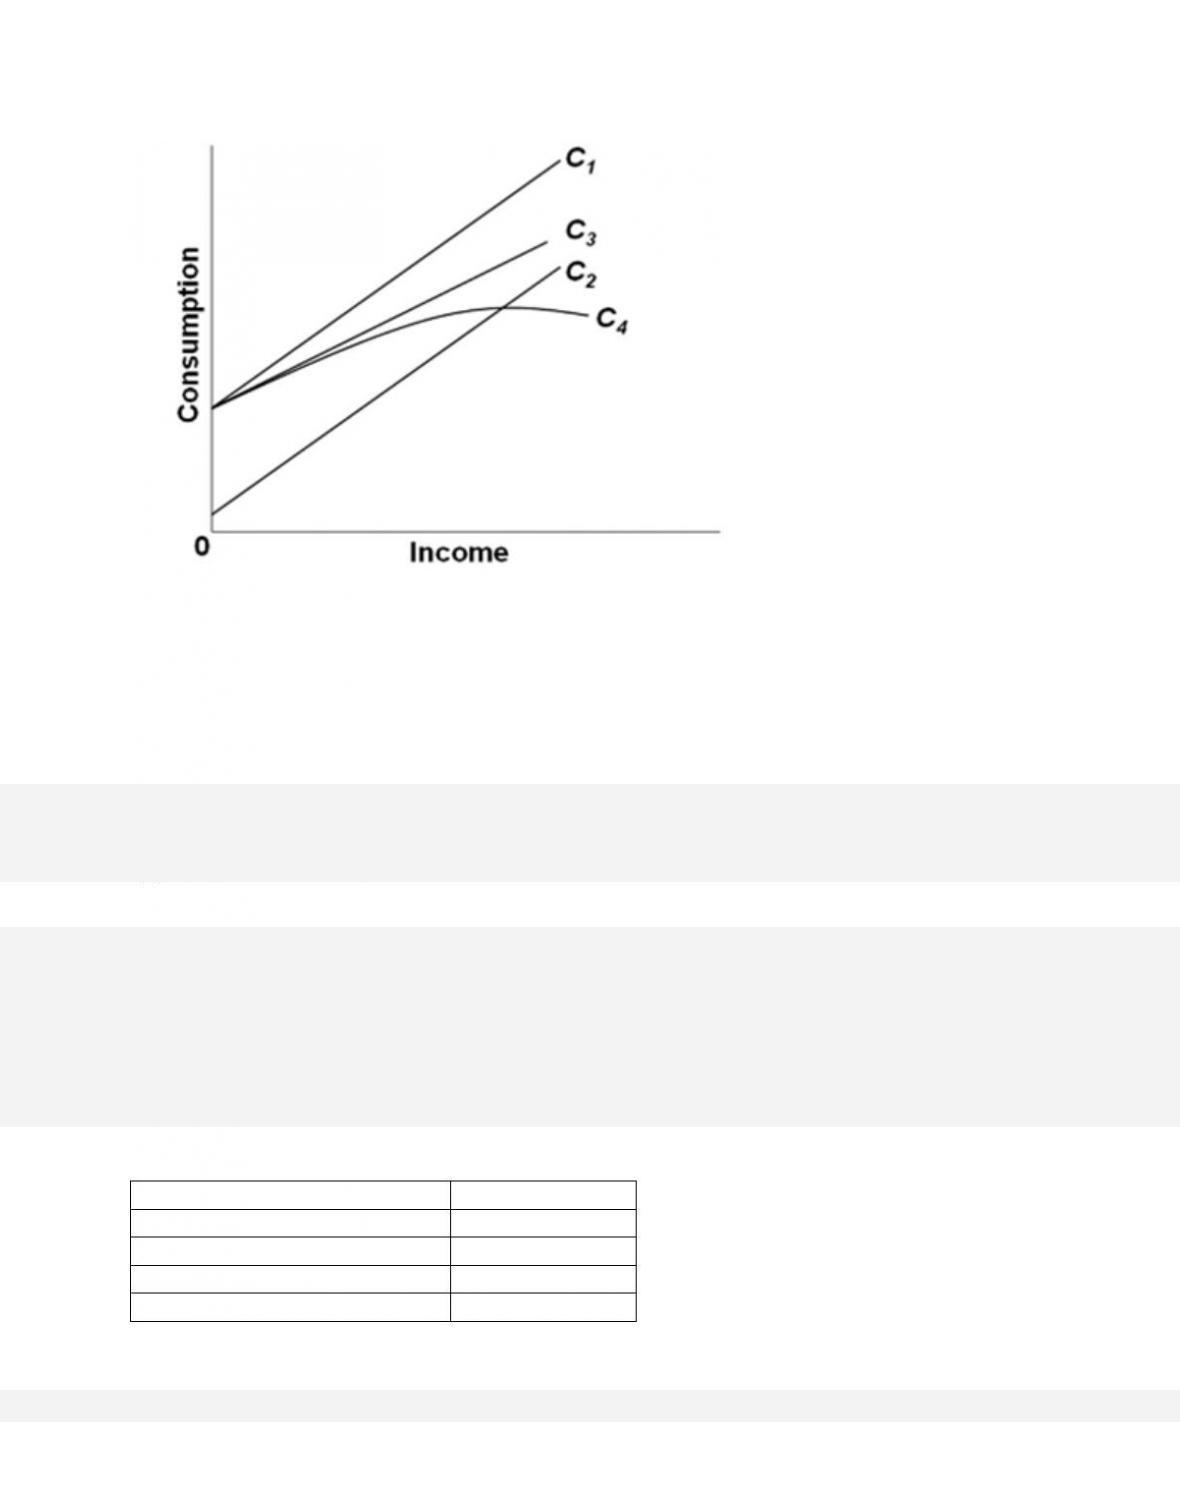
(Advanced analysis) Refer to the diagram, in which C1 is the before-tax consumption schedule.
Other things being equal, the economy would enjoy the greatest built-
in stability with
consumption schedule
71.
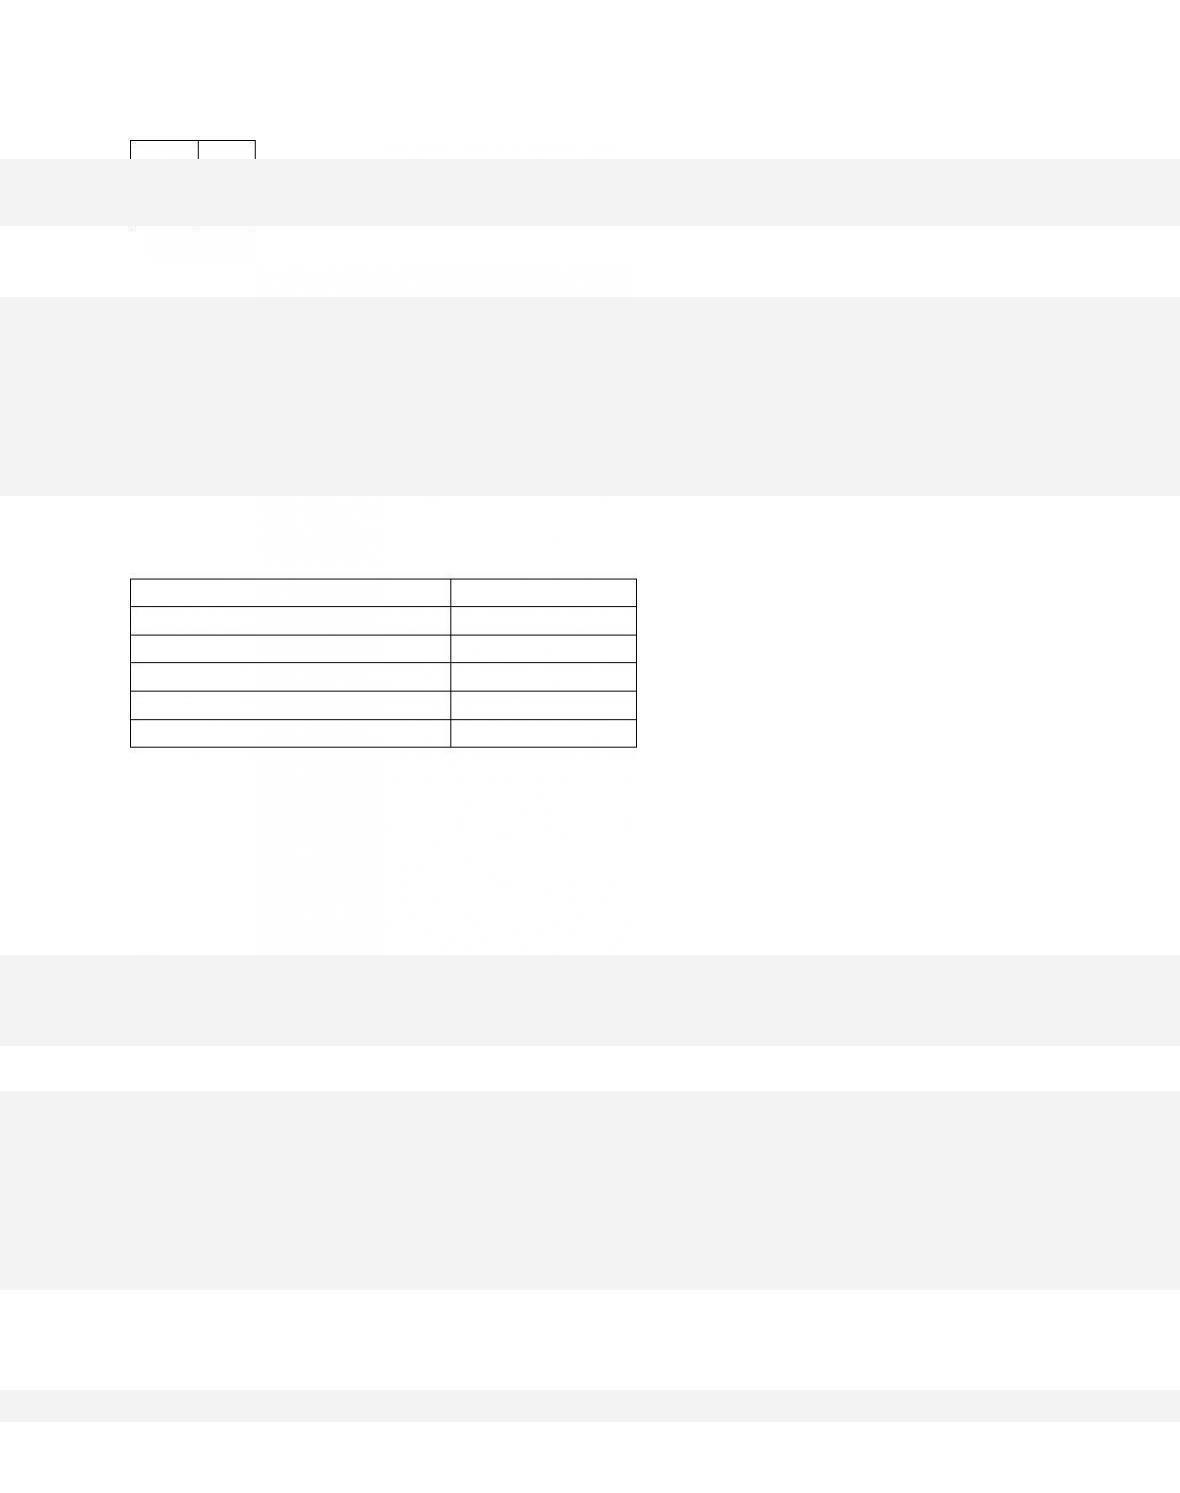
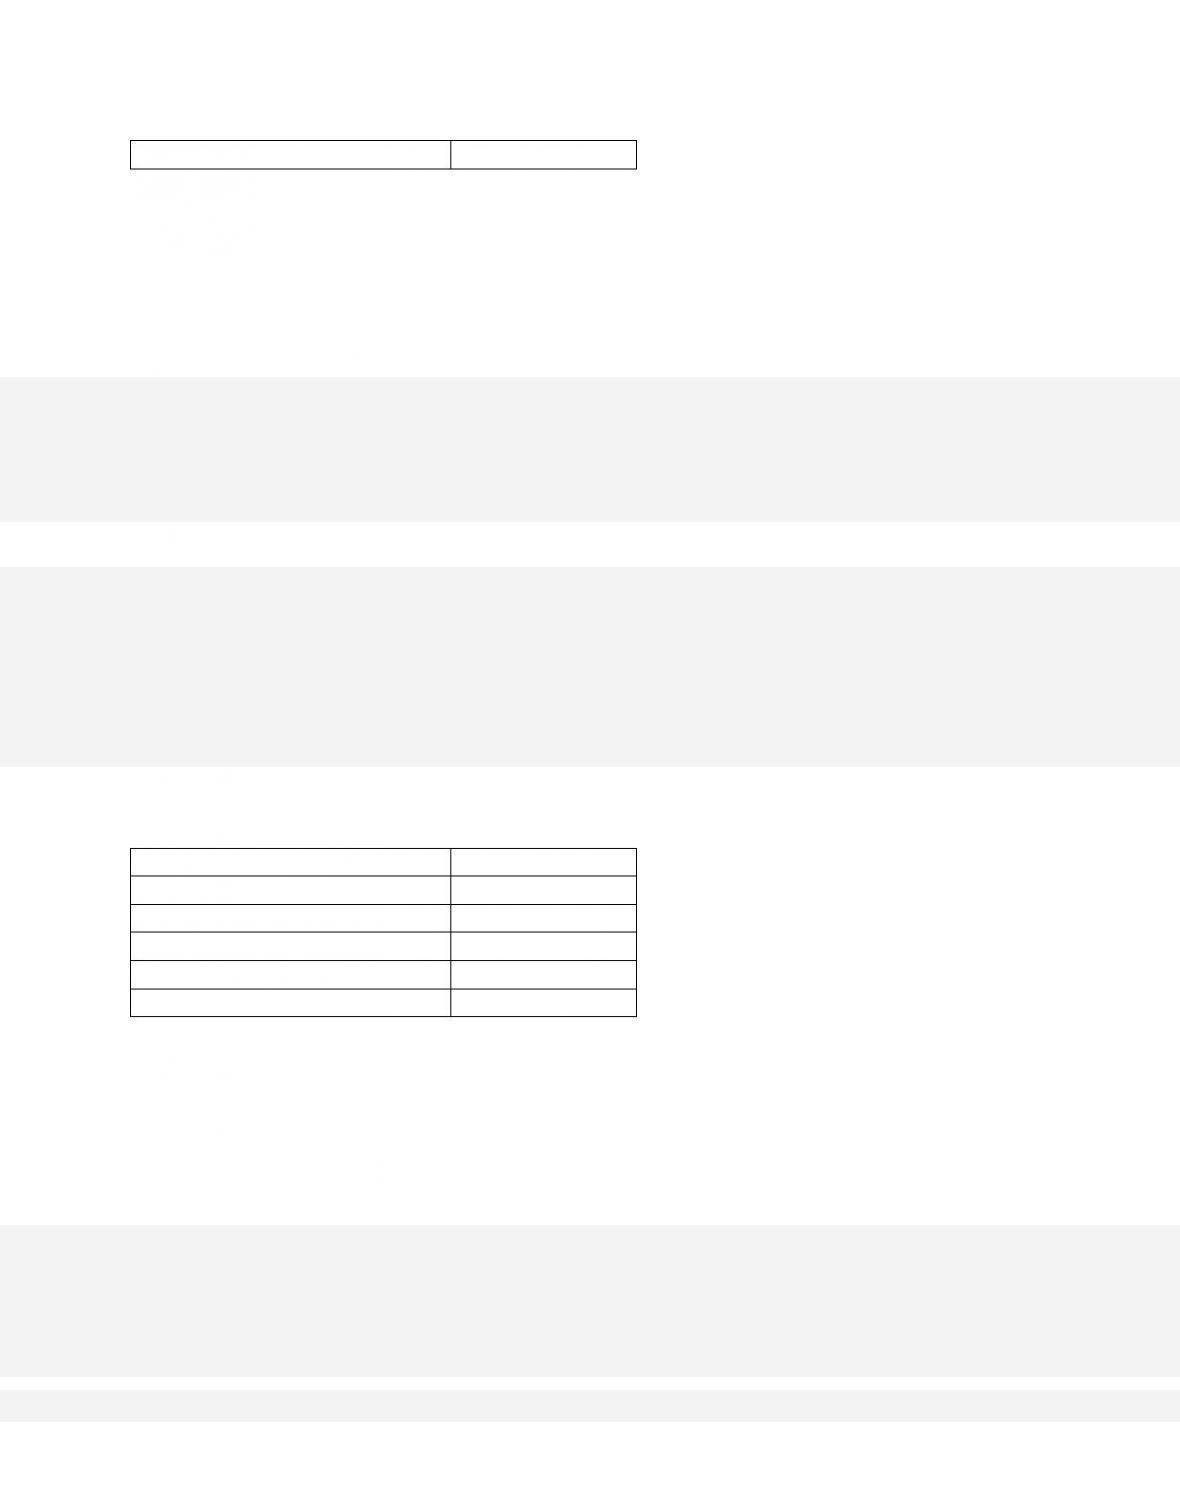
Gross Domestic Product (GDP)
Consumption (C)
$0
$40
100
120
200
200
300
280

400
360
The accompanying table is the before-tax consumption schedule for a closed economy. If a lump–
sum tax (the same tax amount at each level of GDP) of $40 is now
imposed in this economy, the
consumption schedule will be
33–50
200
120
300
180
400
240
72.
Gross Domestic Product (GDP)
Consumption (C)
$0
$40
100
120
200
200
300
280
400
360
The accompanying table is the before-tax consumption schedule for a closed economy. If a lump–
sum tax (the same tax amount at each level of GDP) of $40 is
imposed in this economy, the tax
system
73.
33–51
Gross Domestic Product (GDP)
Consumption (C)
$0
$40
100
120
200
200
300
280
400
360
The accompanying table is the before-tax consumption schedule for a closed economy. If a lump–
sum tax (the same tax amount at each level of GDP) of $40 is
imposed in this economy, the
marginal propensity to consume is
74.
Gross Domestic Product (GDP)
Consumption (C)
$0
$40
100
120
200
200
300
280
400
360
The accompanying table is the before-tax consumption schedule for a closed economy. If a lump–
sum tax (the same tax amount at each level of GDP) of $40 is
imposed in this economy, we can
conclude that the tax
75.
Gross Domestic Product (GDP)
Consumption (C)
$100
$140
200
200
300
260
400
320
500
380
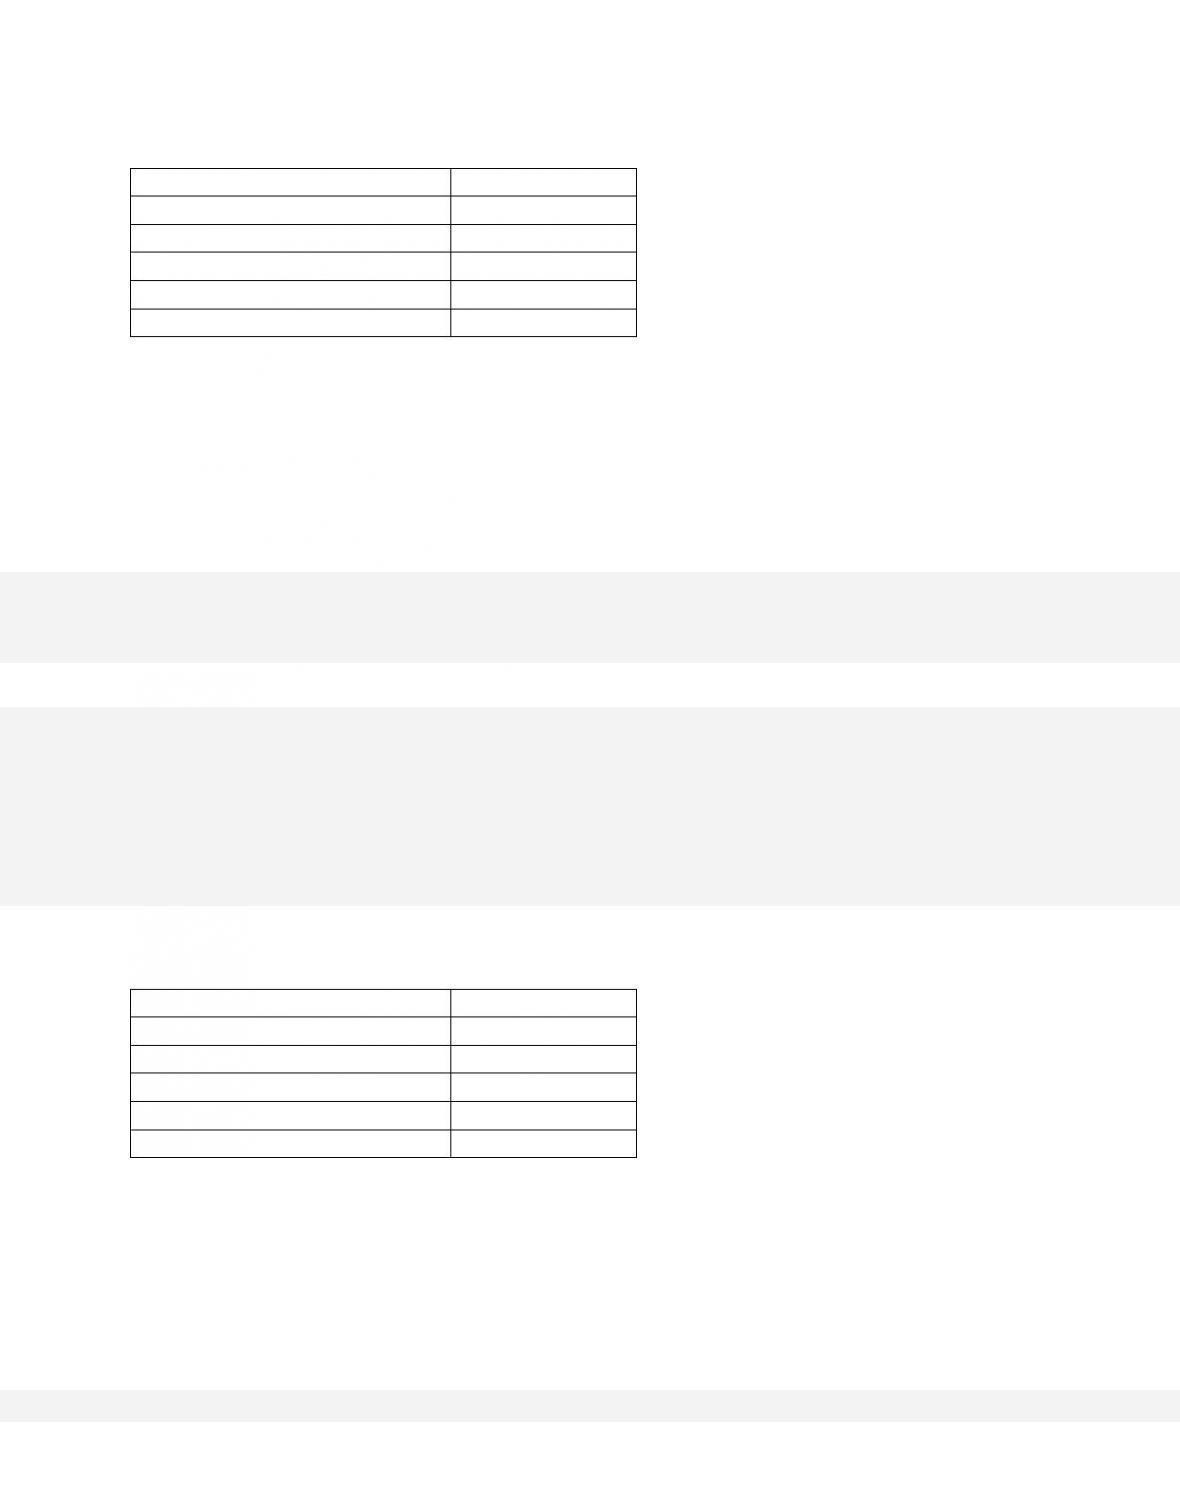
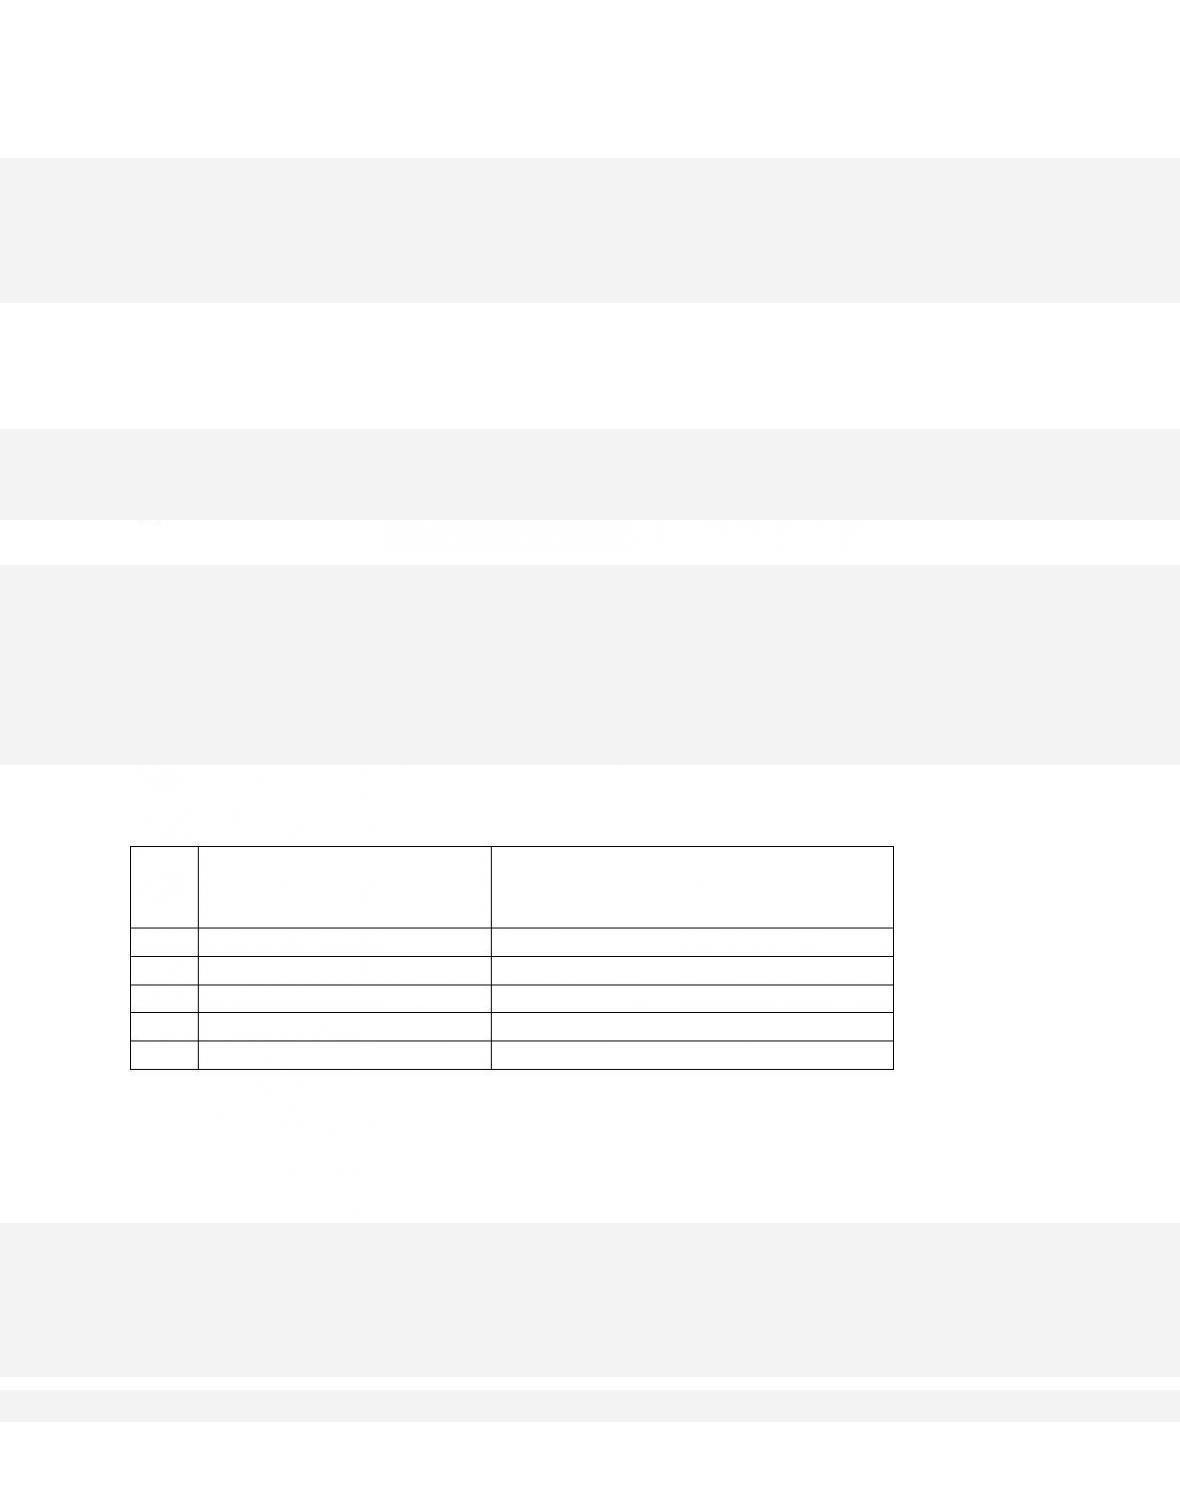
(Advanced analysis) The accompanying table is the before-tax consumption schedule for a
closed economy. If a 10 percent proportional tax on income is imposed,
the consumption
schedule will now be
$100
$134
33–53
$100
$144
200
212
300
278
400
344
500
410
C.
GDP
C
$100
$134
200
194
300
254
400
324
500
374
D.
GDP
C
$100
$146
200
218
300
286
400
352
500
412
76.
Gross Domestic Product (GDP)
Consumption (C)
$100
$140
200
200
300
260
400
320
500
380
(Advanced analysis) The accompanying table is the before-tax consumption schedule for a
closed economy. A 10 percent proportional tax on income would cause
77.
Gross Domestic Product (GDP)
Consumption (C)
$100
$140
200
200
300
260
400
320
500
380
(Advanced analysis) The accompanying table is the before-tax consumption schedule for a
closed economy. A 10 percent proportional tax on income would

33–55
Copyright © 2018 McGraw-Hill Education. All rights reserved. No reproduction or distribution without the prior
written consent of McGraw-Hill Education.
AACSB: Knowledge Application
Blooms: Understand
Diff i cu l ty :
02 Medium
Learning Objective: 33-02 Explain the role of built-in stabilizers in moderating business
cycles.
Test Bank: I
Topic:
Built-In Stability
Type: Table
78.
The cyclically adjusted budget refers to
79.
The cyclically adjusted budget tells us

80.
Which of the following statements is correct?
81.
If the economy has a cyclically adjusted budget surplus, this means that
82.
The actual budget deficit of the federal government in 2009 was about $1.4 trillion. On the
basis of this information, it

33–57
Copyright © 2018 McGraw-Hill Education. All rights reserved. No reproduction or distribution without the prior
written consent of McGraw-Hill Education.
A c c e s s i b i l i t y :
Keyboard Navigation
Blooms: Understand
Diff i cu l ty :
02 Medium
Learning Objective: 33-03 Describe how the cyclically adjusted budget reveals the status
of U.S. fiscal policy.
Test Bank: I
Topic: Evaluating How Expansionary or Contractionary Fiscal Policy Is Determined
83.
When current government expenditures equal current tax revenues and the economy is
achieving full employment,
84.
When current government expenditures exceed current tax revenues and the economy is
achieving full employment,
85.
When current tax revenues exceed current government expenditures and the economy is
achieving full employment,

86.
Suppose the government purposely changes the economy‘s cyclically adjusted budget from a
deficit of 3 percent of real GDP to a surplus of 1 percent of real GDP.
The government is
engaging in a(n)
87.
Suppose the government purposely changes the economy‘s cyclically adjusted budget from a
deficit of 0 percent of real GDP to a deficit of 3 percent of real GDP.
The government is
engaging in a(n)
33–59
Copyright © 2018 McGraw-Hill Education. All rights reserved. No reproduction or distribution without the prior
written consent of McGraw-Hill Education.
Blooms: Understand
Diffic ult y: 02 Medium
Learning Objective: 33-03 Describe how the cyclically adjusted budget reveals the status
of U.S. fiscal policy.
Test Bank: I
Topic:
Evaluating How Expansionary or Contractionary Fiscal Policy Is Determined
88.
Suppose the government cuts taxes to keep the economy’s cyclically adjusted budget in
balance when the economy is expanding. The government is engaging in a(n)
89.
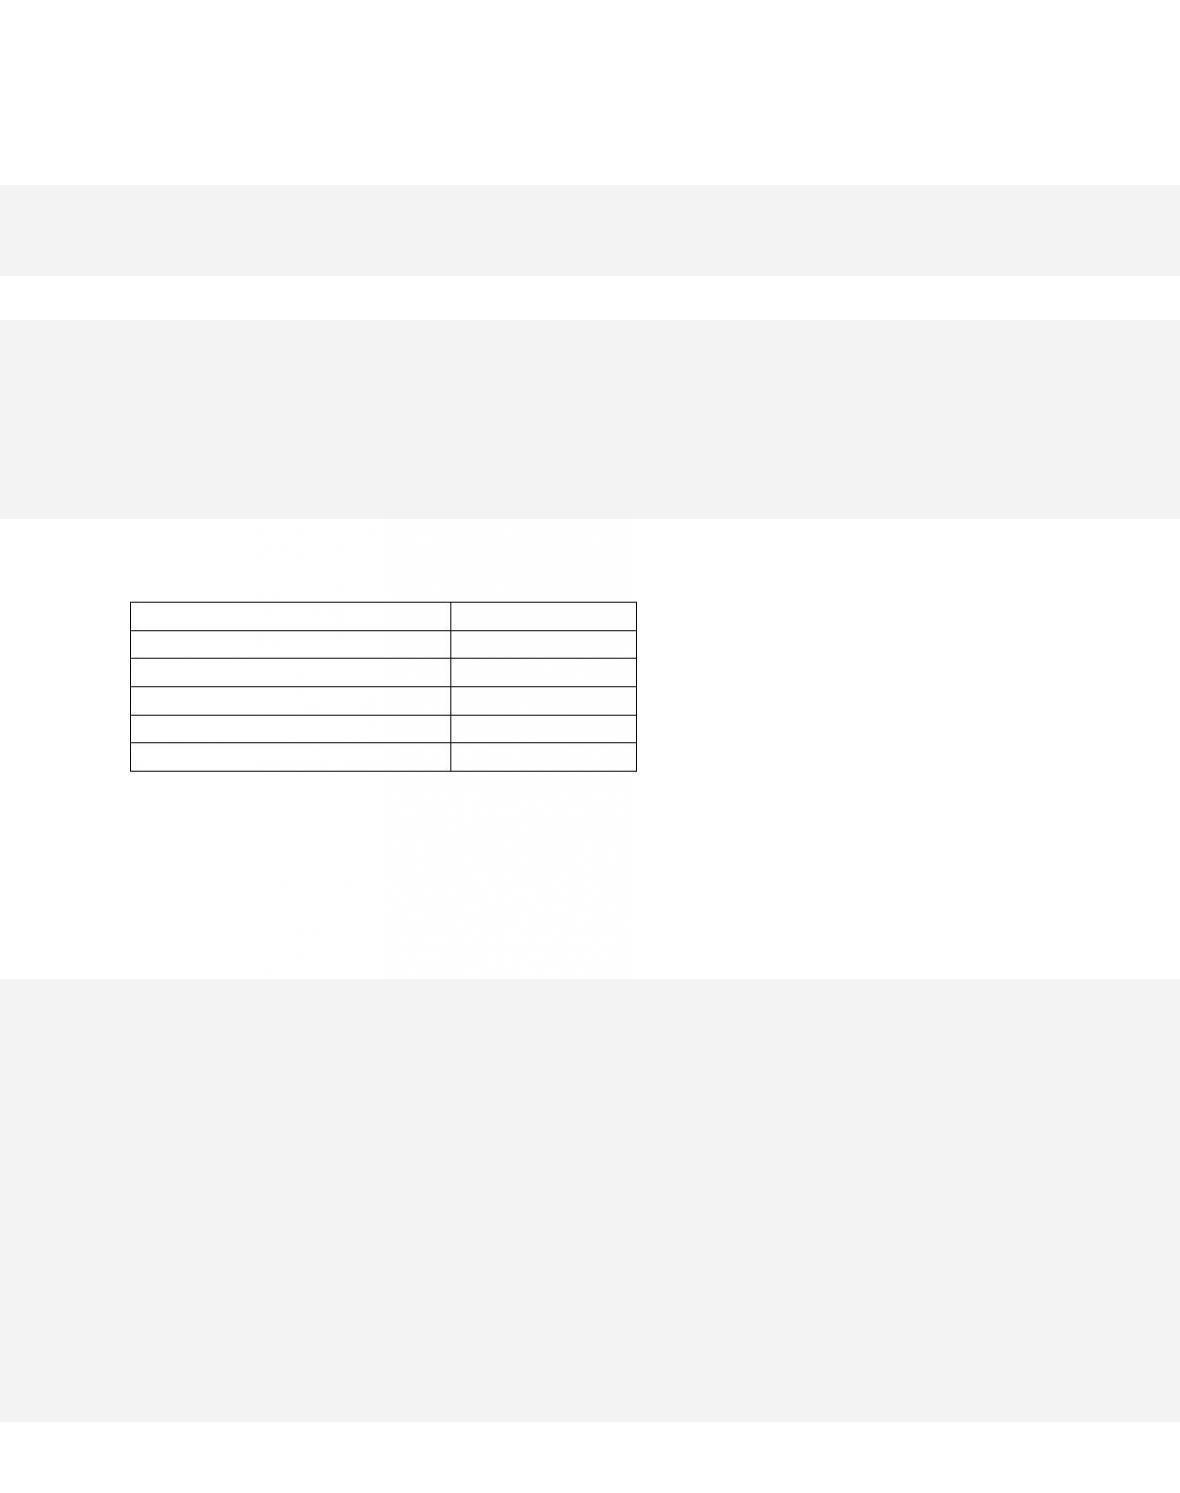
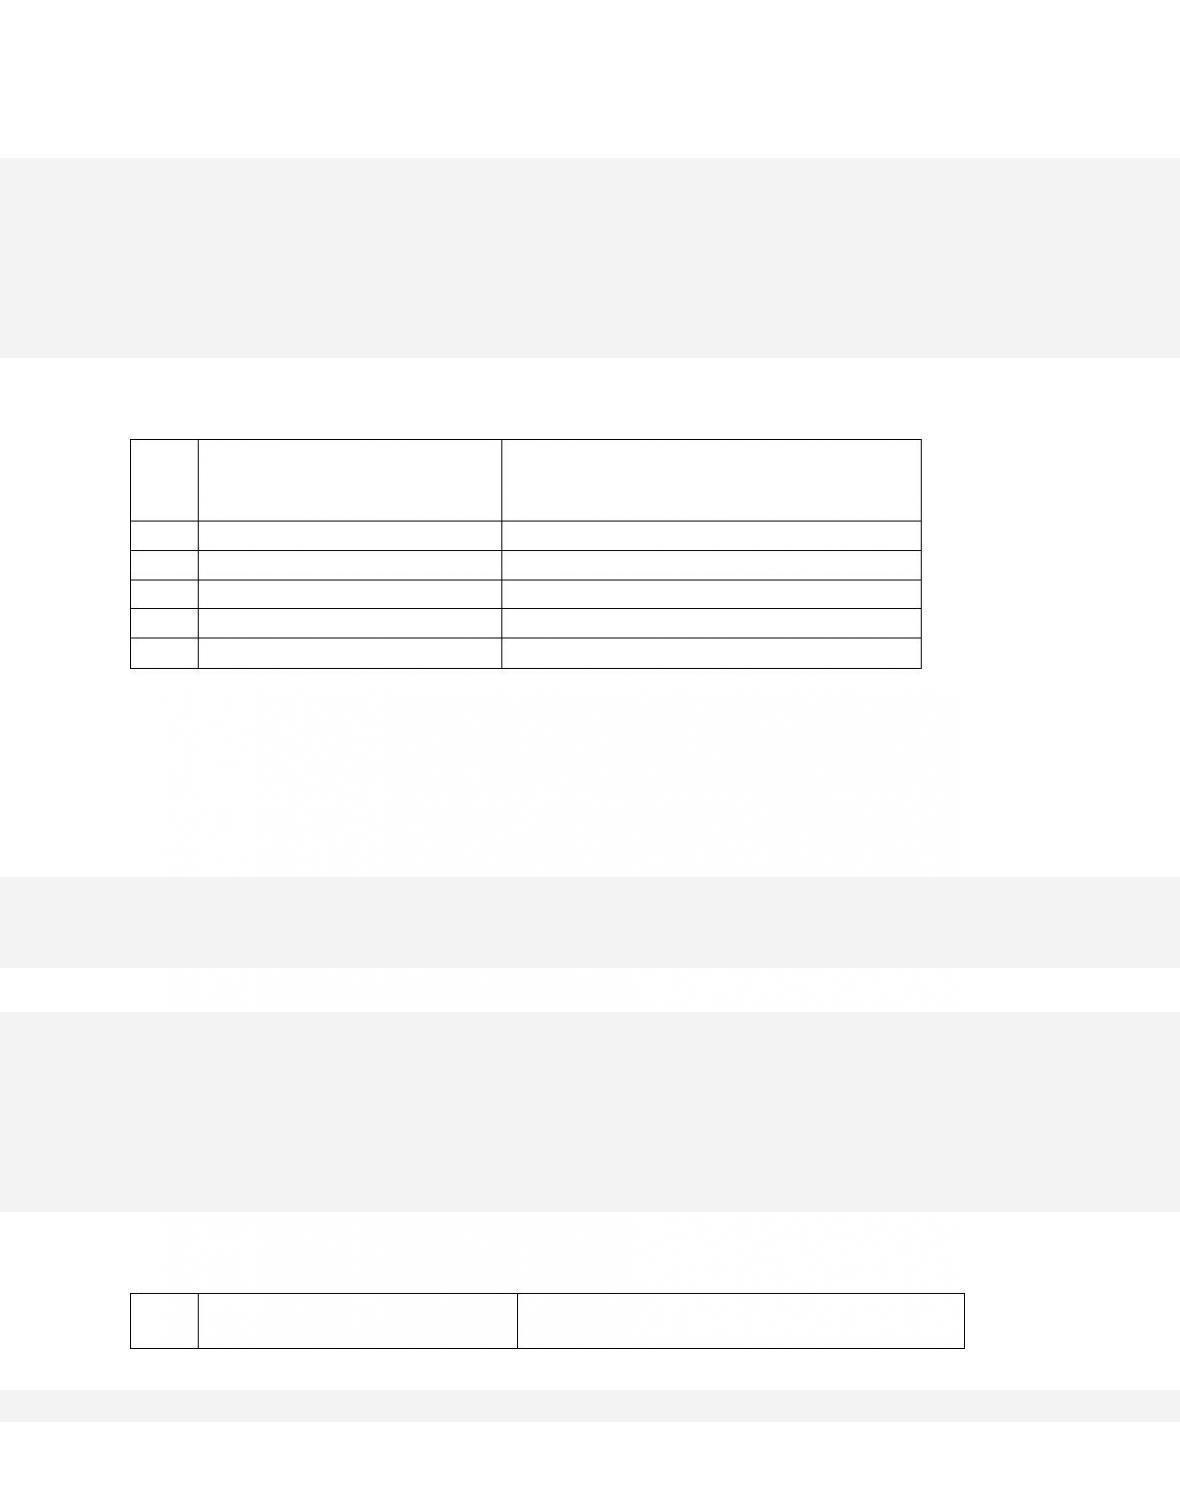
Year
Actual Budget, Percent of
GDP
(-deficits, +surpluses)
Cyclically-Adjusted Budget, Percent of
GDP
(-deficits, +surpluses)
1998
0
0
1999
-3
0
2000
-5
-2
2001
-2
-2
2002
+2
+1
Refer to the data for a fictional economy. The changes in the budget conditions between 1998 and
1999 best reflect
33–60
Copyright © 2018 McGraw-Hill Education. All rights reserved. No reproduction or distribution without the prior
written consent of McGraw-Hill Education.
AACSB: Knowledge Application
Blooms: Understand
Diffic ult y: 02 Medium
Learning Objective: 33-03 Describe how the cyclically adjusted budget reveals the status
of U.S. fiscal policy.
Test Bank: I
Topic:
Evaluating How Expansionary or Contractionary Fiscal Policy Is Determined
Type: Table
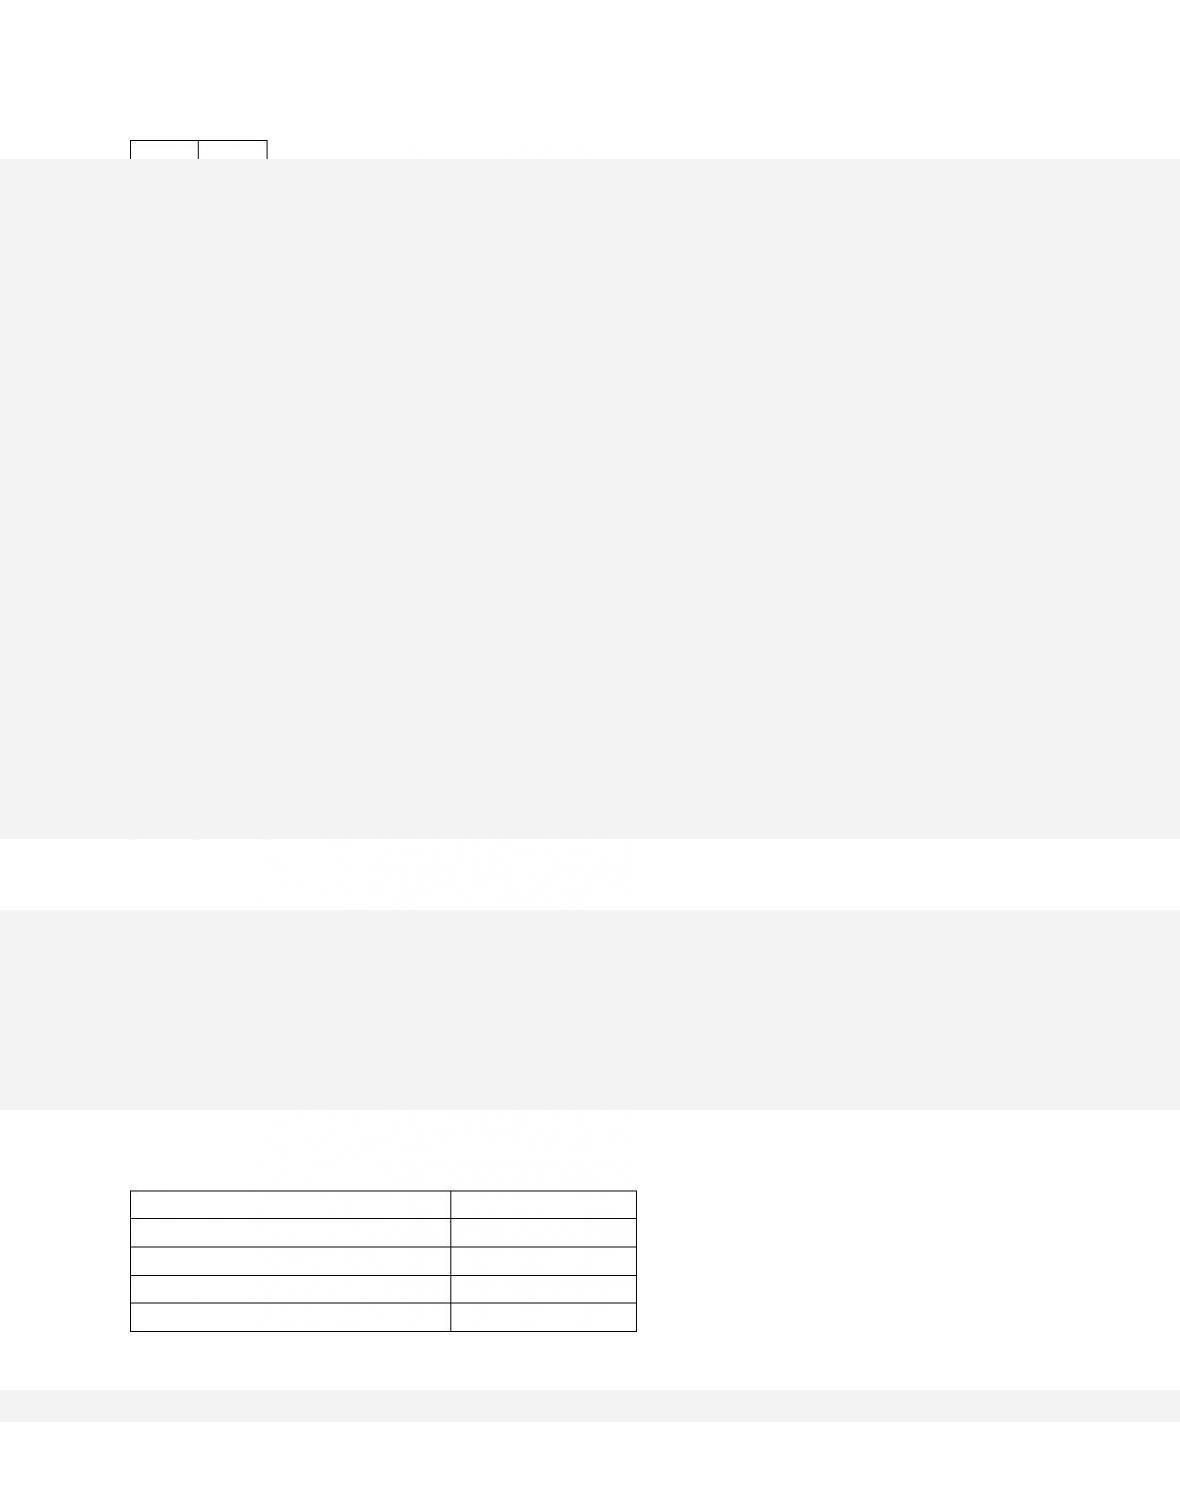
90.
Year
Actual Budget, Percent of
GDP
(-deficits, +surpluses)
Cyclically-Adjusted Budget, Percent of
GDP
(-deficits, +surpluses)
1998
0
0
1999
-3
0
2000
-5
-2
2001
-2
-2
2002
+2
+1
Refer to the data for a fictional economy. The changes in the budget conditions between 1999 and
2000 best reflect
91.
Year
Actual Budget, Percent of GDP
(-deficits, +surpluses)
Cyclically-Adjusted Budget, Percent of GDP
(-deficits, +surpluses)