38.
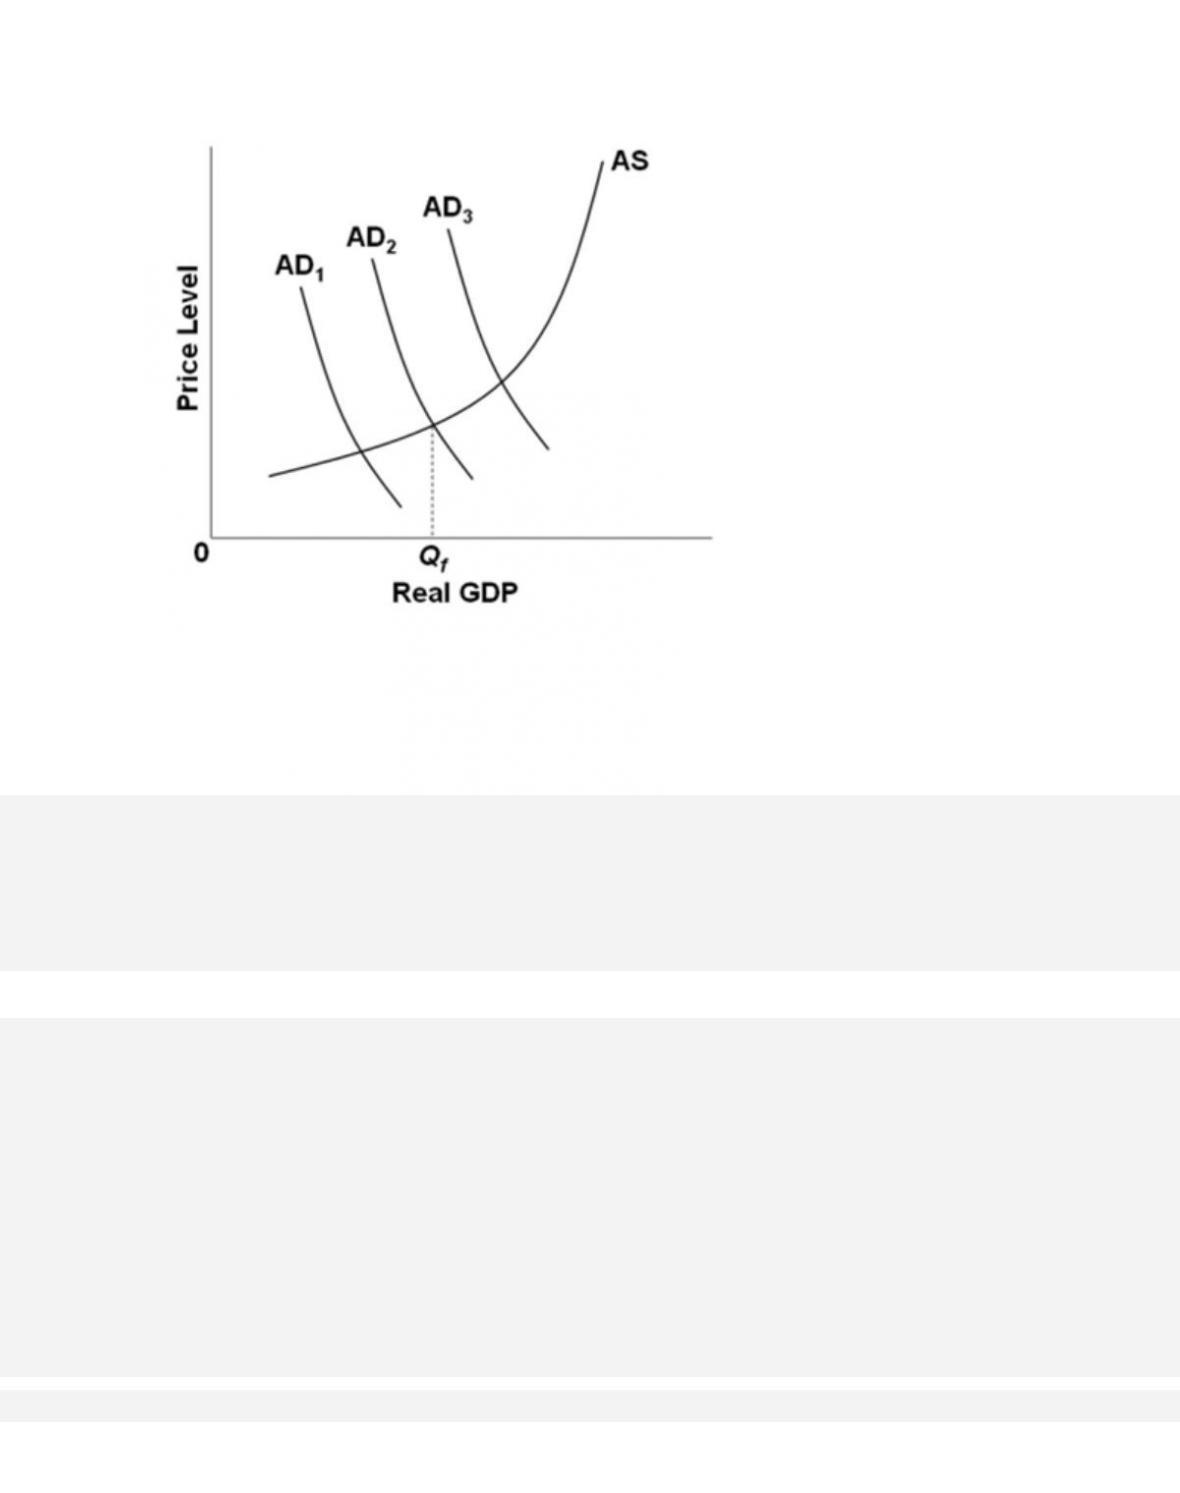
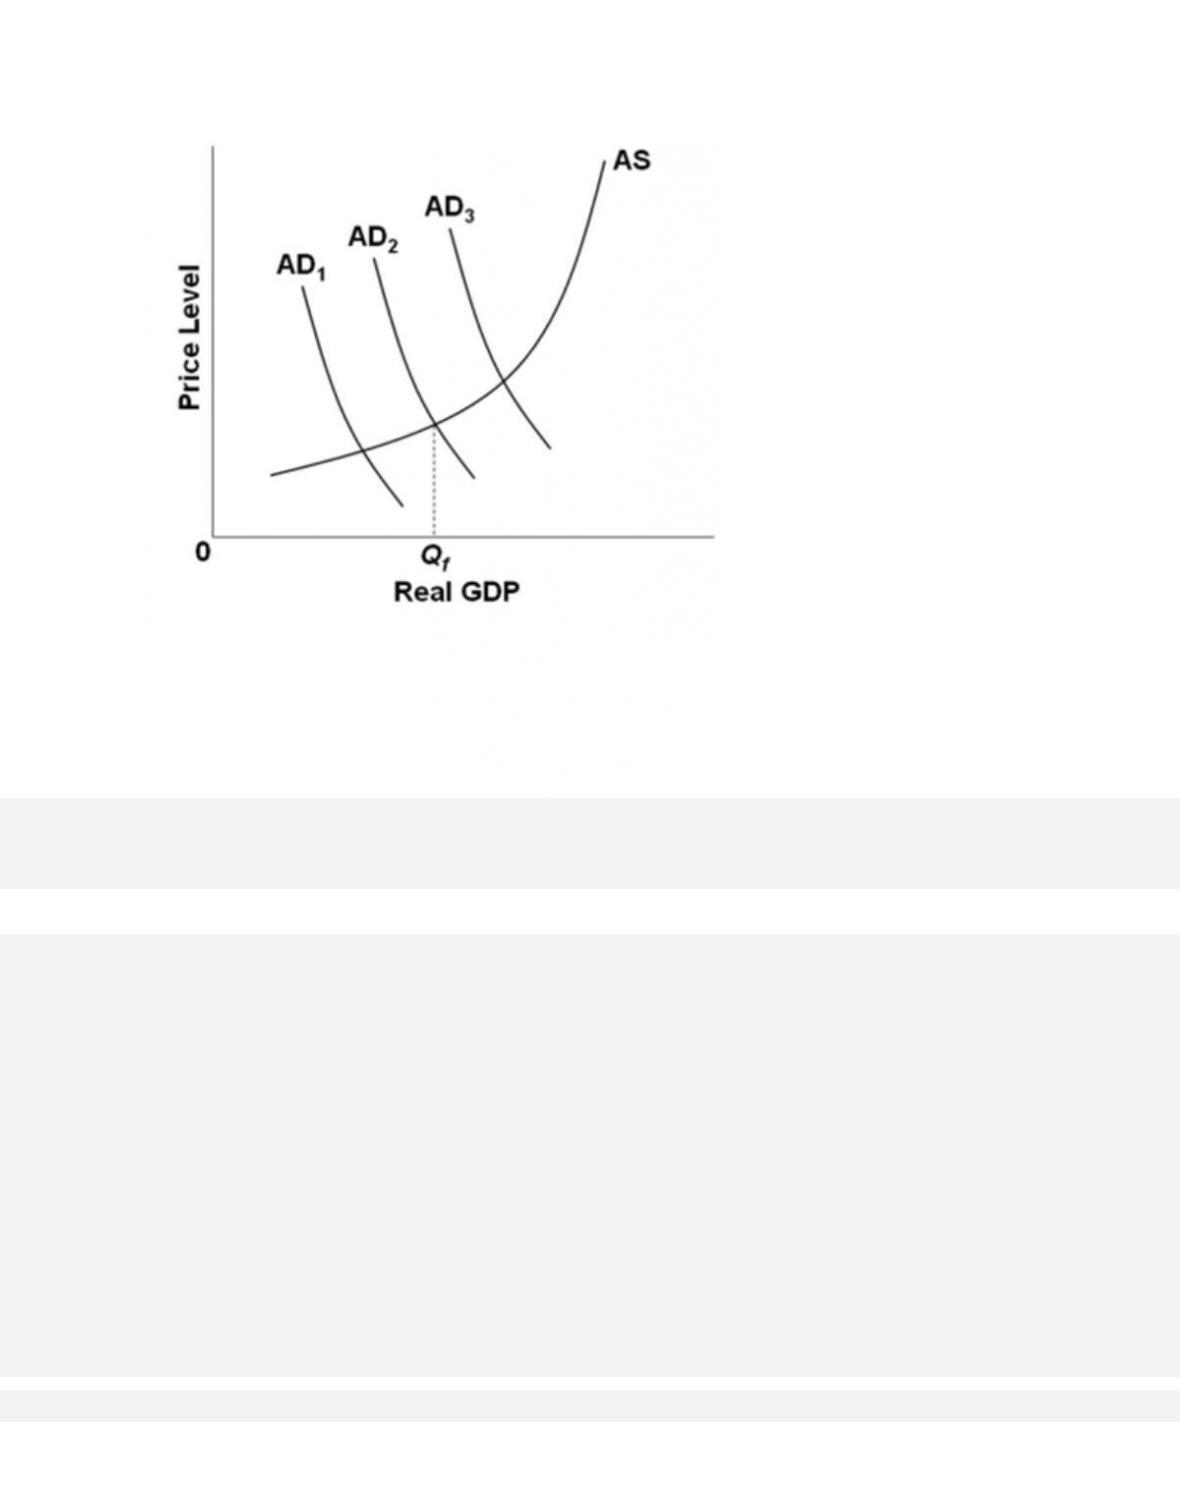
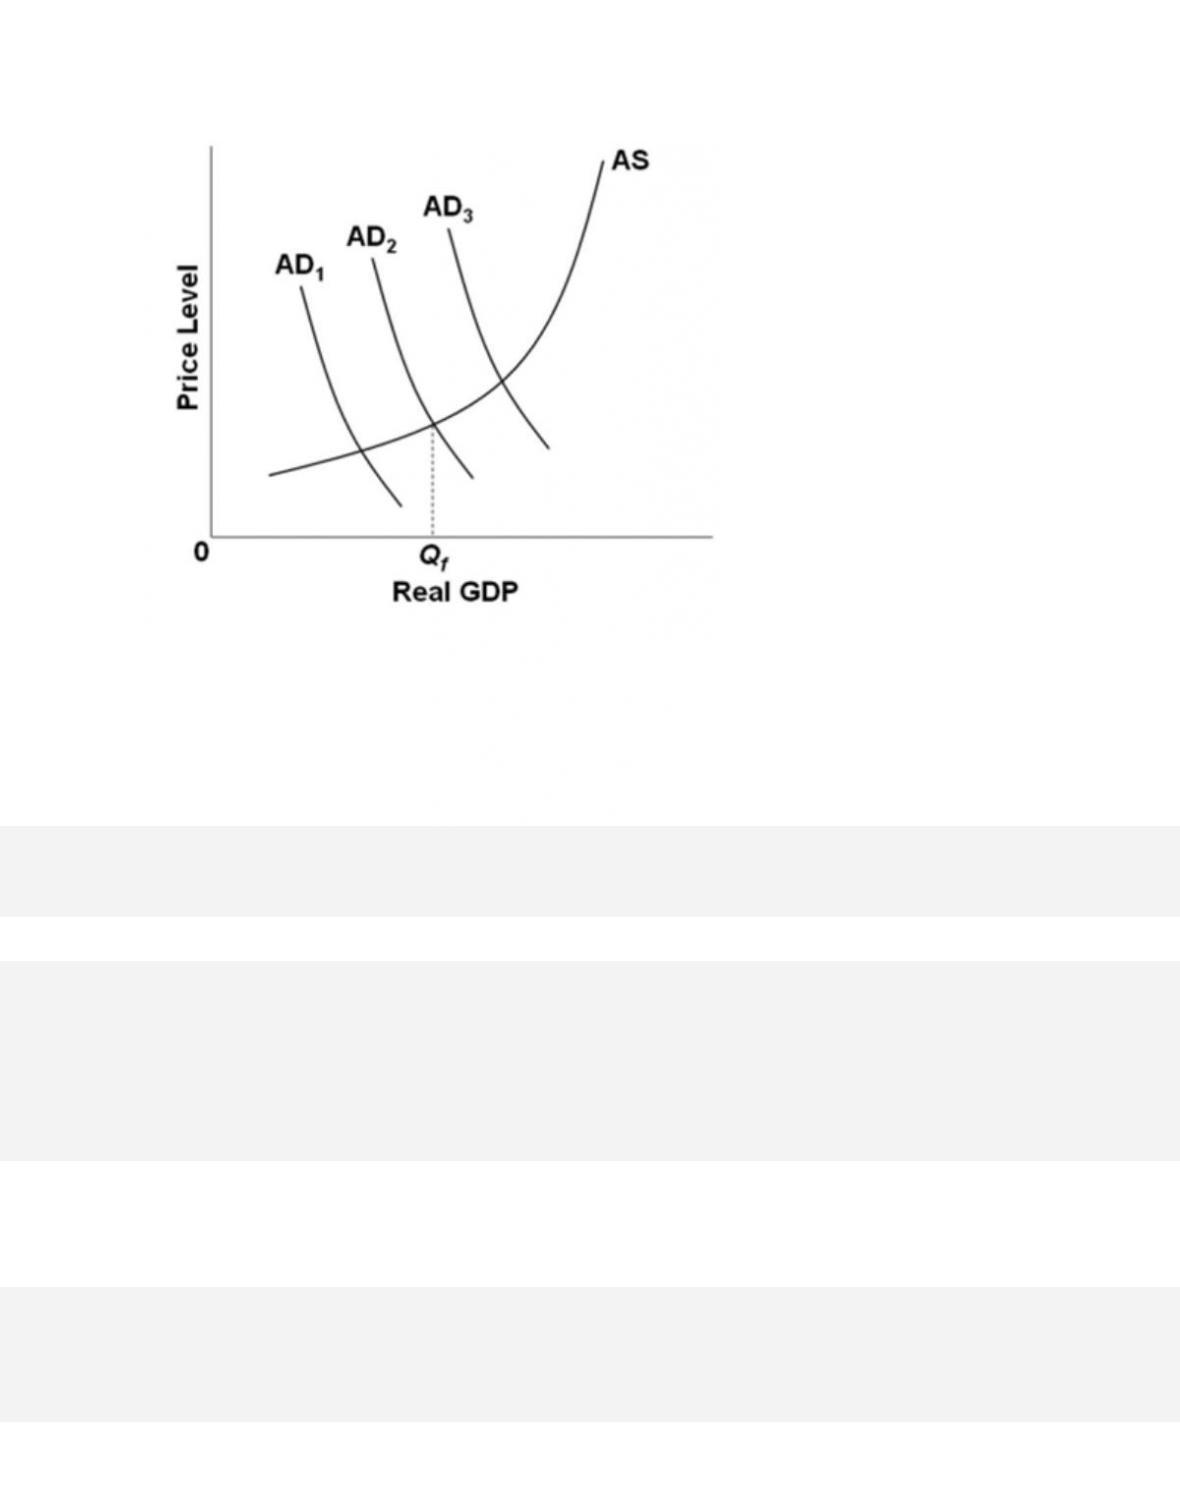
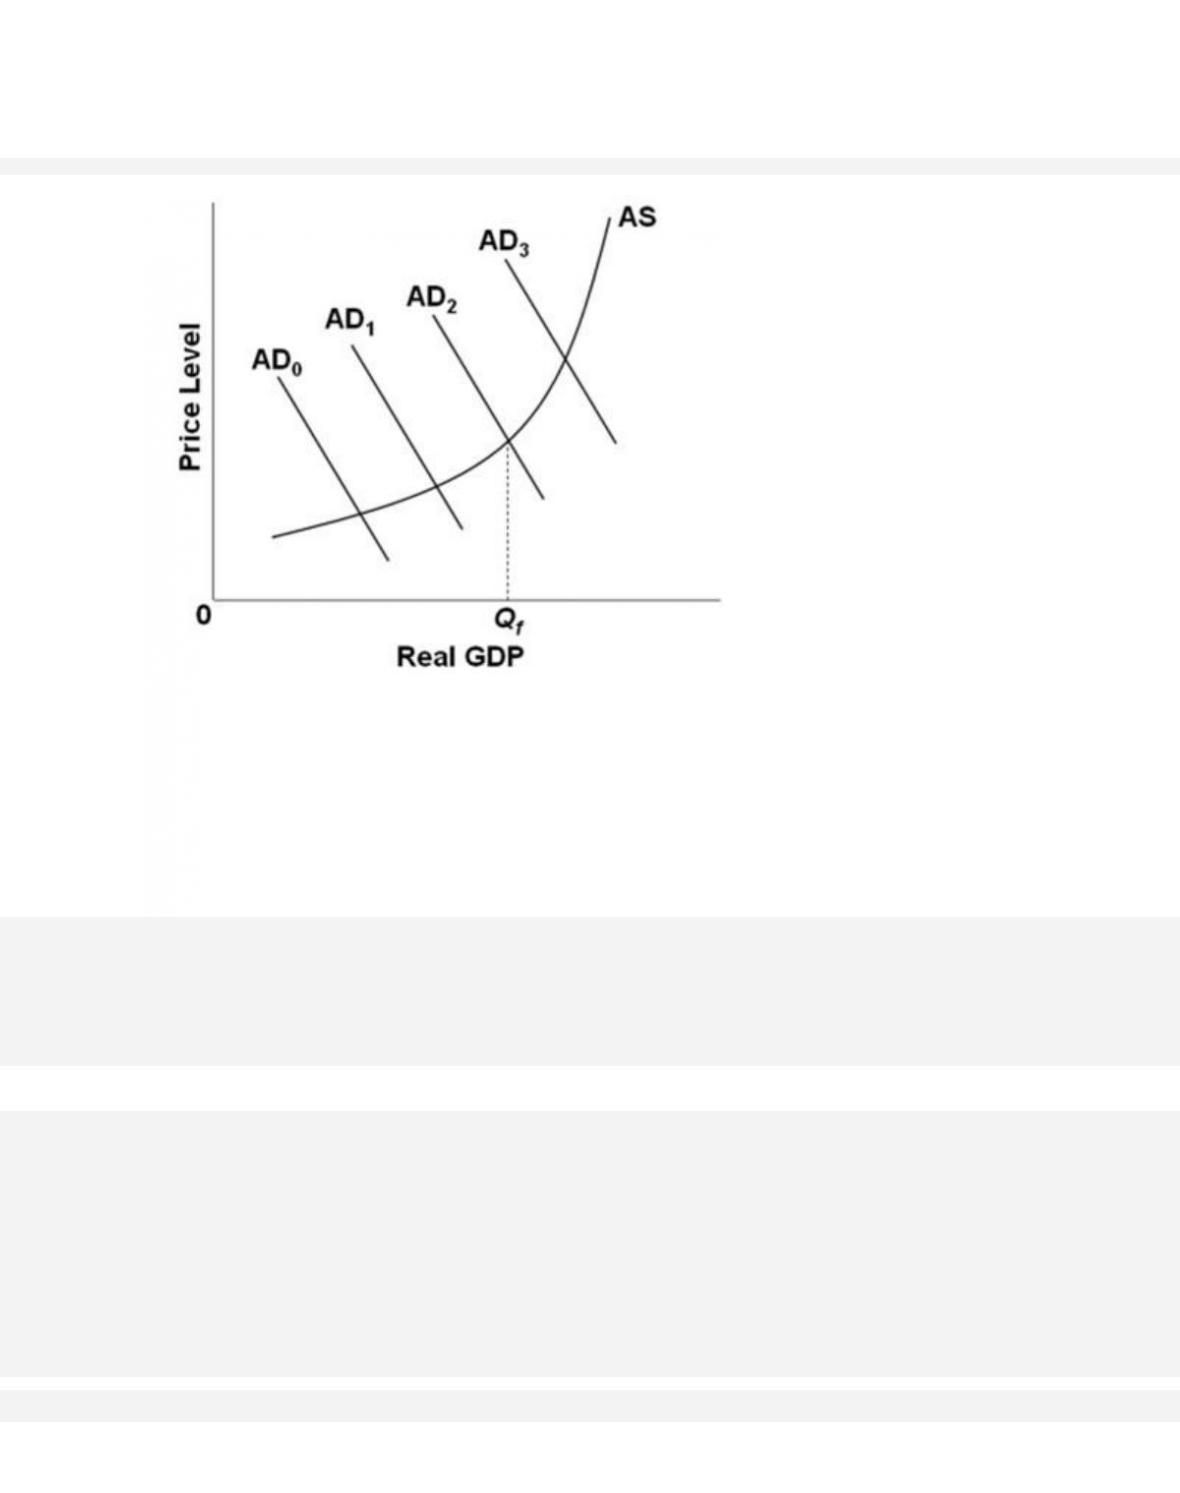
Refer to the diagram, in which Qf is the full-employment output. If aggregate demand curve AD2
describes the current situation, appropriate fiscal policy would be to
39.
Refer to the diagram, in which Qf is the full-employment output. The shift of the aggregate
demand curve from AD3 to AD2 is consistent with

40.
Refer to the diagram, in which Qf is the full-employment output. The shift of the aggregate
demand curve from AD1 to AD2 is consistent with
41.
Refer to the diagram, in which Qf is the full-employment output. The shift in the aggregate
demand curve from AD3 to AD2 could result from which of the following
fiscal policy
actions?
42.
Suppose the price level is fixed, the MPC is 0.5, and the GDP gap is a negative $80 billion.
To achieve full-employment output (exactly), government should
33–25
Copyright © 2018 McGraw-Hill Education. All rights reserved. No reproduction or distribution without the prior
written consent of McGraw-Hill Education.
C.
reduce taxes by $40 billion.
D. reduce taxes by $80 billion.
43.
Suppose the price level is fixed, the MPC is 0.5, and the GDP gap is a negative $100 billion.
To achieve full-employment output (exactly), government should
44.
Suppose the price level is fixed, the MPC is 0.8, and the GDP gap is a negative $200 billion.
To achieve full-employment output (exactly), government should
33–26
Copyright © 2018 McGraw-Hill Education. All rights reserved. No reproduction or distribution without the prior
written consent of McGraw-Hill Education.
Topic:
Fiscal Policy and the AD–AS Model
45.
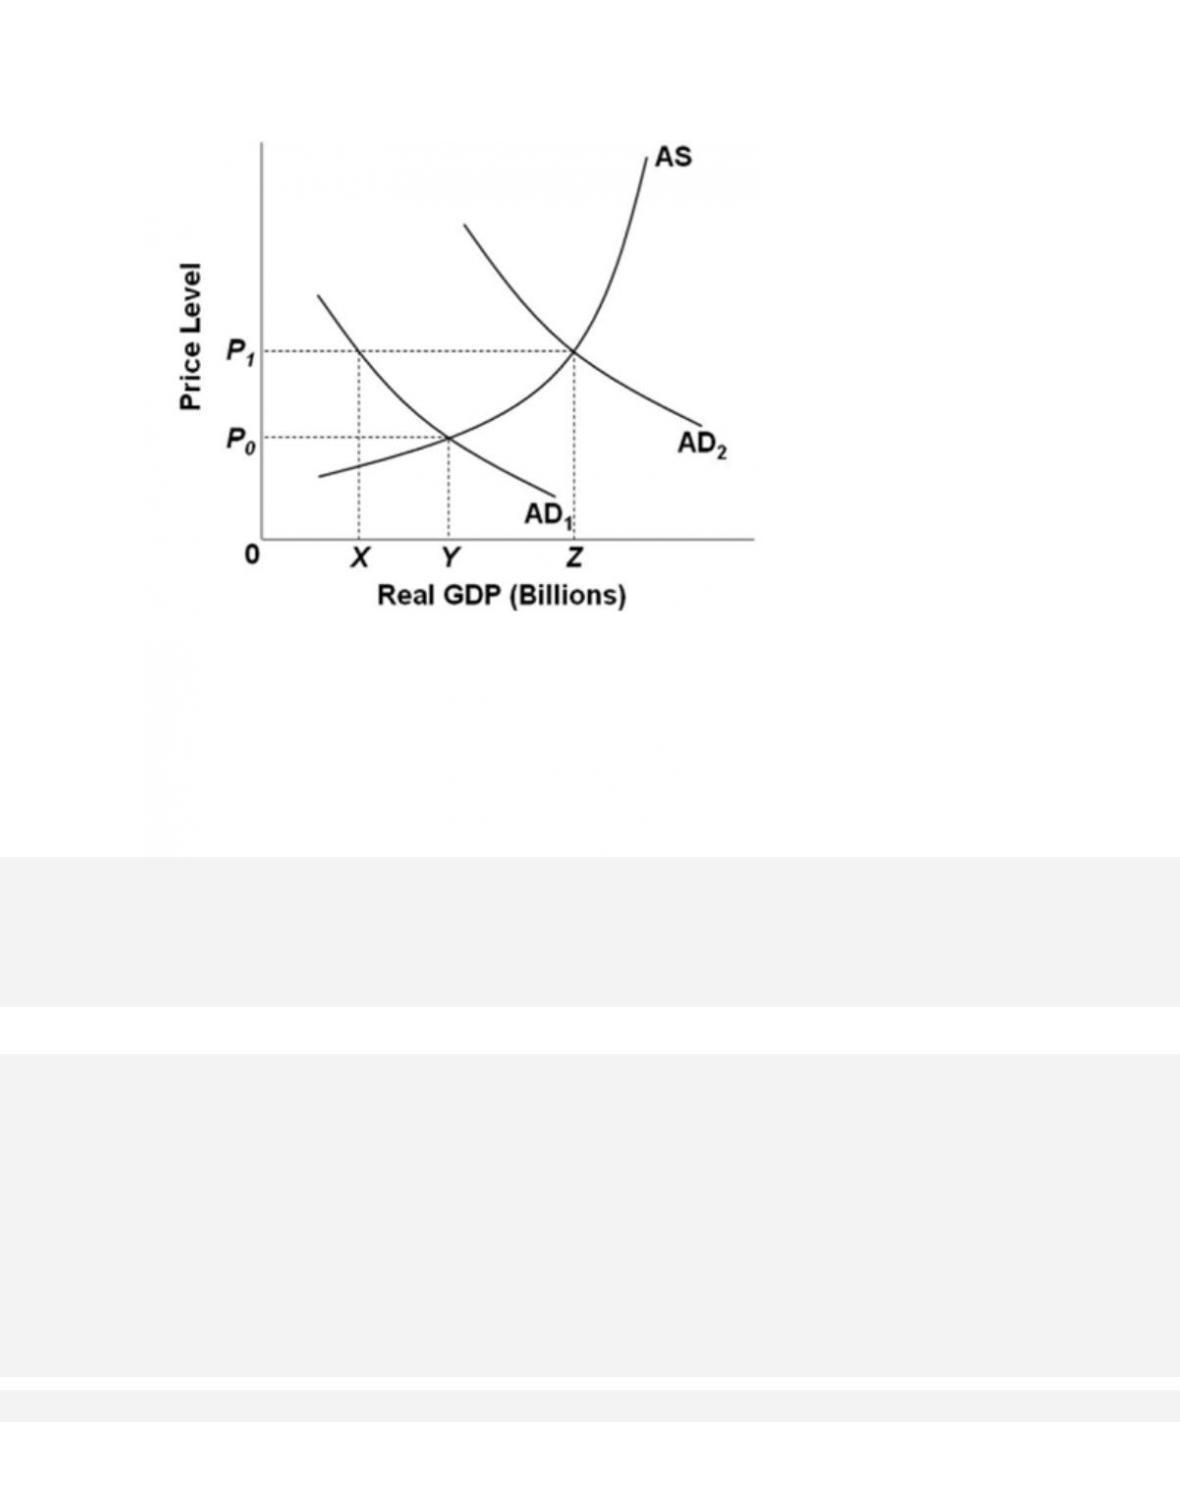
Refer to the figure. Suppose that the economy is currently operating at the intersection of AS and
AD2 and that the full-employment level of output is Y. If
contractionary fiscal policy and
accompanying multiplier effects move aggregate demand from AD2 to AD1, what will be the
effect on real GDP and the price level?
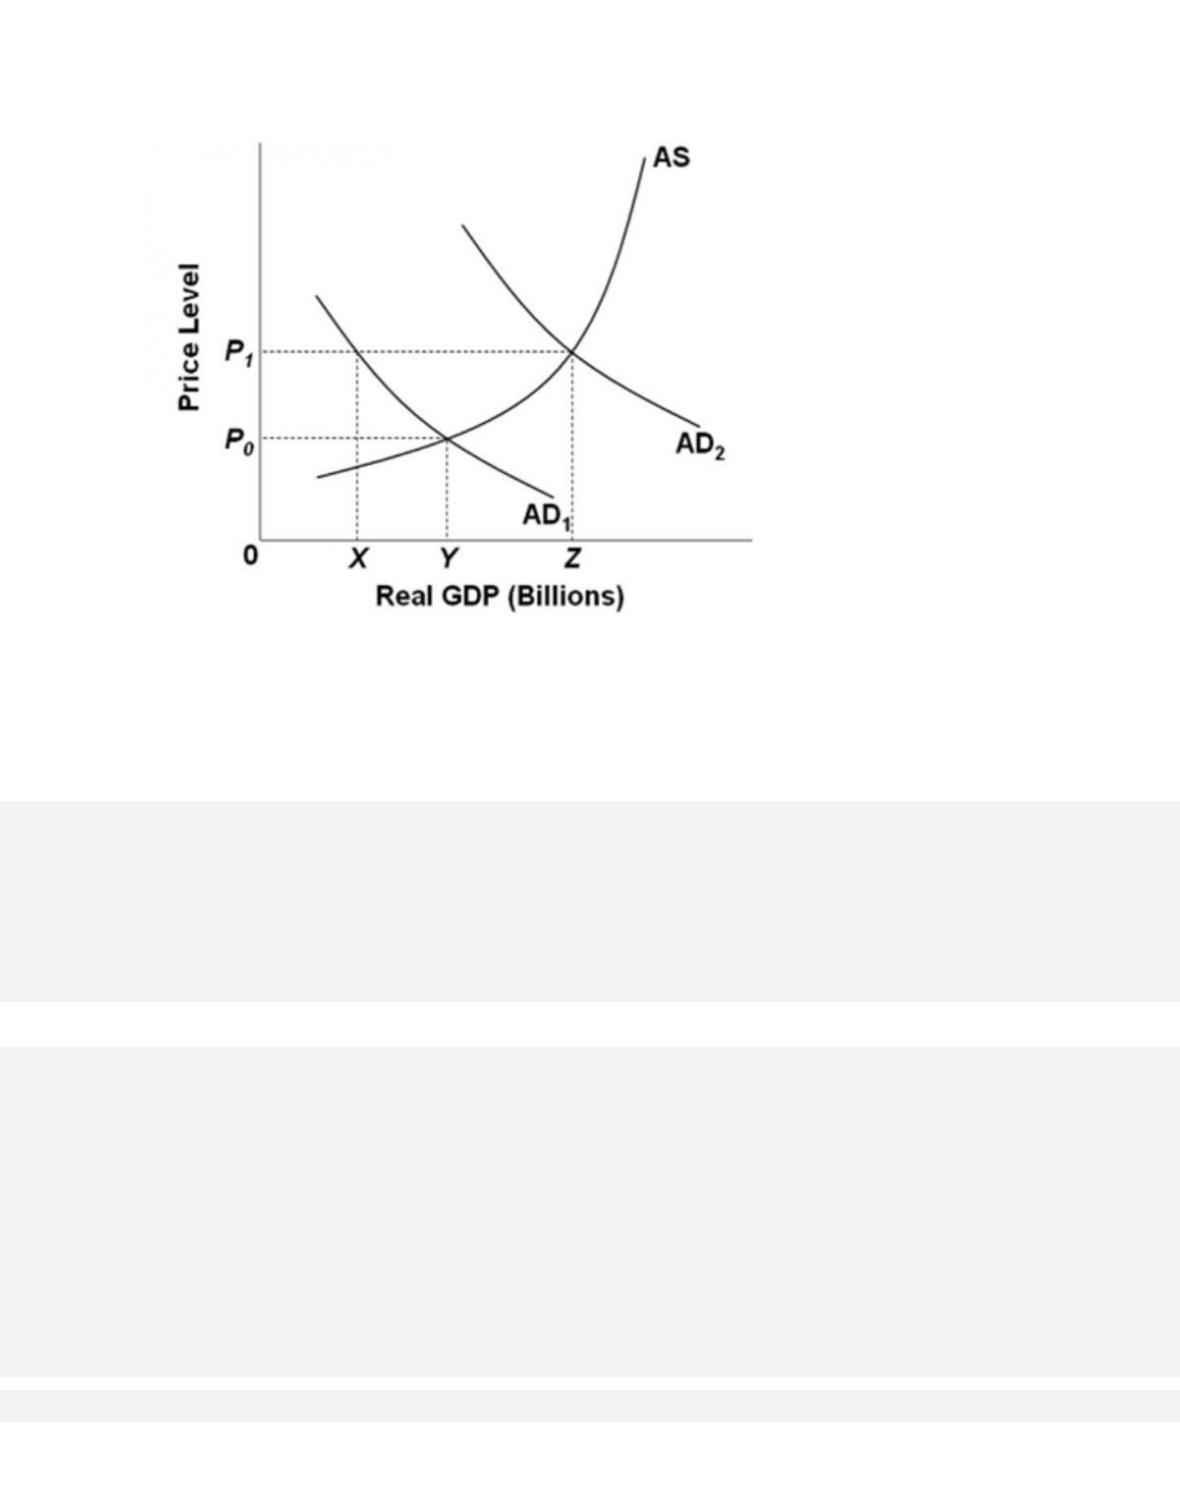
46.
Refer to the figure. Suppose that the economy is currently operating at the intersection of AS and
AD2 and that the full-employment level of output is Y. Because of the
ratchet effect,
47.
Refer to the figure. Suppose that the economy is currently operating at the intersection of AS and
AD2 and that the full-employment level of output is Y. If the
government wants to move the level
of real GDP back to Y and reduce demand-pull inflation, in the presence of a ratchet effect, it
should
48.
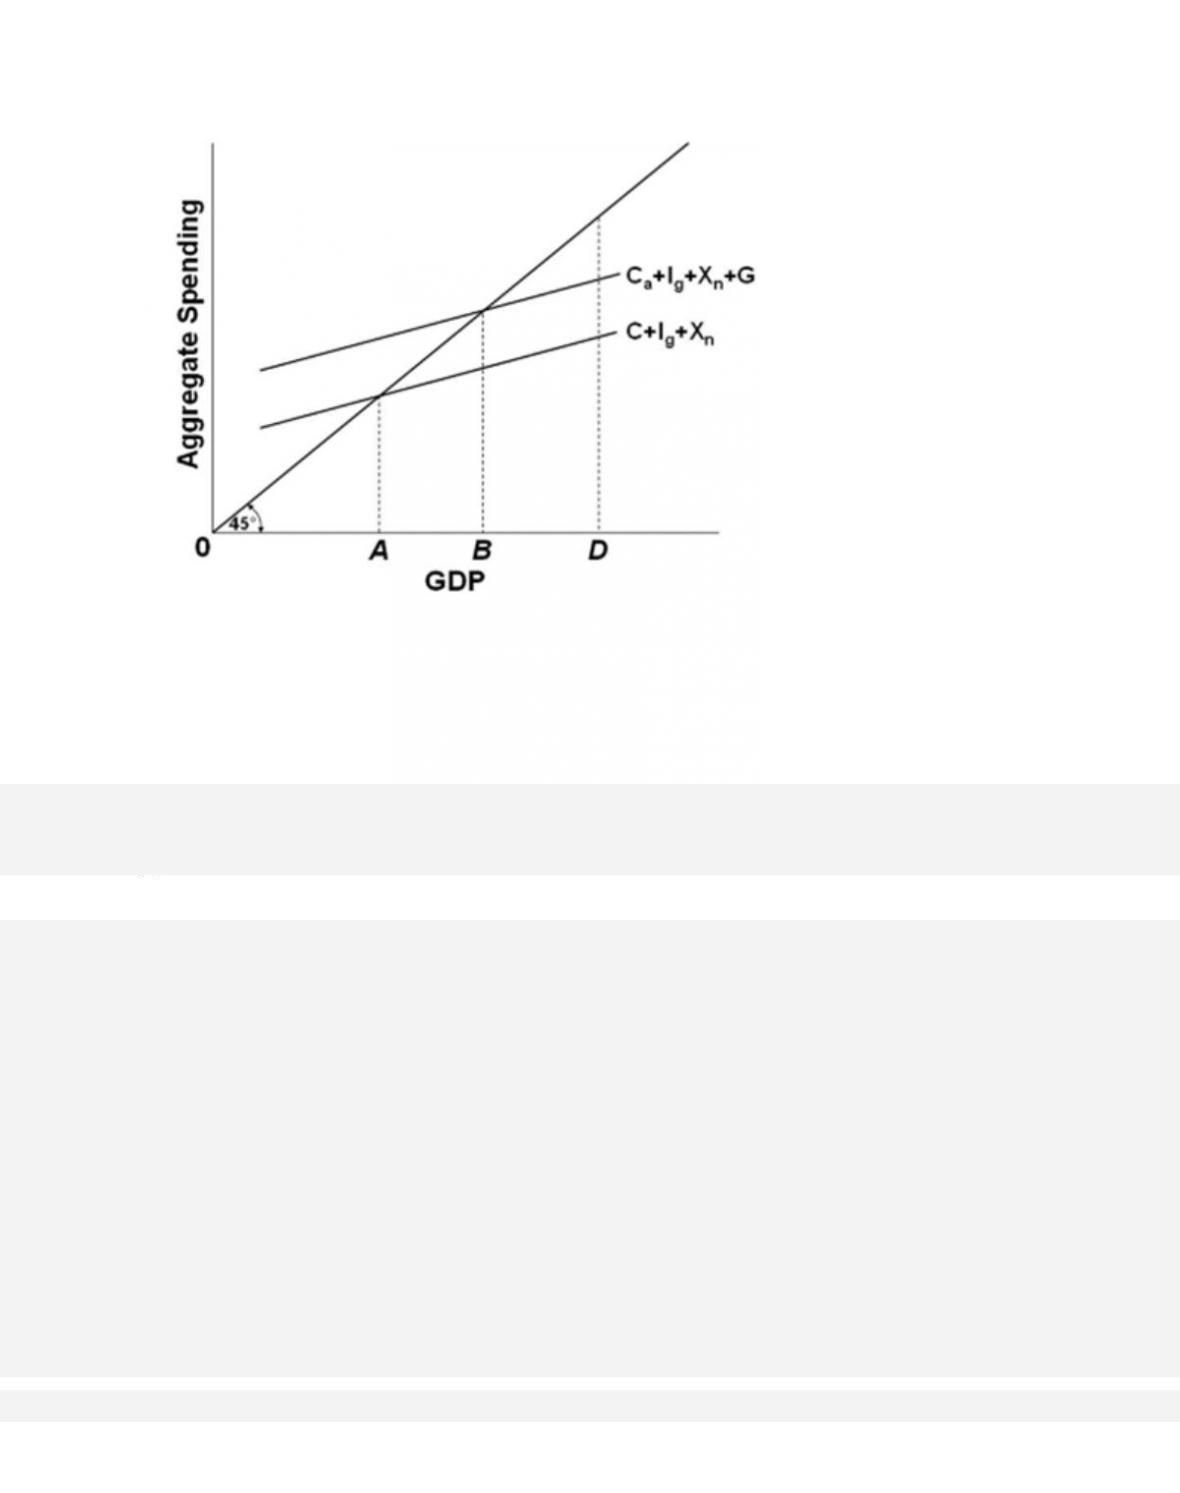
Refer to the diagram. If the full-employment level of GDP is D, then it would be appropriate
fiscal policy for government to

49.
Refer to the diagram. If the full-employment level of GDP is A, then it would be appropriate
fiscal policy for government to

50.
In the diagram, it is assumed that investment, net exports, and government purchases

51.
Refer to the diagram. The equilibrium level of GDP is
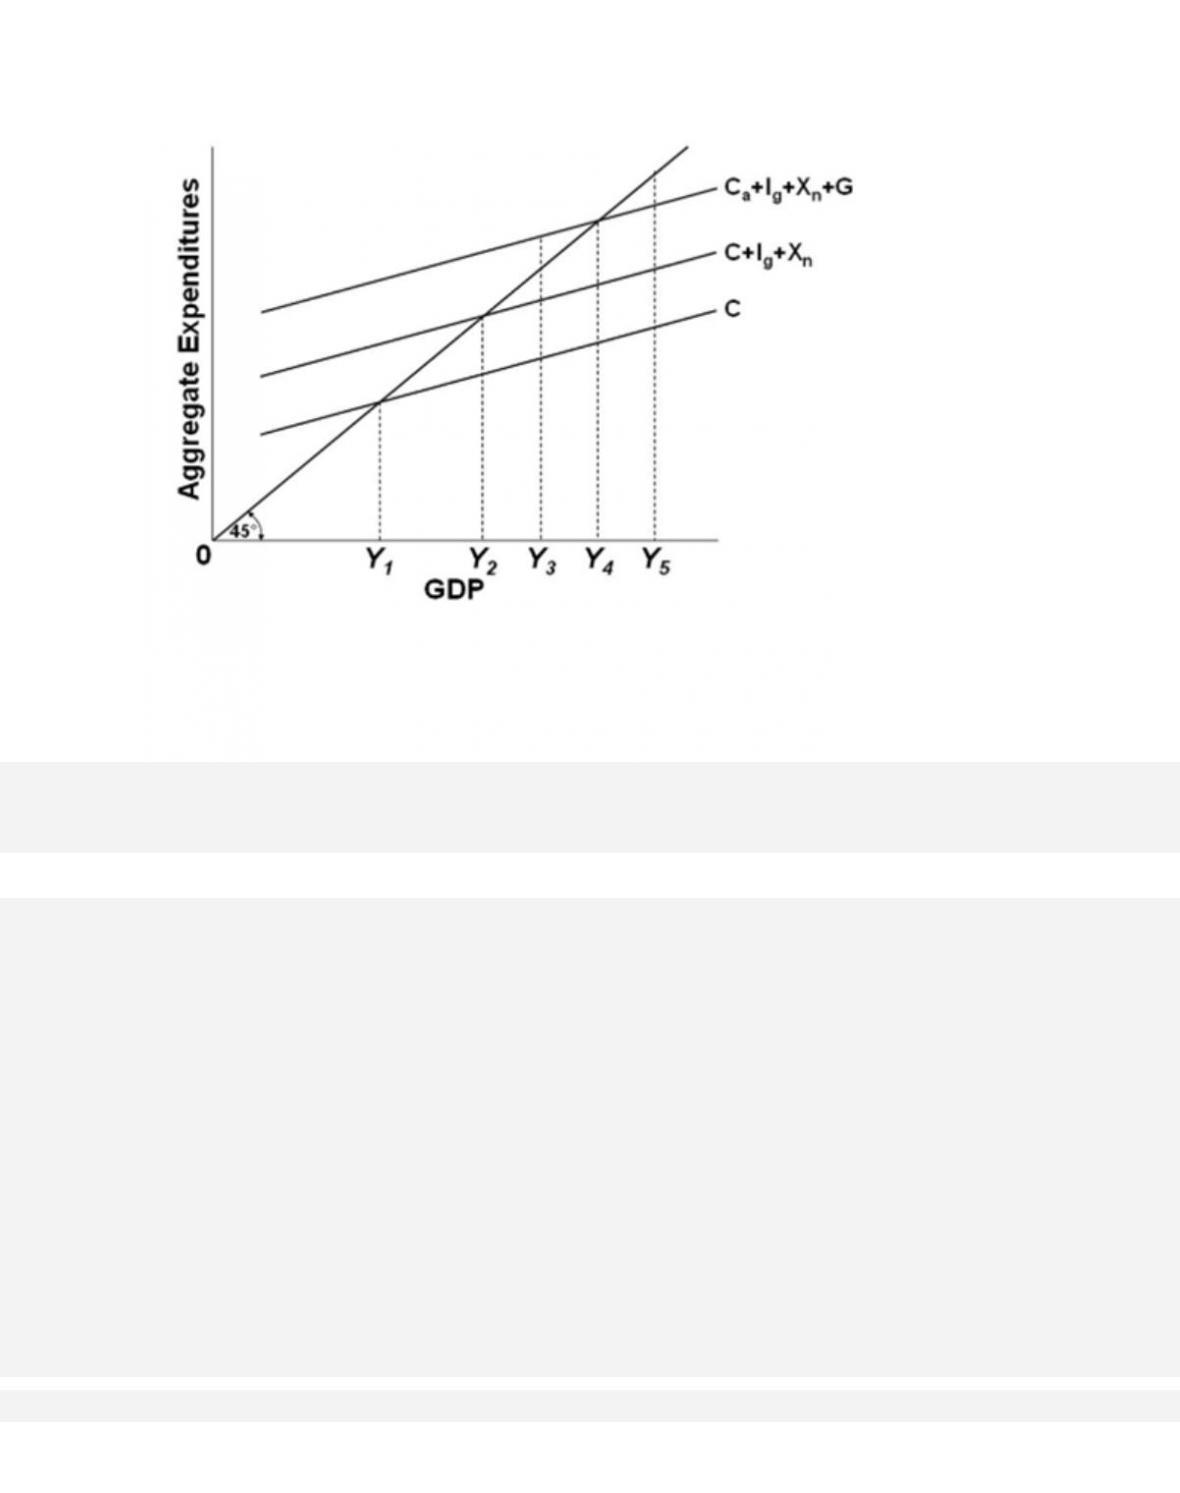
52.
Refer to the diagram. If the full-employment GDP is Y5, government should
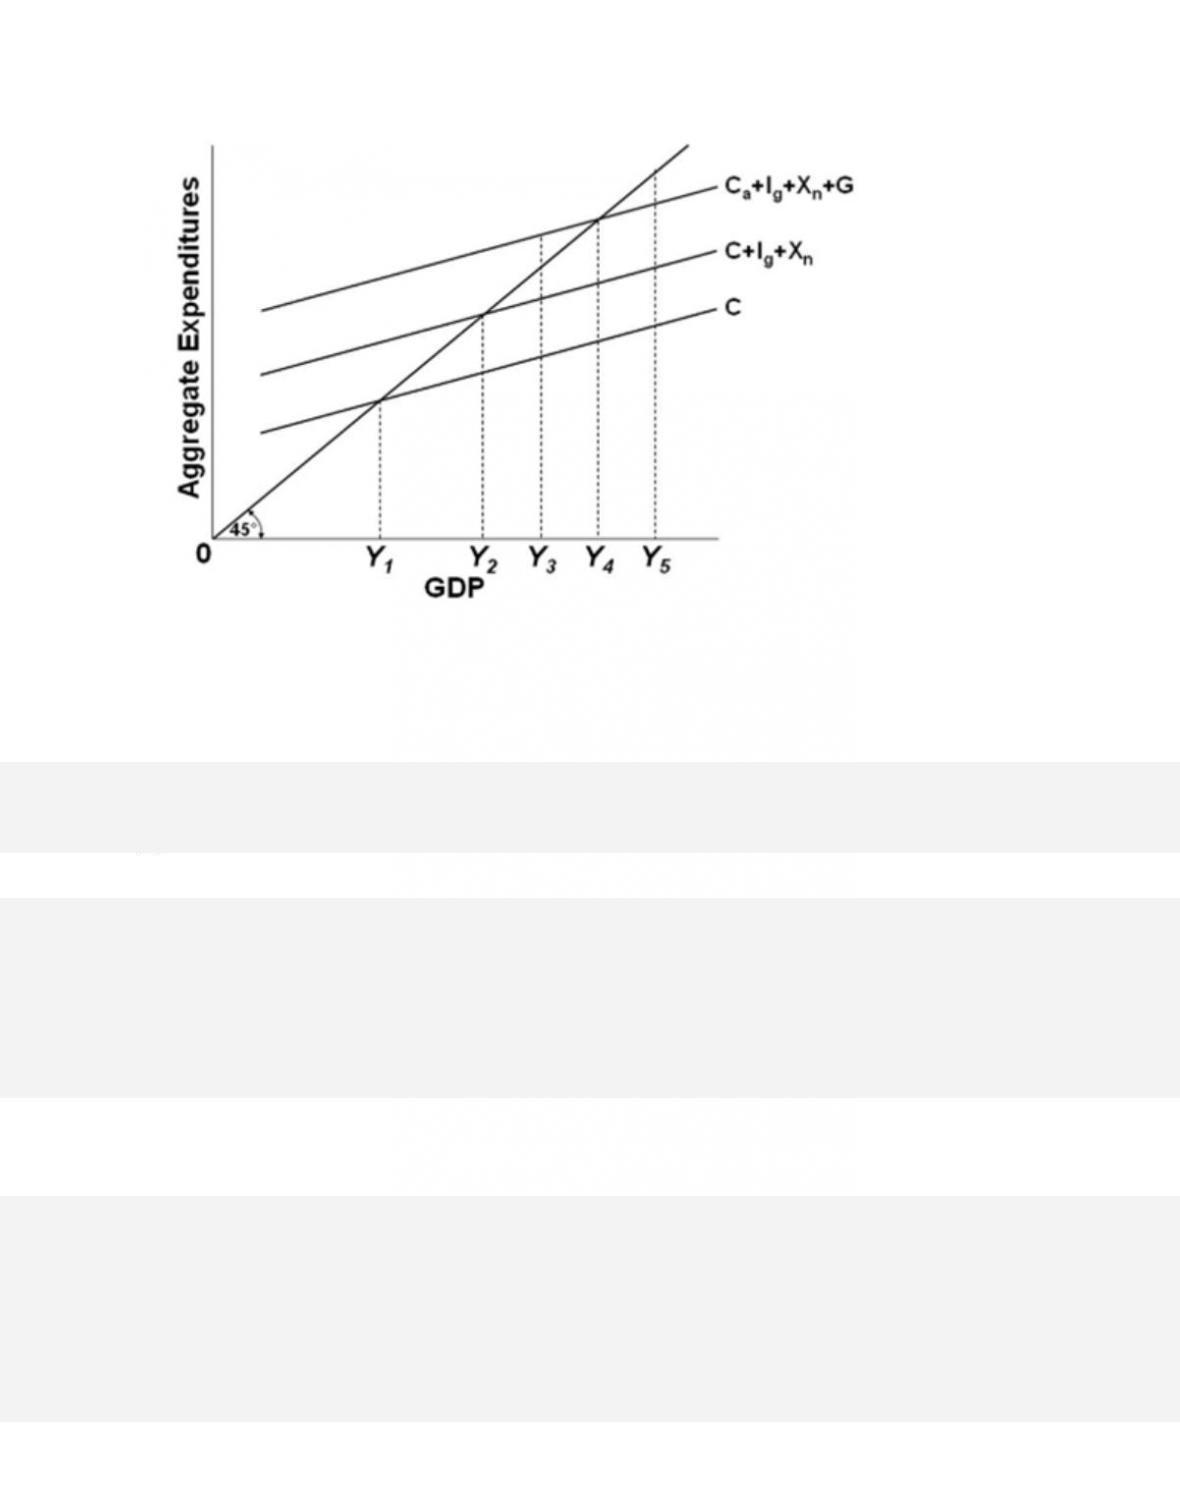
53.
Refer to the diagram. If the full-employment GDP is Y3, government should
54.
Built–in stability means that

33–35
Copyright © 2018 McGraw-Hill Education. All rights reserved. No reproduction or distribution without the prior
written consent of McGraw-Hill Education.
upswings and downswings in business activity.
D.
government expenditures and tax receipts automatically balance over the business cycle,
though they may be out of balance in any single year.
55.
If Congress adjusted the U.S. tax system so that the MPC was reduced, the
56.
A major advantage of the built-in or automatic stabilizers is that they
57.
Which of the following best describes the built-in stabilizers as they function in the United
States?
58.
Which of the following statements is correct?
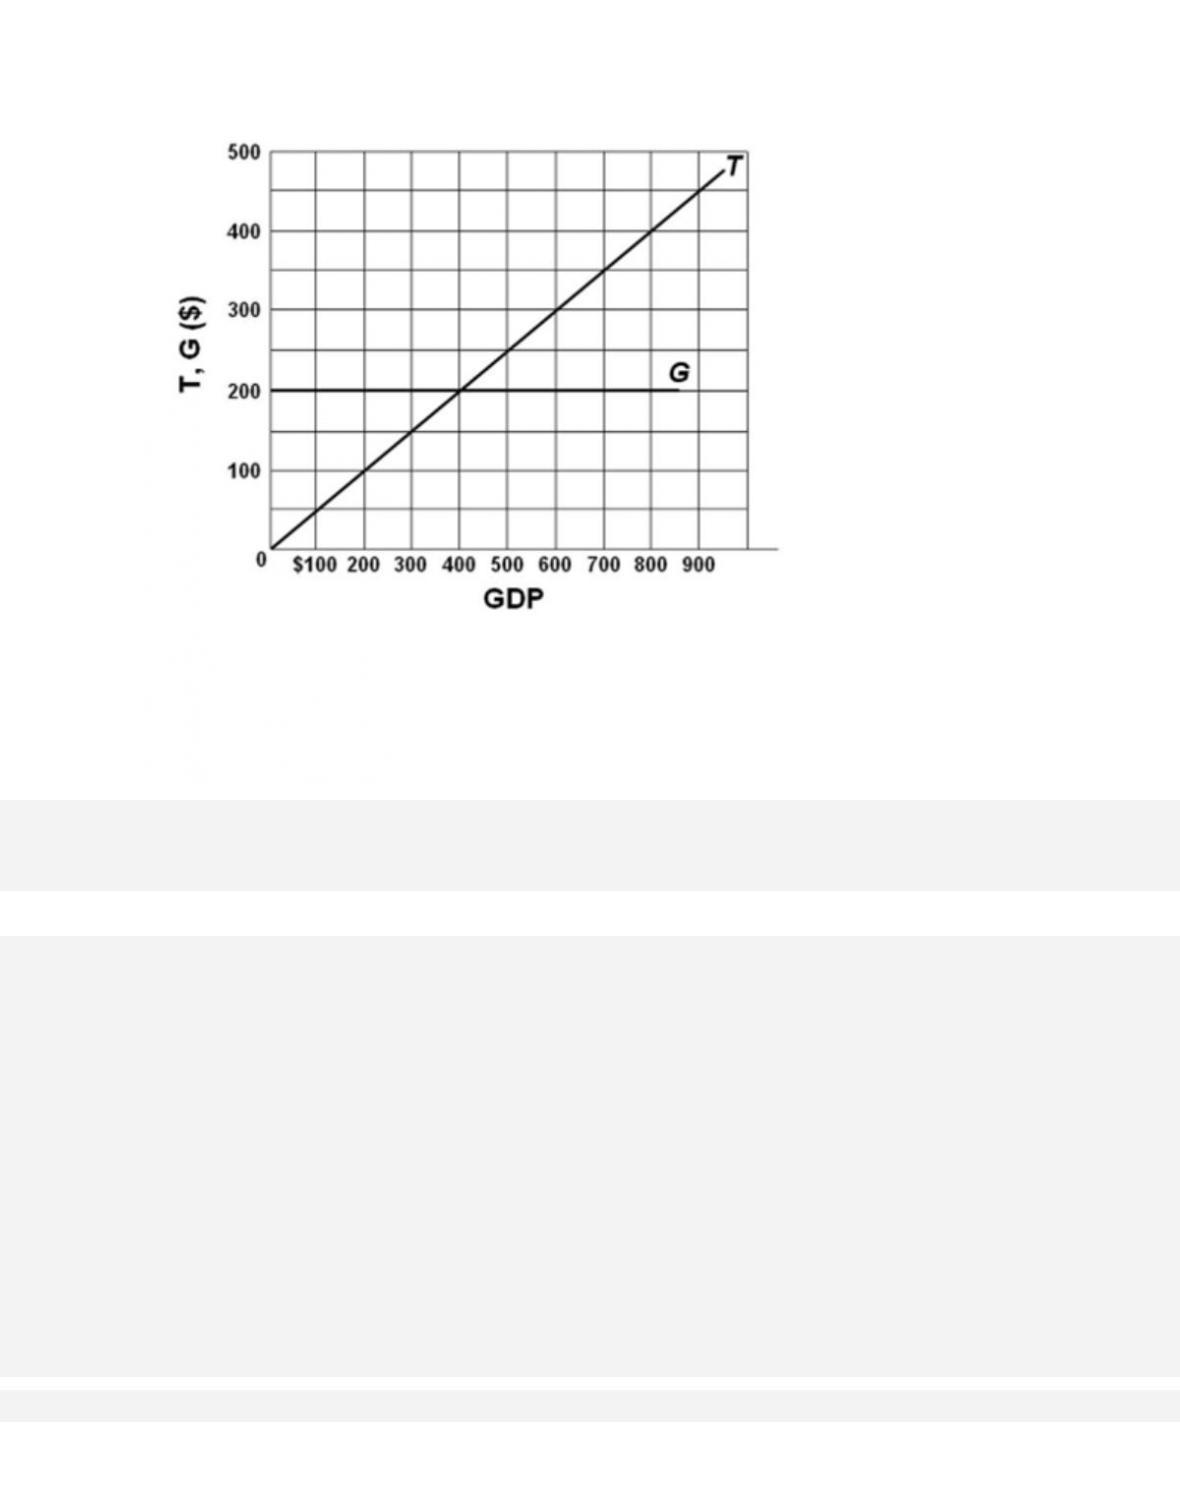
59.
Refer to the diagram, in which T is tax revenues and G is government expenditures. All figures
are in billions. This diagram portrays the idea of

60.
Refer to the diagram, in which T is tax revenues and G is government expenditures. All figures
are in billions. The equilibrium level of GDP in this economy

61.
Refer to the diagram, in which T is tax revenues and G is government expenditures. All figures
are in billions. If GDP is $400,

62.
Refer to the diagram, in which T is tax revenues and G is government expenditures. All figures
are in billions. The budget will entail a deficit