Diffic ult y: 02 Medium
264.
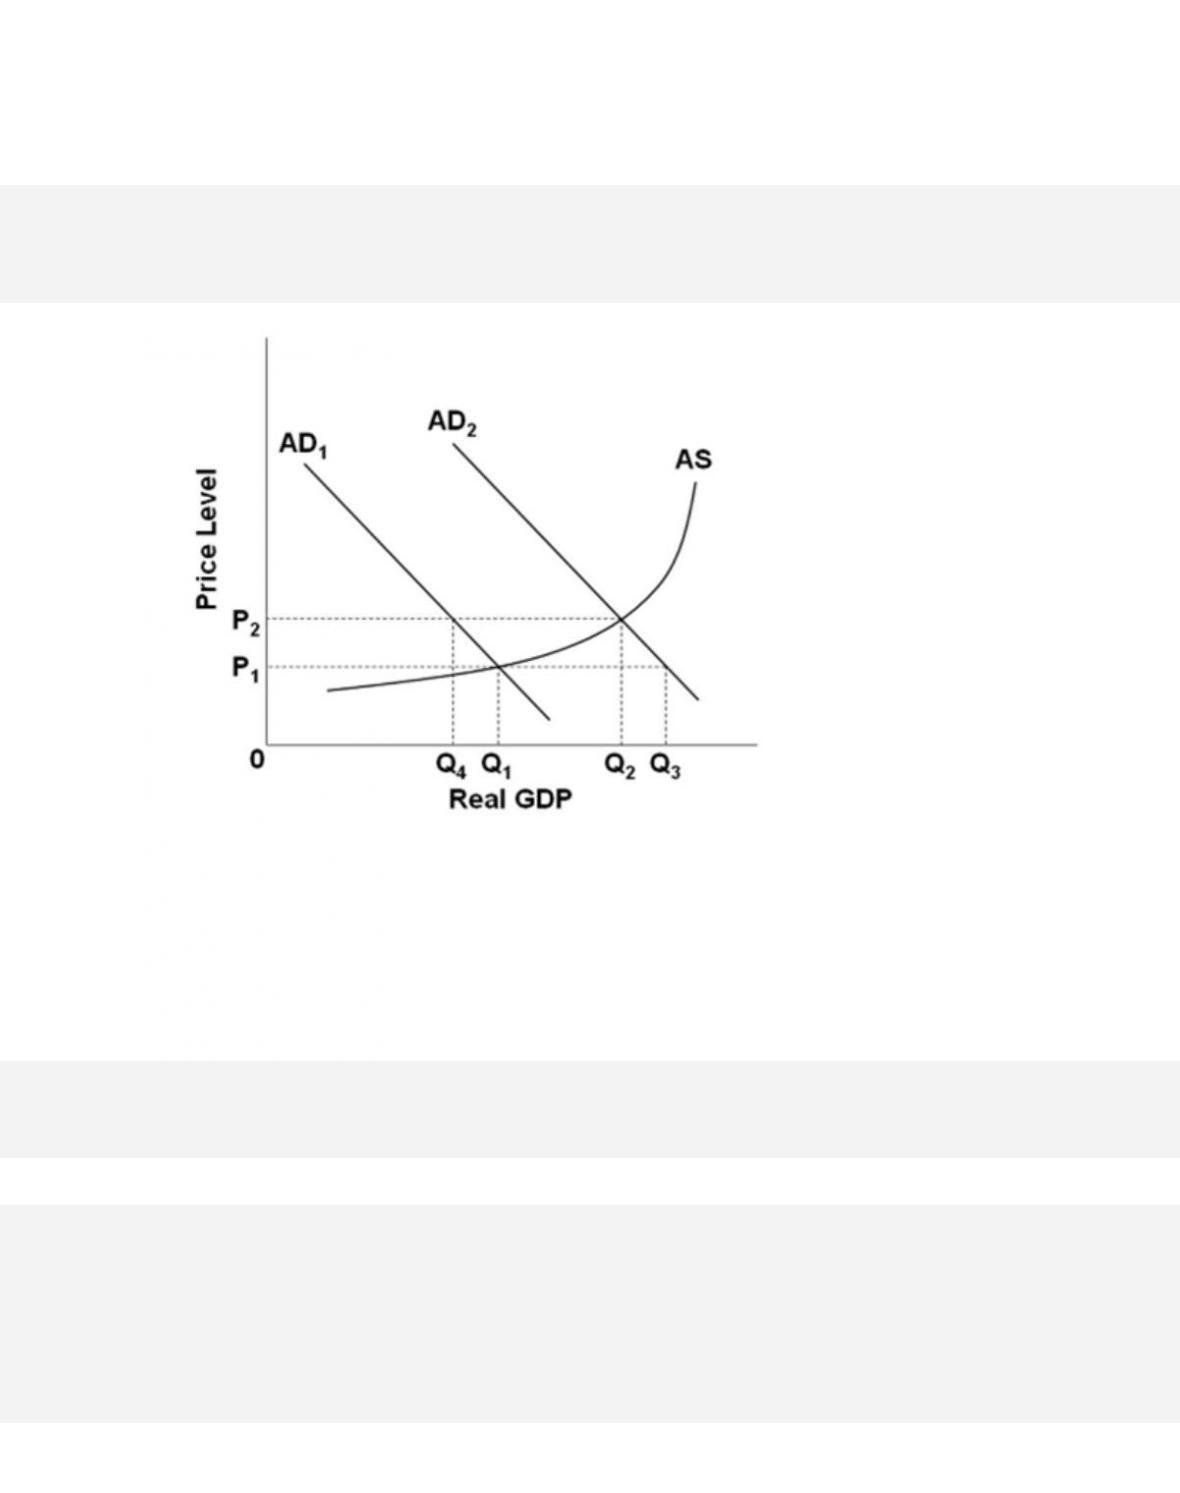
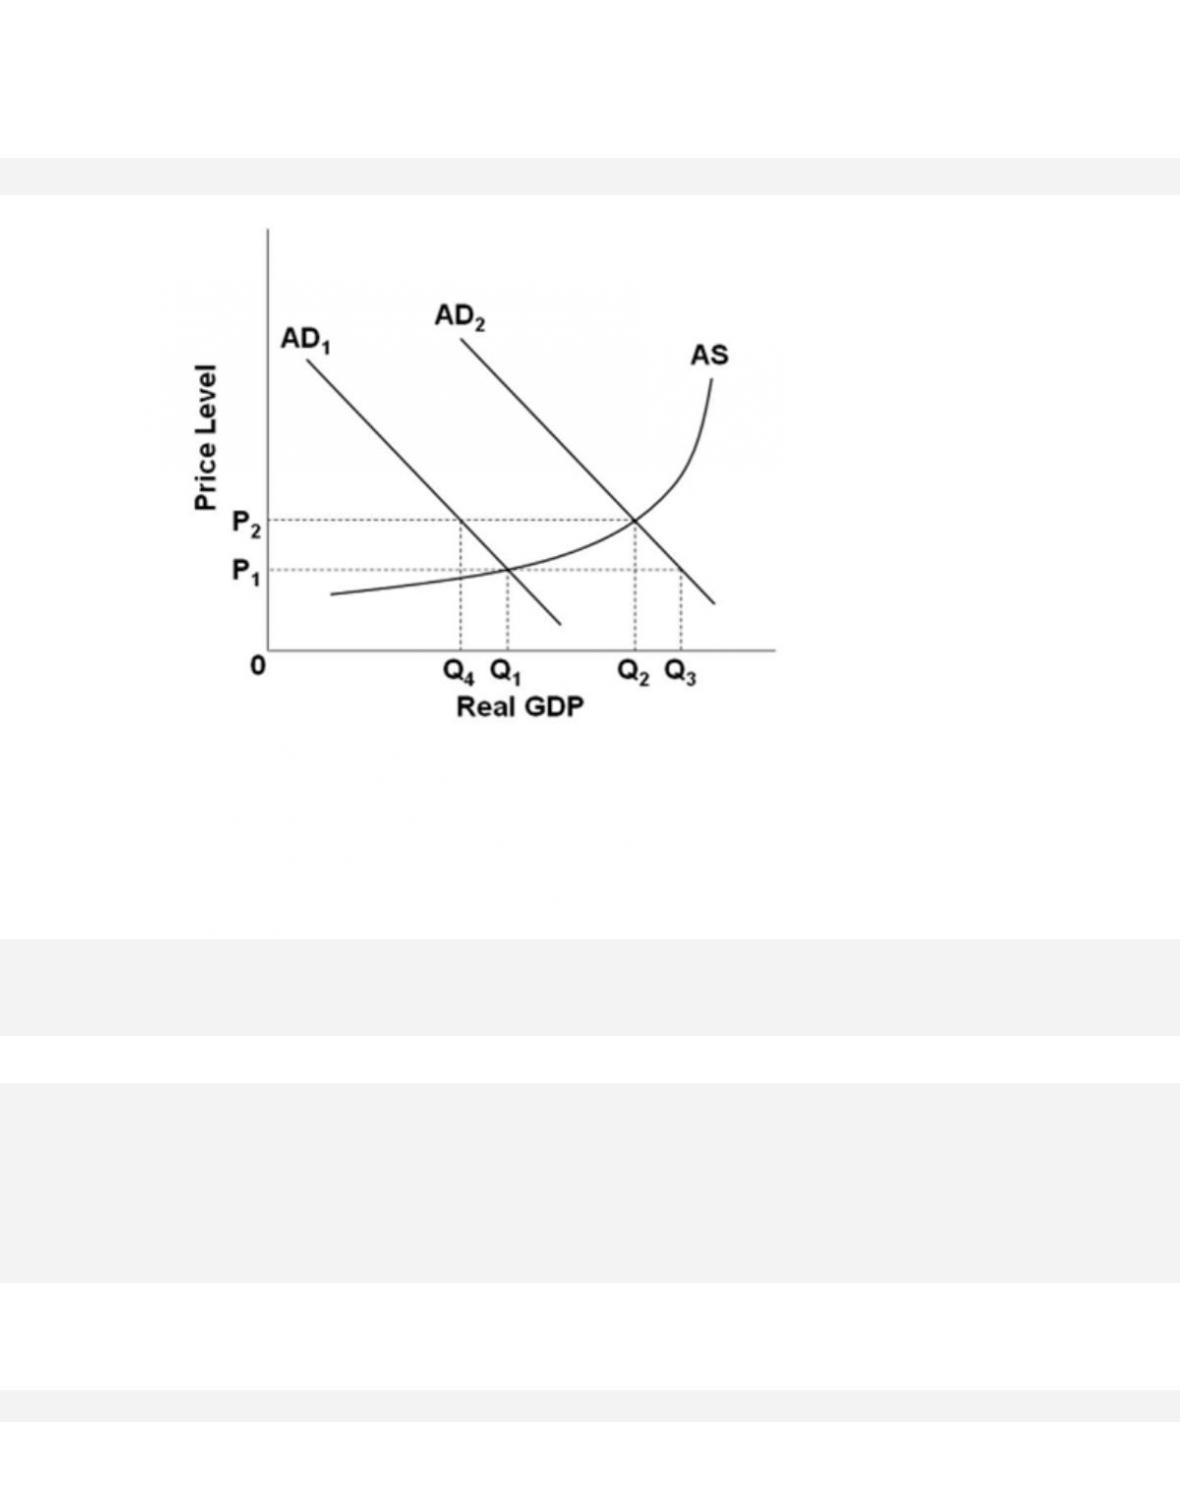
Refer to the accompanying figure. The massive increase in government spending during
World War II moved the economy in the span of a few short years from mass unemployment
and price stability to “overfull” employment. This situation can be best illustrated in the
figure as a
32-142
Copyright © 2018 McGraw-Hill Education. All rights reserved. No reproduction or distribution without the prior
written consent of McGraw-Hill Education.
Topic: Changes in Equilibrium
Type: Graph
265.
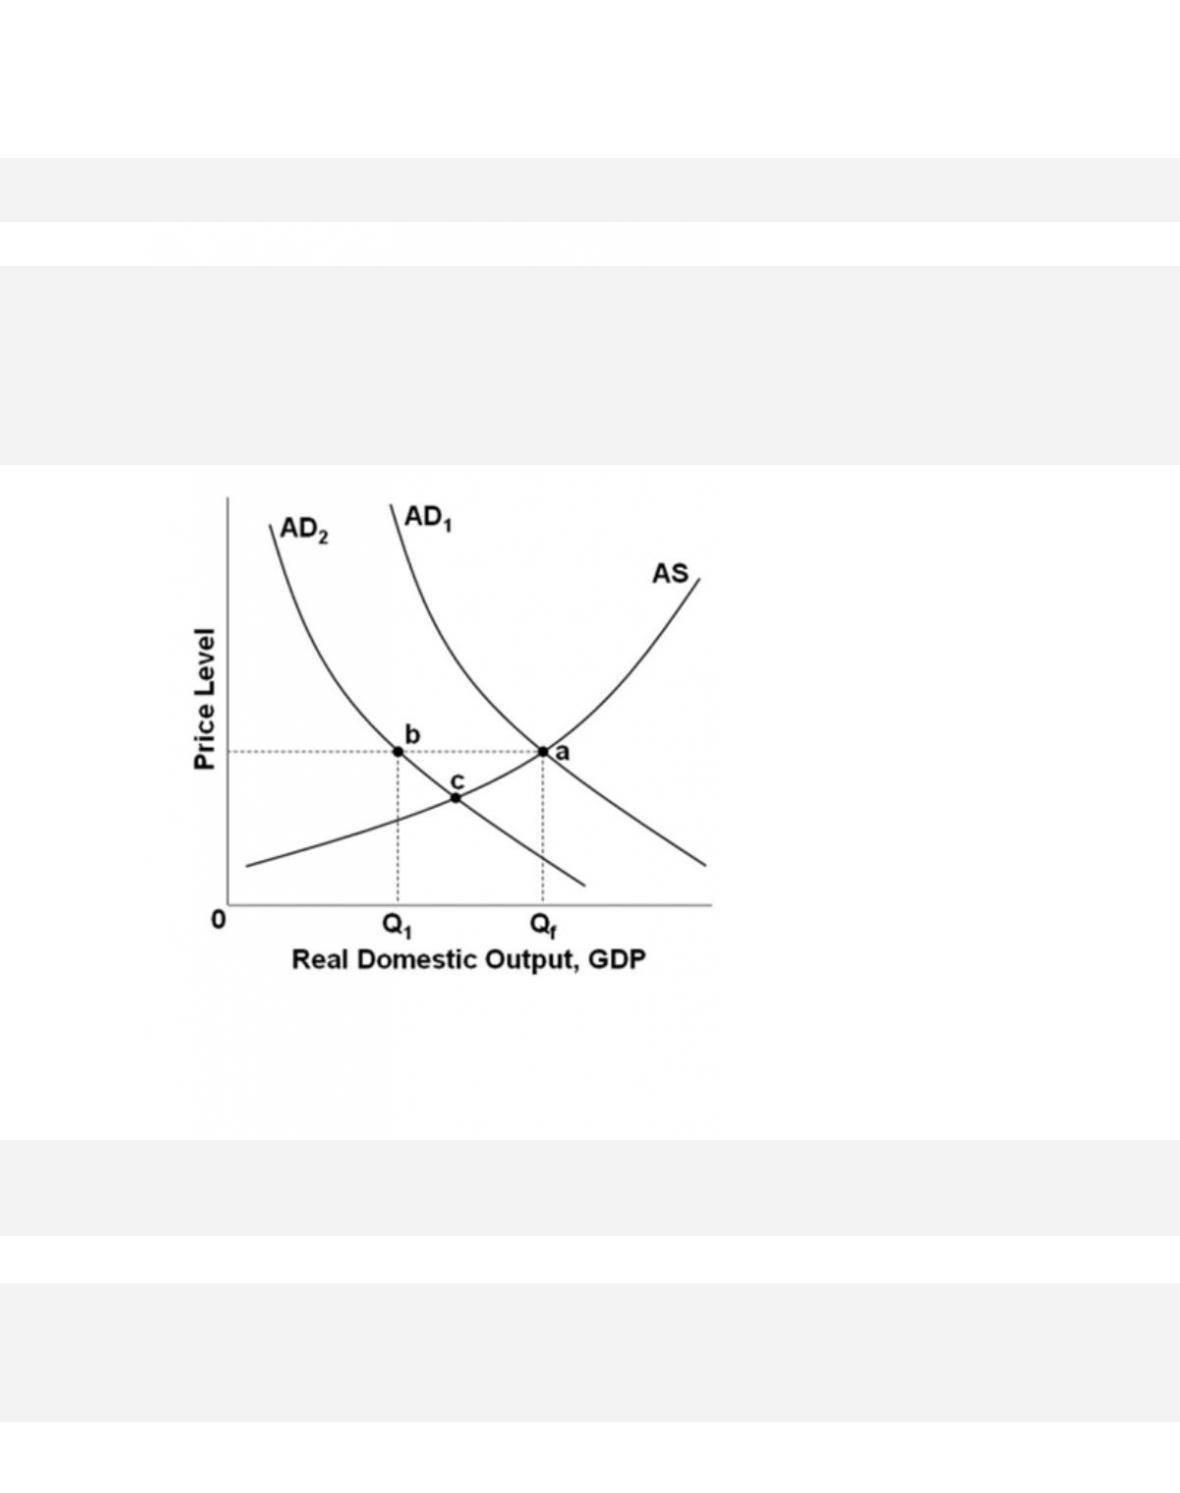
Refer to the figure. If the economy is operating at full employment when its aggregate
demand curve is AD2, then a further increase in consumption and investment spending will
cause
266.
A decrease in aggregate supply means

267.
Cost-push inflation is characterized by a(n)
268.
With cost-push inflation in the short run, there will be

32-144
Copyright © 2018 McGraw-Hill Education. All rights reserved. No reproduction or distribution without the prior
written consent of McGraw-Hill Education.
Test Bank: II
Topic: Changes in Equilibrium
269.
The economy experiences an increase in the price level and a decrease in real domestic
output. Which of the following is a likely explanation?
270.
The economy experiences an increase in the price level and an increase in real
domestic output. Which is a likely explanation?
271.
The economy experiences a decrease in the price level and an increase in real domestic
output. Which is a likely explanation?
272.
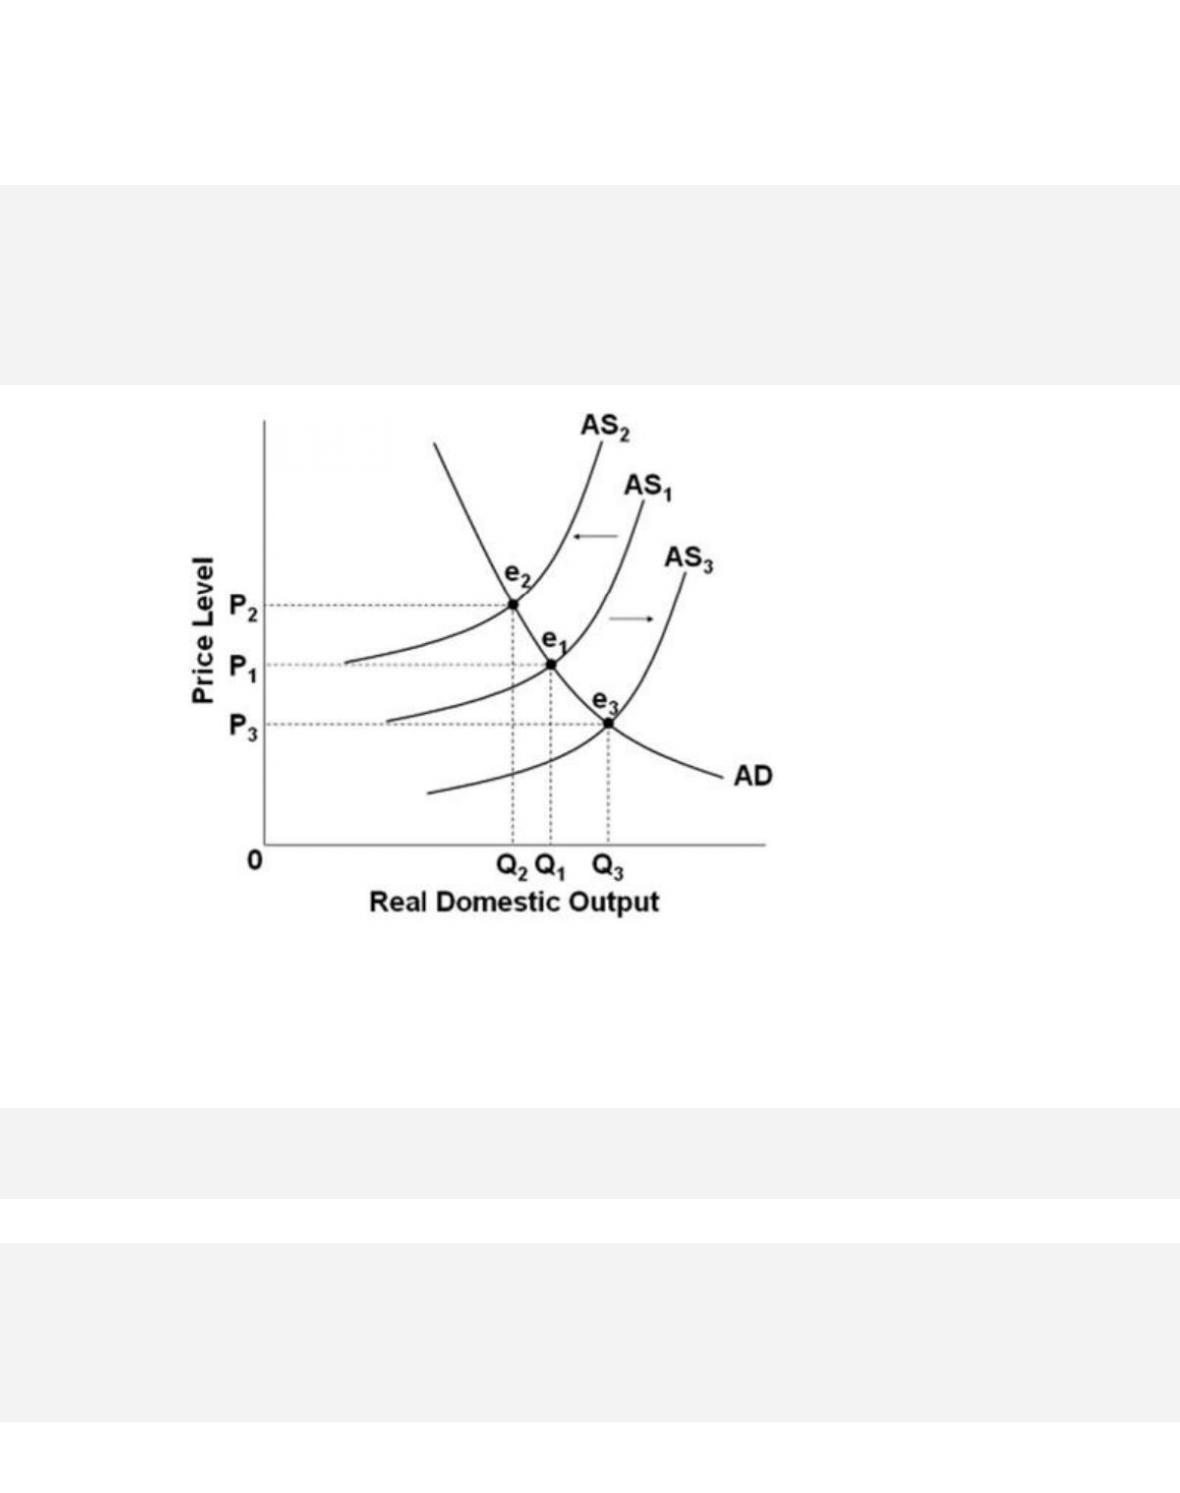
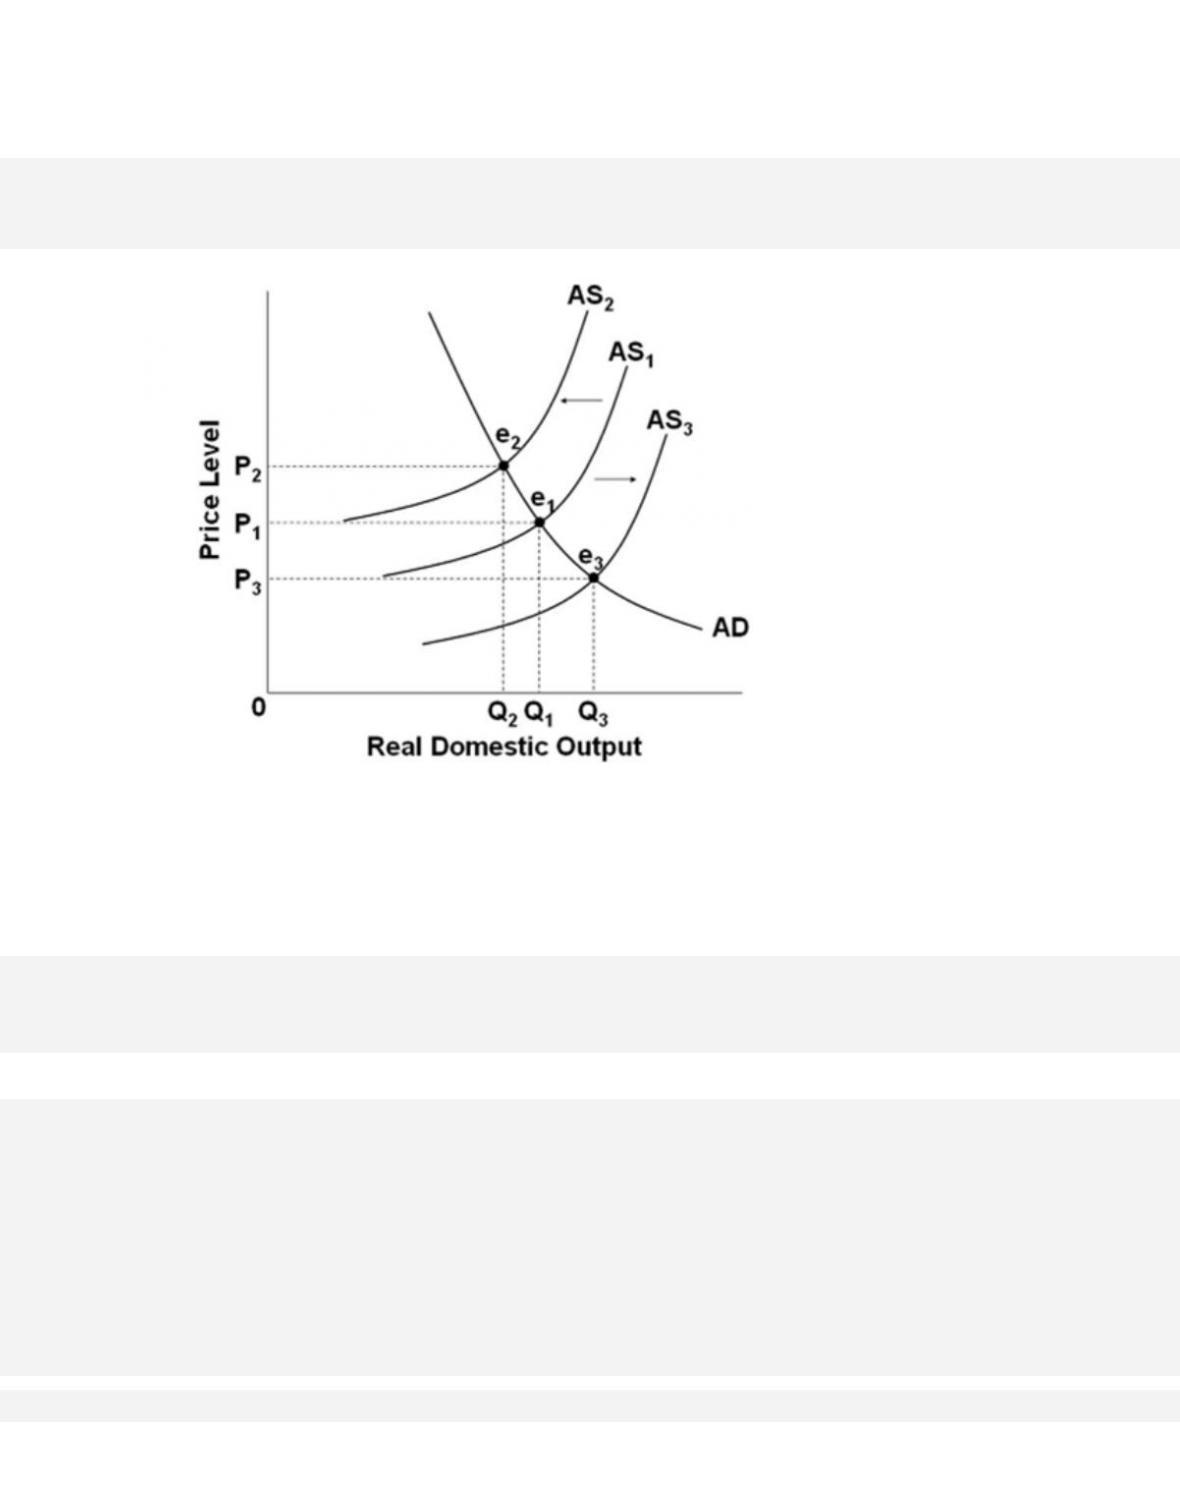
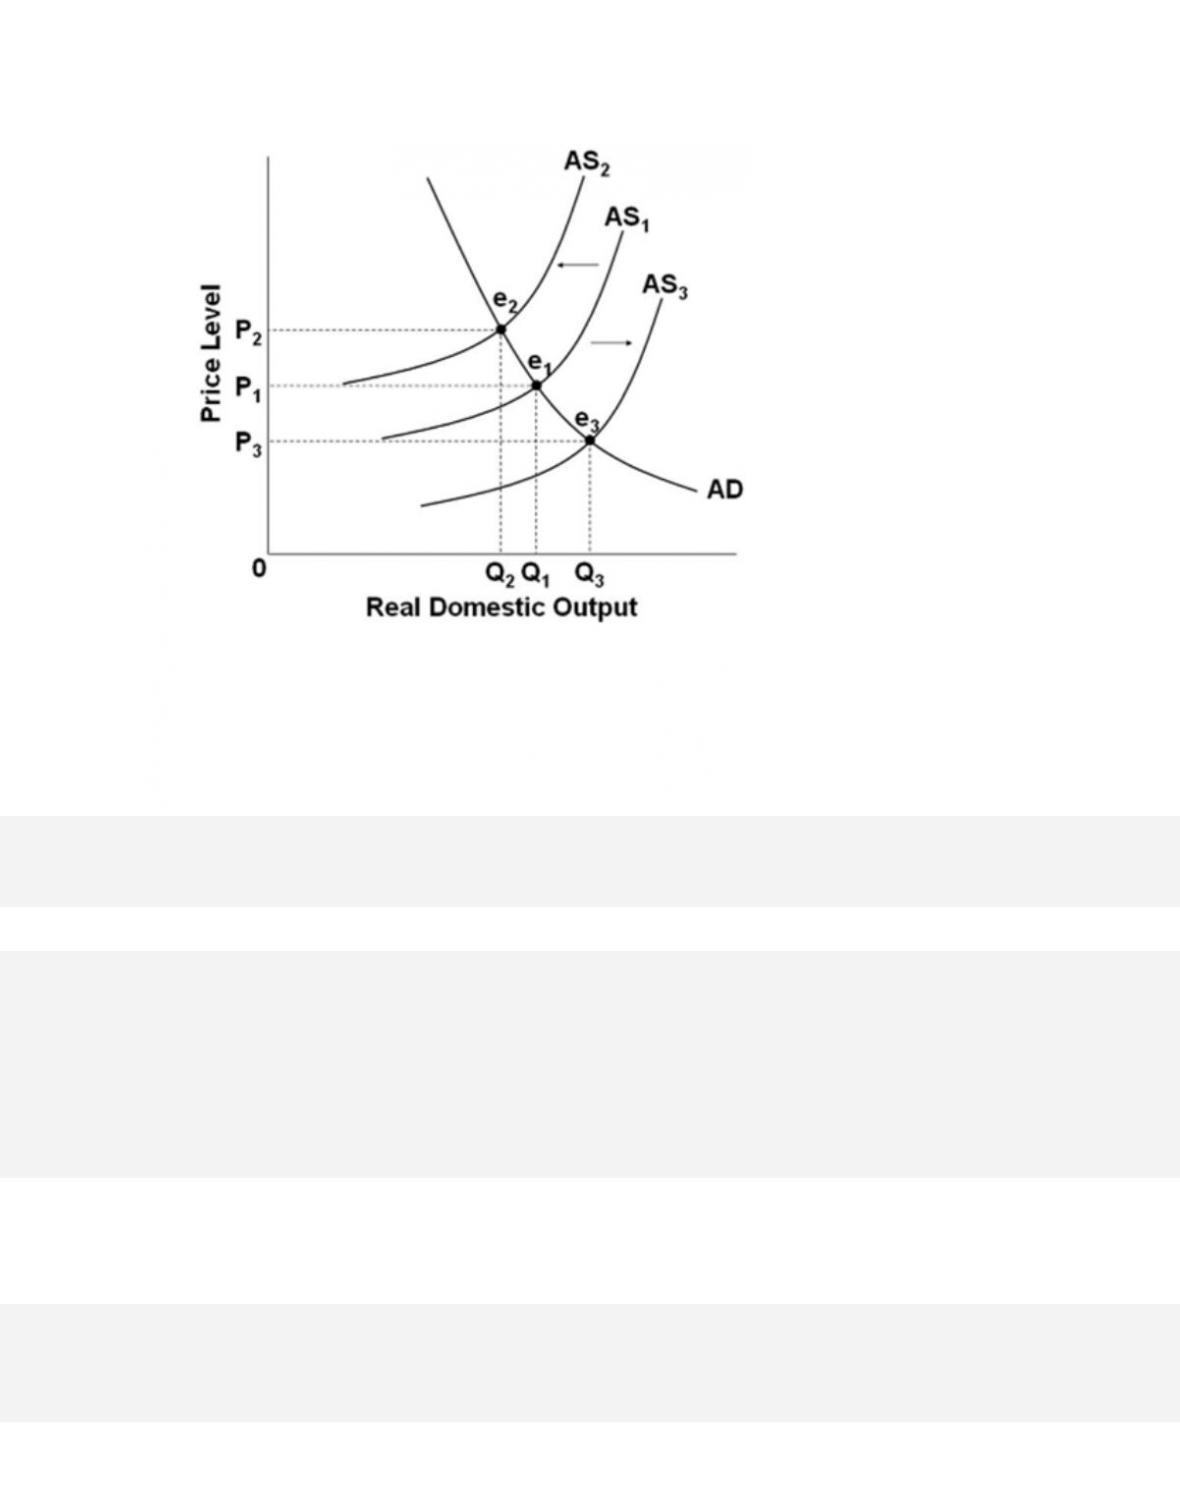
Refer to the graph. If aggregate supply shifts from AS1 to AS2, then the price level will
32-146
Copyright © 2018 McGraw-Hill Education. All rights reserved. No reproduction or distribution without the prior
written consent of McGraw-Hill Education.
pull inflation, cost-push inflation, and recession.
Test Bank: II
Topic: Changes in Equilibrium
Type: Graph
273.
Refer to the graph. When output increases from Q1 and the price level decreases from P1,
this change will
274.
Refer to the graph. A shift from AS1 to AS2 would be consistent with what economic event
in U.S. history?
275.
The U.S. economy was able to achieve full employment with relative price level
stability between 1996 and 2000 because

32-148
Copyright © 2018 McGraw-Hill Education. All rights reserved. No reproduction or distribution without the prior
written consent of McGraw-Hill Education.
C.
aggregate demand increased and aggregate supply increased.
D. aggregate demand decreased and aggregate supply increased.
276.
Deflation refers to a situation where
277.
Disinflation refers to a situation where
278.
Aggregate demand decreases and real output falls but the price level remains the same.
Which of the following factors most likely contributes to downward price inflexibility in the
immediate short run?
279.
Collective bargaining agreements that prohibit wage cuts for the duration of the
contract contribute to
280.
Menu costs will

32-150
Copyright © 2018 McGraw-Hill Education. All rights reserved. No reproduction or distribution without the prior
written consent of McGraw-Hill Education.
Blooms: Understand
Diffic ult y: 02 Medium
Learning Objective: 32-06 Describe how the AD-AS model explains periods of demand-
pull inflation, cost-push inflation, and recession.
Test Bank: II
Topic: Changes in Equilibrium
281.
Wage contracts, efficiency wages, and the minimum wage are explanations for why
282.
In the mid-1970s, changes in oil prices greatly affected U.S. inflation. When oil prices
rose, the U.S. experienced
283.
The so-called ratchet effect refers to the characteristic in the economy where product
prices, wages, and per-unit production cost are flexible when
32-151
Copyright © 2018 McGraw-Hill Education. All rights reserved. No reproduction or distribution without the prior
written consent of McGraw-Hill Education.
B.
AD increases but not when AD decreases.
C.
AS increases but not when AS decreases.
D.
AD shifts but not when AS shifts.
284.
Refer to the graph. The ratchet effect would suggest that

32-152
Copyright © 2018 McGraw-Hill Education. All rights reserved. No reproduction or distribution without the prior
written consent of McGraw-Hill Education.
Learning Objective: 32-06 Describe how the AD-AS model explains periods of demand-
pull inflation, cost-push inflation, and recession.
Test Bank: II
Topic: Changes in Equilibrium
Type: Graph
285.
Government actions that were taken in order to stimulate the economy during the Great
Recession of 2007–09 included the following, except
286.
Which of the following is not a reason why the stimulus package that the government
implemented during the Great Recession of 2007–09 did not have as strong an impact on
GDP
and unemployment as expected?
True / False Questions
287.
The aggregate demand curve shows that when the price level rises, the quantity of real