32-121
Copyright © 2018 McGraw-Hill Education. All rights reserved. No reproduction or distribution without the prior
written consent of McGraw-Hill Education.
Learning Objective: 32-04 Explain the factors that cause changes shifts in AS.
Test Bank: II
Topic: Changes in Aggregate Supply
230.
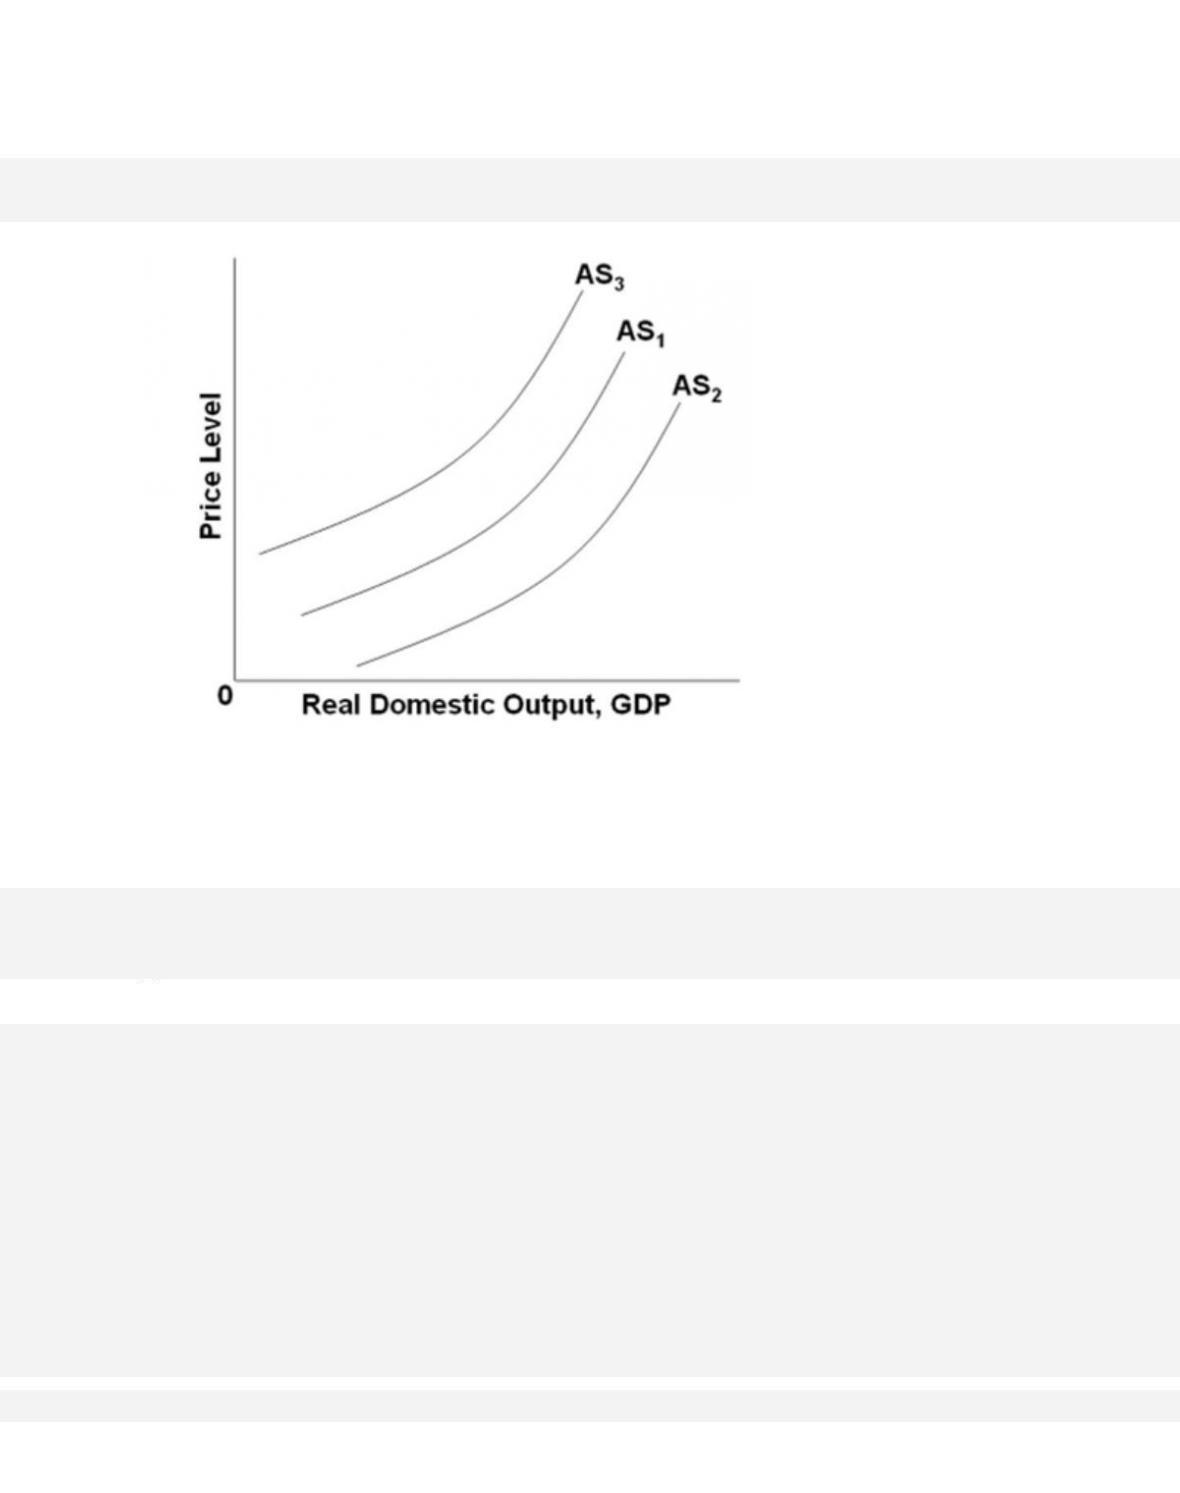
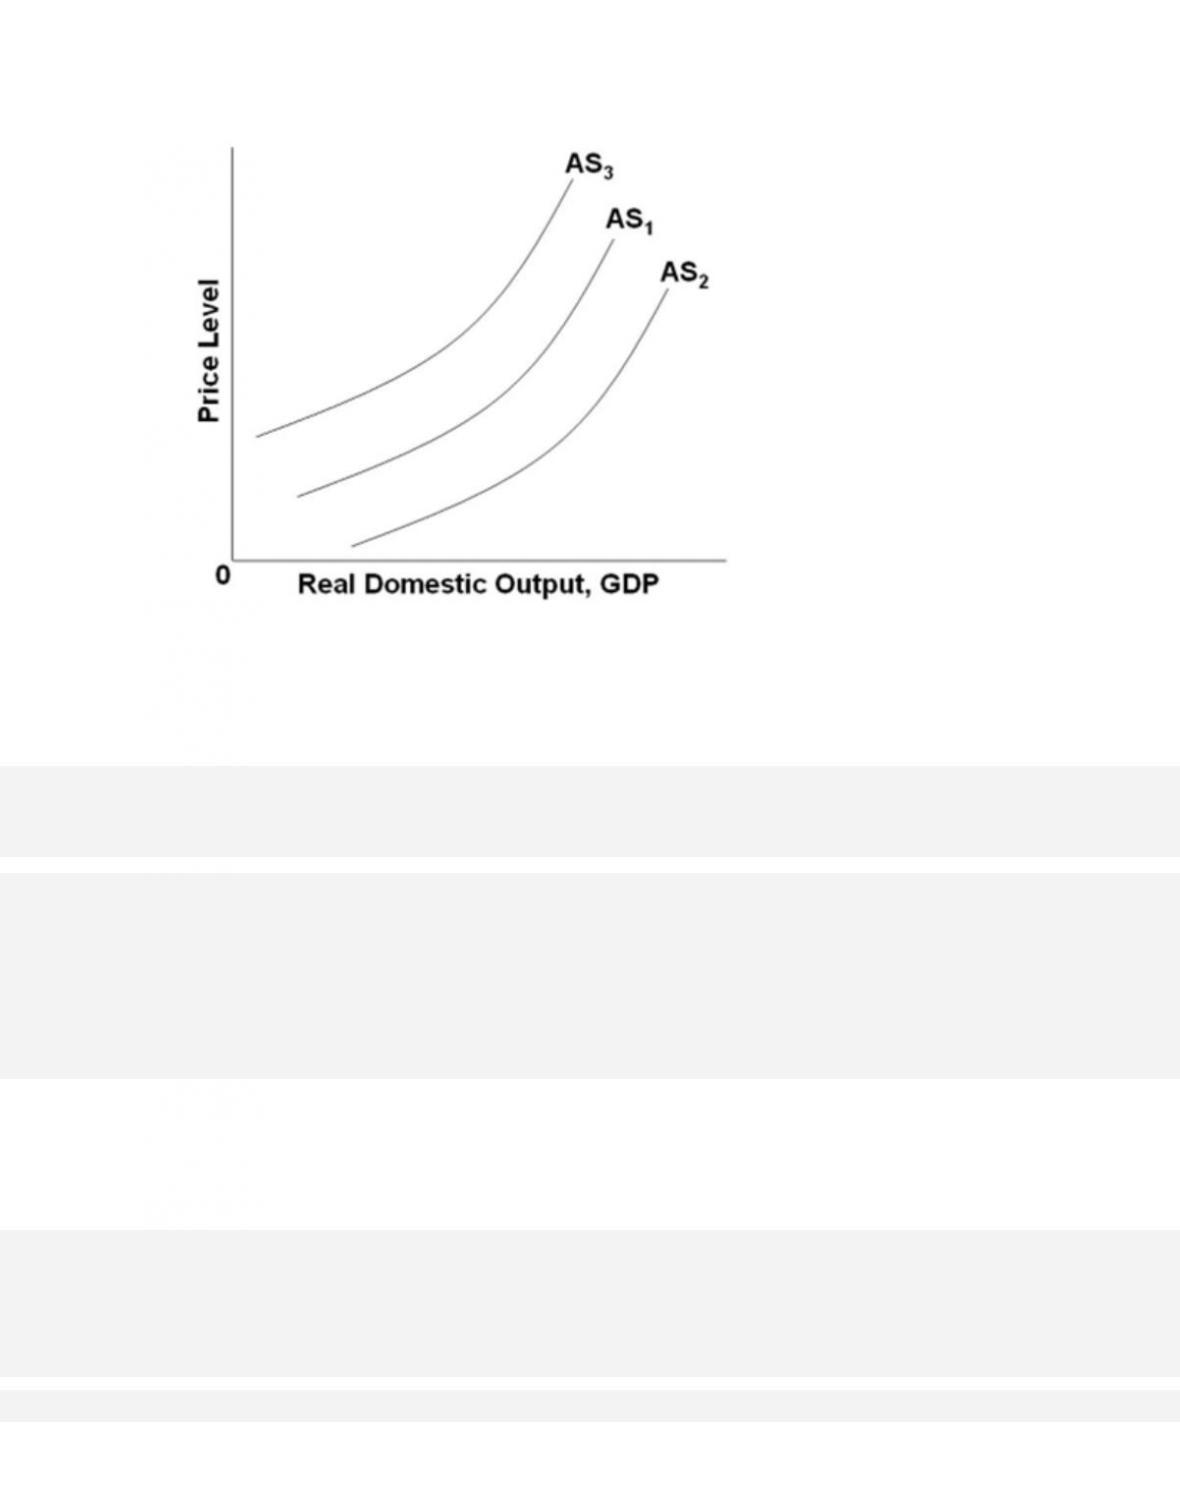
In the accompanying graph, which of the following factors will shift AS1 to AS2?
231.
In the accompanying graph, which of the following factors will shift AS1 to AS3?
232.
Suppose that an economy produces 500 units of output. It takes 10 units of labor at $15
a unit and 4 units of capital at $50 a unit to produce this amount of output. The per unit cost
of production is

32-123
Copyright © 2018 McGraw-Hill Education. All rights reserved. No reproduction or distribution without the prior
written consent of McGraw-Hill Education.
AACSB: Knowledge Application
Accessibility: Keyboard Navigation
Blooms: Understand
Dif fic ult y: 02 Medium
Learning Objective: 32-04 Explain the factors that cause changes shifts in AS.
Test Bank: II
Topic: Changes in Aggregate Supply
233.
In an economy, it costs $1,500 to produce 2,000 units of output. If the costs increase to
$2,500, then the per unit cost of production will have increased from
234.
Suppose that an economy produces 300 units of output, employing 50 units of input,
and the price of the input is $9 per unit. The level of productivity and the per-unit cost of
production are
235.
Suppose that an economy produces 2,400 units of output, employing 60 units of input,
and the price of the input is $30 per unit. The level of productivity in this economy is

32-124
Copyright © 2018 McGraw-Hill Education. All rights reserved. No reproduction or distribution without the prior
written consent of McGraw-Hill Education.
A. 20.
B. 30.
C.
40.
D. 50.
236.
Suppose that an economy produces 2,400 units of output, employing 60 units of input,
and the price of the input is $30 per unit. The per-unit cost of production is
237.
Suppose that an economy produces 2,400 units of output, employing 60 units of input,
and the price of the input is $30 per unit. If productivity increased such that 3,000 units are
now produced with the quantity of inputs still equal to 60, then per-unit production costs
would

32-125
Copyright © 2018 McGraw-Hill Education. All rights reserved. No reproduction or distribution without the prior
written consent of McGraw-Hill Education.
Test Bank: II
Topic: Changes in Aggregate Supply
238.
Suppose that an economy produces 2,400 units of output, employing the 60 units of
input, and the price of the input is $30 per unit. All else equal, if the price of each unit of
input
decreased from $30 to $20, then productivity would
239.
If Congress passed new laws significantly increasing the regulation of business, this
action would tend to
240.
A decrease in business taxes will tend to

32-126
Copyright © 2018 McGraw-Hill Education. All rights reserved. No reproduction or distribution without the prior
written consent of McGraw-Hill Education.
Accessibility: Keyboard Navigation
Blooms: Understand
Dif fic ult y: 02 Medium
Learning Objective: 32-04 Explain the factors that cause changes shifts in AS.
Test Bank: II
Topic: Changes in Aggregate Supply
241.
A change in which one of the following factors would shift the aggregate supply curve
in the short run?
242.
If the U.S. dollar appreciates in value relative to foreign currencies, then this will
243.
If personal income taxes and business taxes increase, then this will

244.
1.
Government Spending
2.
Consumer Expectations
3.
Degree of Excess Capacity
4.
Personal Income Tax Rates
5.
Productivity
6.
National Income Abroad
7.
Business Taxes
8.
Domestic Resource Availability
9.
Prices of Imported Products
10.
Profit Expectations on Investments
Answer the question based on the accompanying list of items related to aggregate demand or
aggregate supply. Changes in which combination of factors best explain why the
aggregate
supply curve would shift?
245.
1.
Government Spending
2.
Consumer Expectations
3.
Degree of Excess Capacity
4.
Personal Income Tax Rates
5.
Productivity

6.
National Income Abroad
7.
Business Taxes
8.
Domestic Resource Availability
9.
Prices of Imported Products
10.
Profit Expectations on Investments
Answer the question based on the accompanying list of items related to aggregate demand or
aggregate supply. Changes in which two factors would most likely cause a change in
aggregate demand?
246.
1.
Government Spending
2.
Consumer Expectations
3.
Degree of Excess Capacity
4.
Personal Income Tax Rates
5.
Productivity
6.
National Income Abroad
7.
Business Taxes
8.
Domestic Resource Availability
9.
Prices of Imported Products
10.
Profit Expectations on Investments
Answer the question based on the accompanying list of items related to aggregate demand or
aggregate supply. A change in which factor is most likely to change both aggregate
demand
and aggregate supply?
32-129
Copyright © 2018 McGraw-Hill Education. All rights reserved. No reproduction or distribution without the prior
written consent of McGraw-Hill Education.
C.
7
D. 6
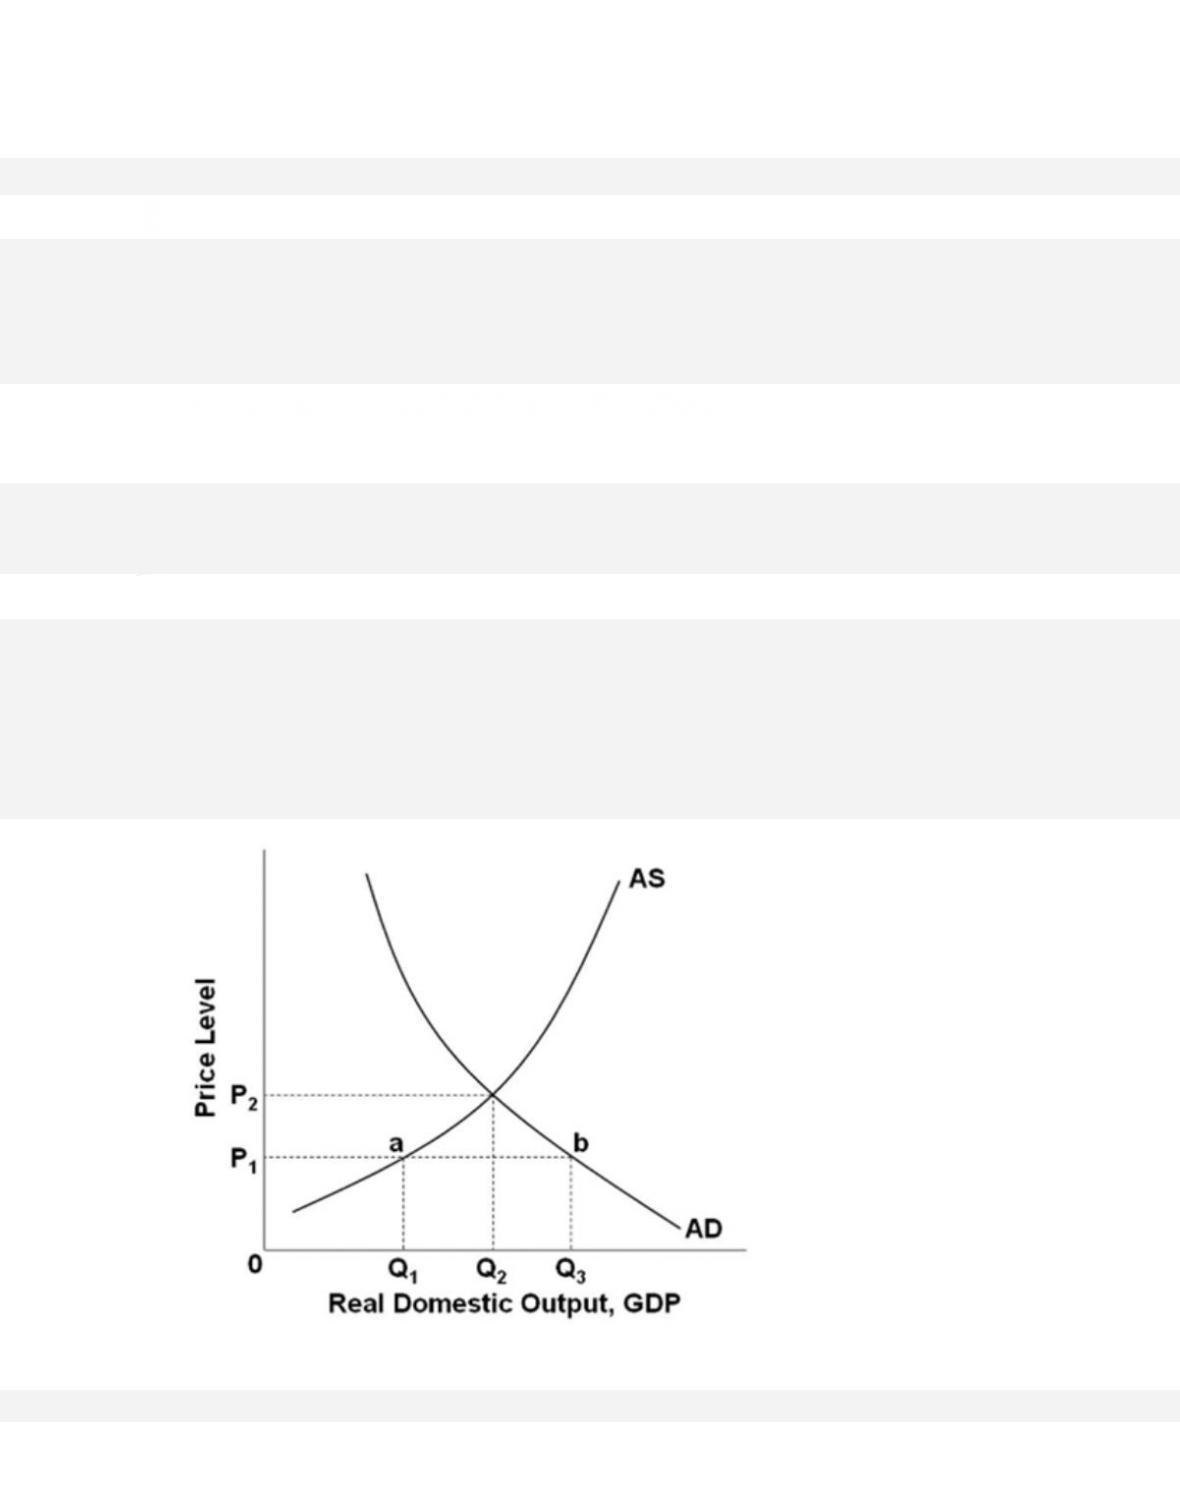
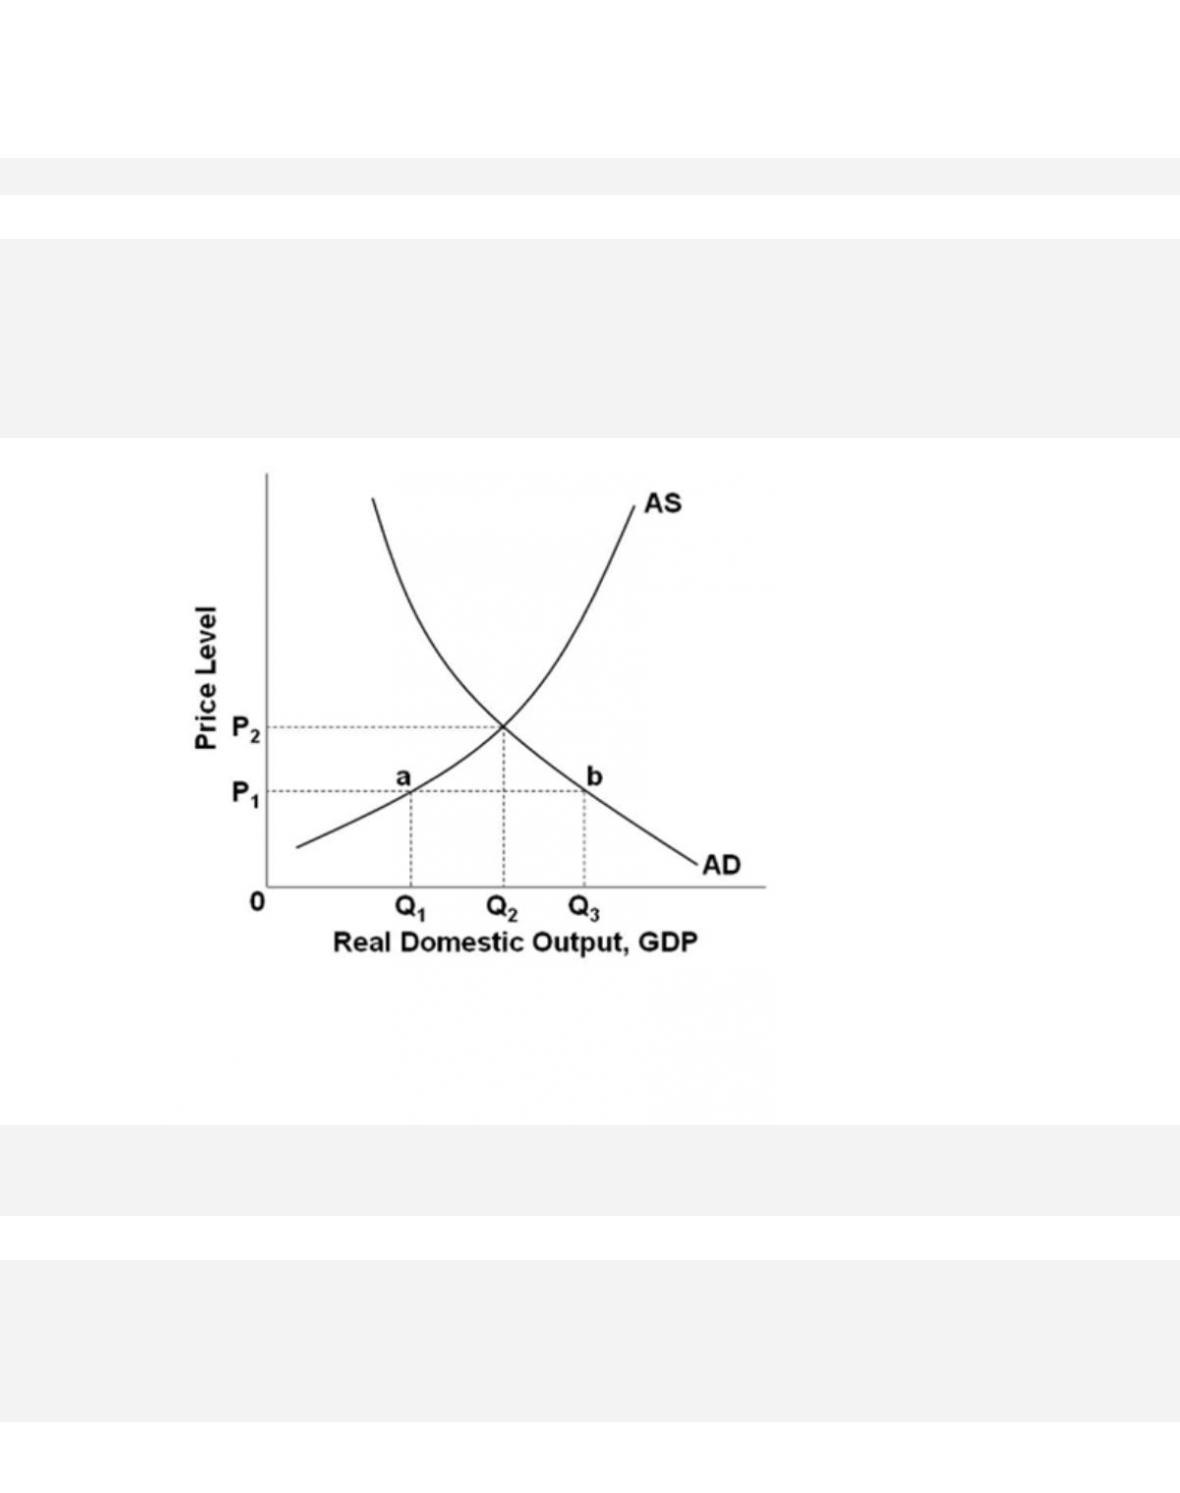
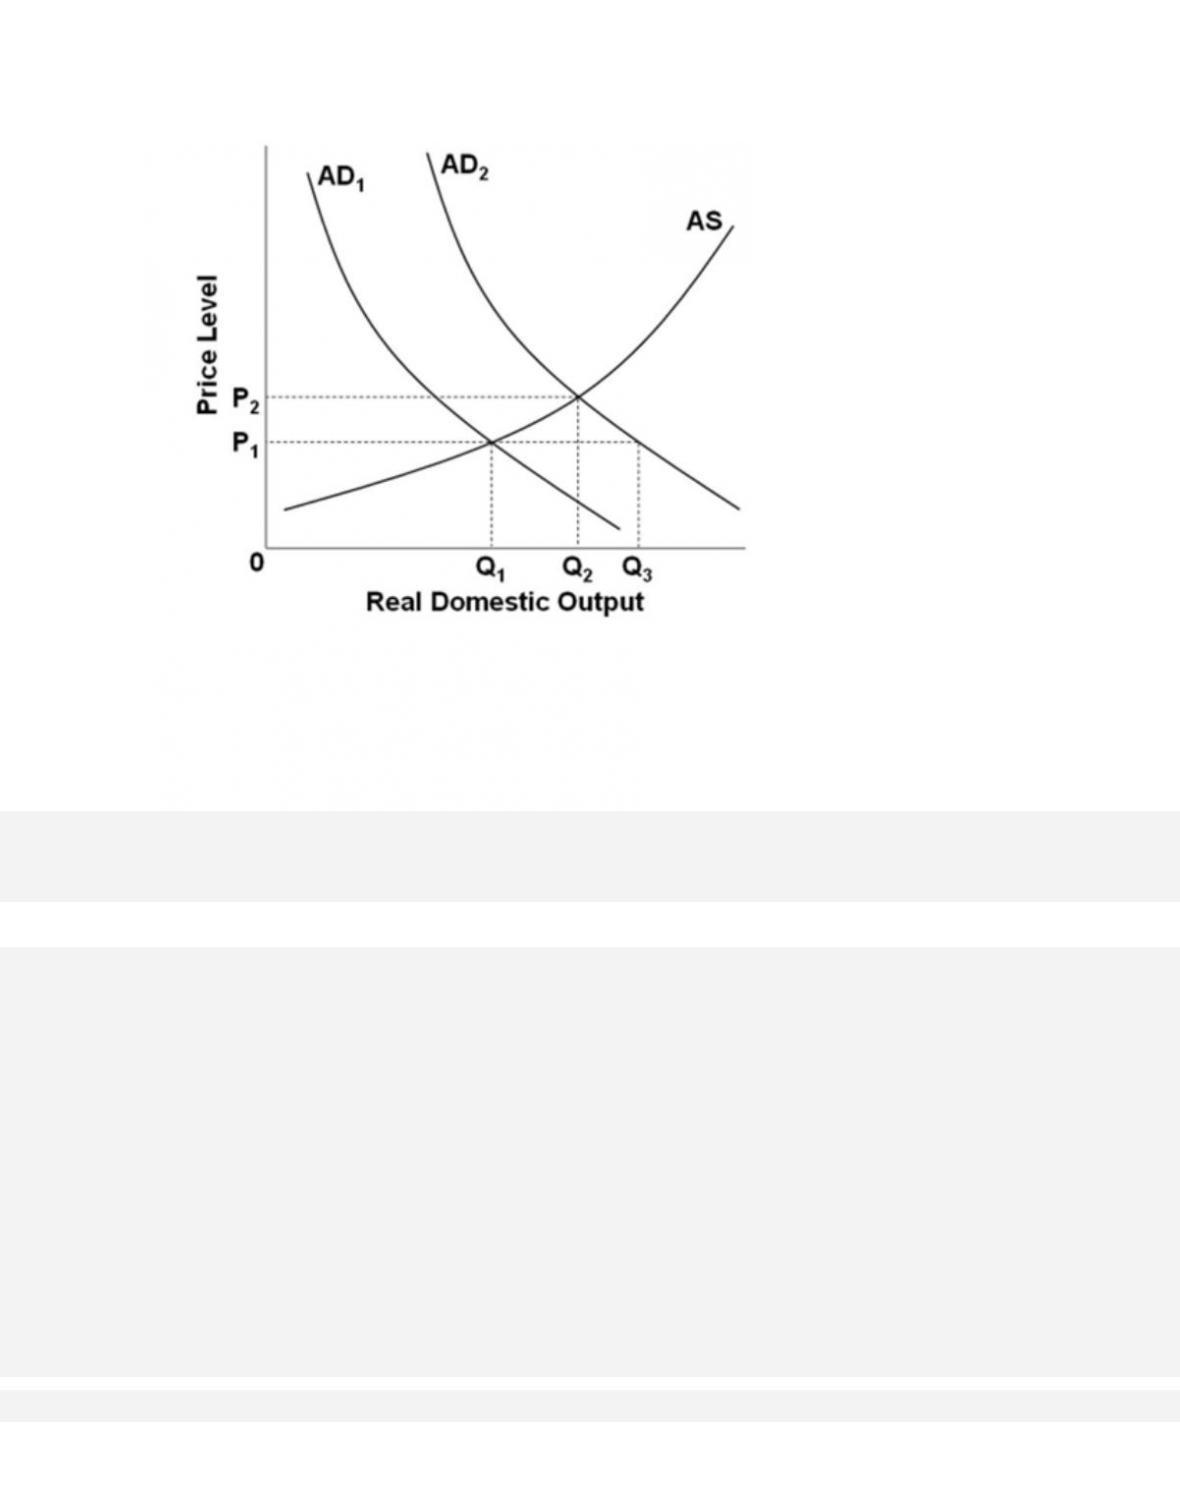
247. The intersection of the aggregate demand and aggregate supply curves determines the
248.
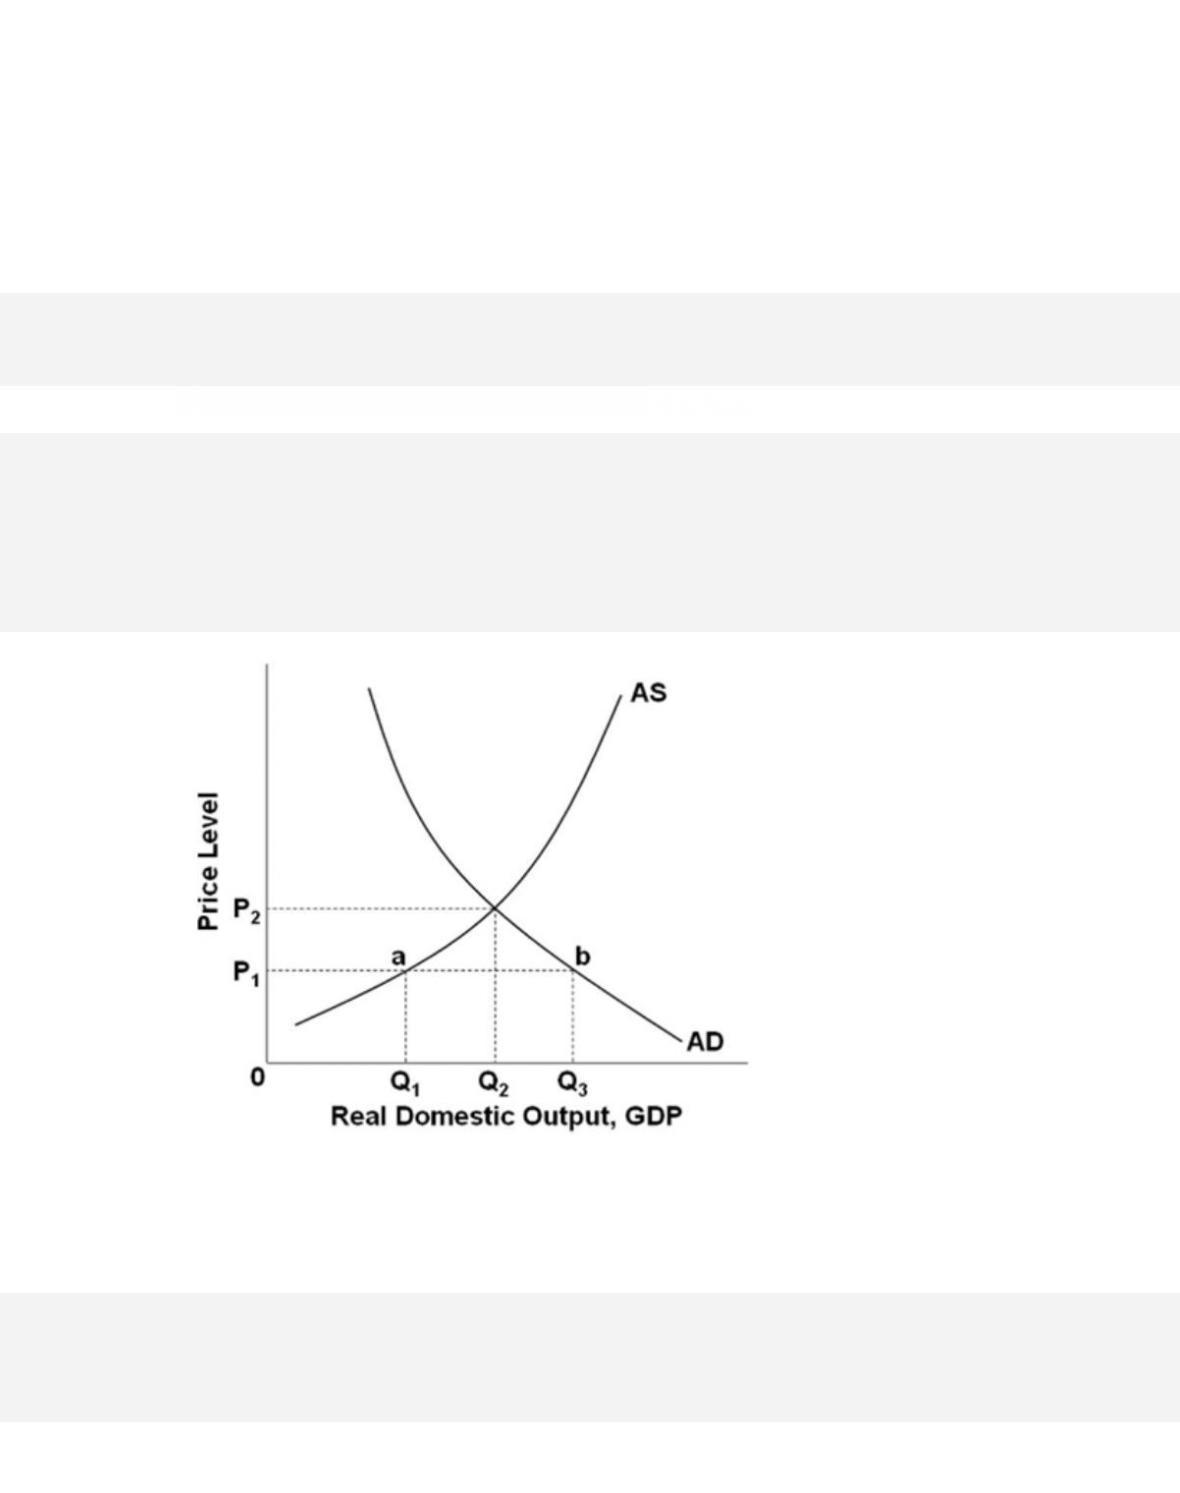
Refer to the graph. The equilibrium for this economy is
249.
The accompanying graph depicts an economy in the
32-131
Copyright © 2018 McGraw-Hill Education. All rights reserved. No reproduction or distribution without the prior
written consent of McGraw-Hill Education.
C.
immediate long run.
D.
long run.
250.
Refer to the graph. If the price level is initially at P1, then the economy will adjust by
32-132
Copyright © 2018 McGraw-Hill Education. All rights reserved. No reproduction or distribution without the prior
written consent of McGraw-Hill Education.
Learning Objective: 32-05 Discuss how AD and AS determine an economys equilibrium
price level and level of real GDP.
Test Bank: II
Topic: Equilibrium in the AD–AS Model
Type: Graph
251. If at a particular price level, real output from producers is greater than real output
desired by purchasers, then there will be a general
252.
Real Domestic Output
Demanded (in Billions)
Price Level
(Index Value)
Real Domestic Output
Supplied (in Billions)
$3,000
350
$9,000
4,000
300
8,000
5,000
250
7,000
6,000
200
6,000
7,000
150
5,000
8,000
100
4,000
The accompanying table shows the aggregate demand and aggregate supply schedules for a
hypothetical economy. The equilibrium price and output levels will be
253.
Real Domestic Output
Demanded (in Billions)
Price Level
(Index Value)
Real Domestic Output
Supplied (in Billions)
$3,000
350
$9,000
4,000
300
8,000
5,000
250
7,000
6,000
200
6,000
7,000
150
5,000
8,000
100
4,000
The accompanying table shows the aggregate demand and aggregate supply schedules for a
hypothetical economy. At the price level of 150, there will be a general
254.
A decrease in aggregate demand in the short run will reduce

32-134
Copyright © 2018 McGraw-Hill Education. All rights reserved. No reproduction or distribution without the prior
written consent of McGraw-Hill Education.
D.
the price level and have no effect on real domestic output.
255.
Demand-pull inflation is illustrated in the short run aggregate supply-aggregate demand
model as a shift of the aggregate
256.
Inflation tends to
257.
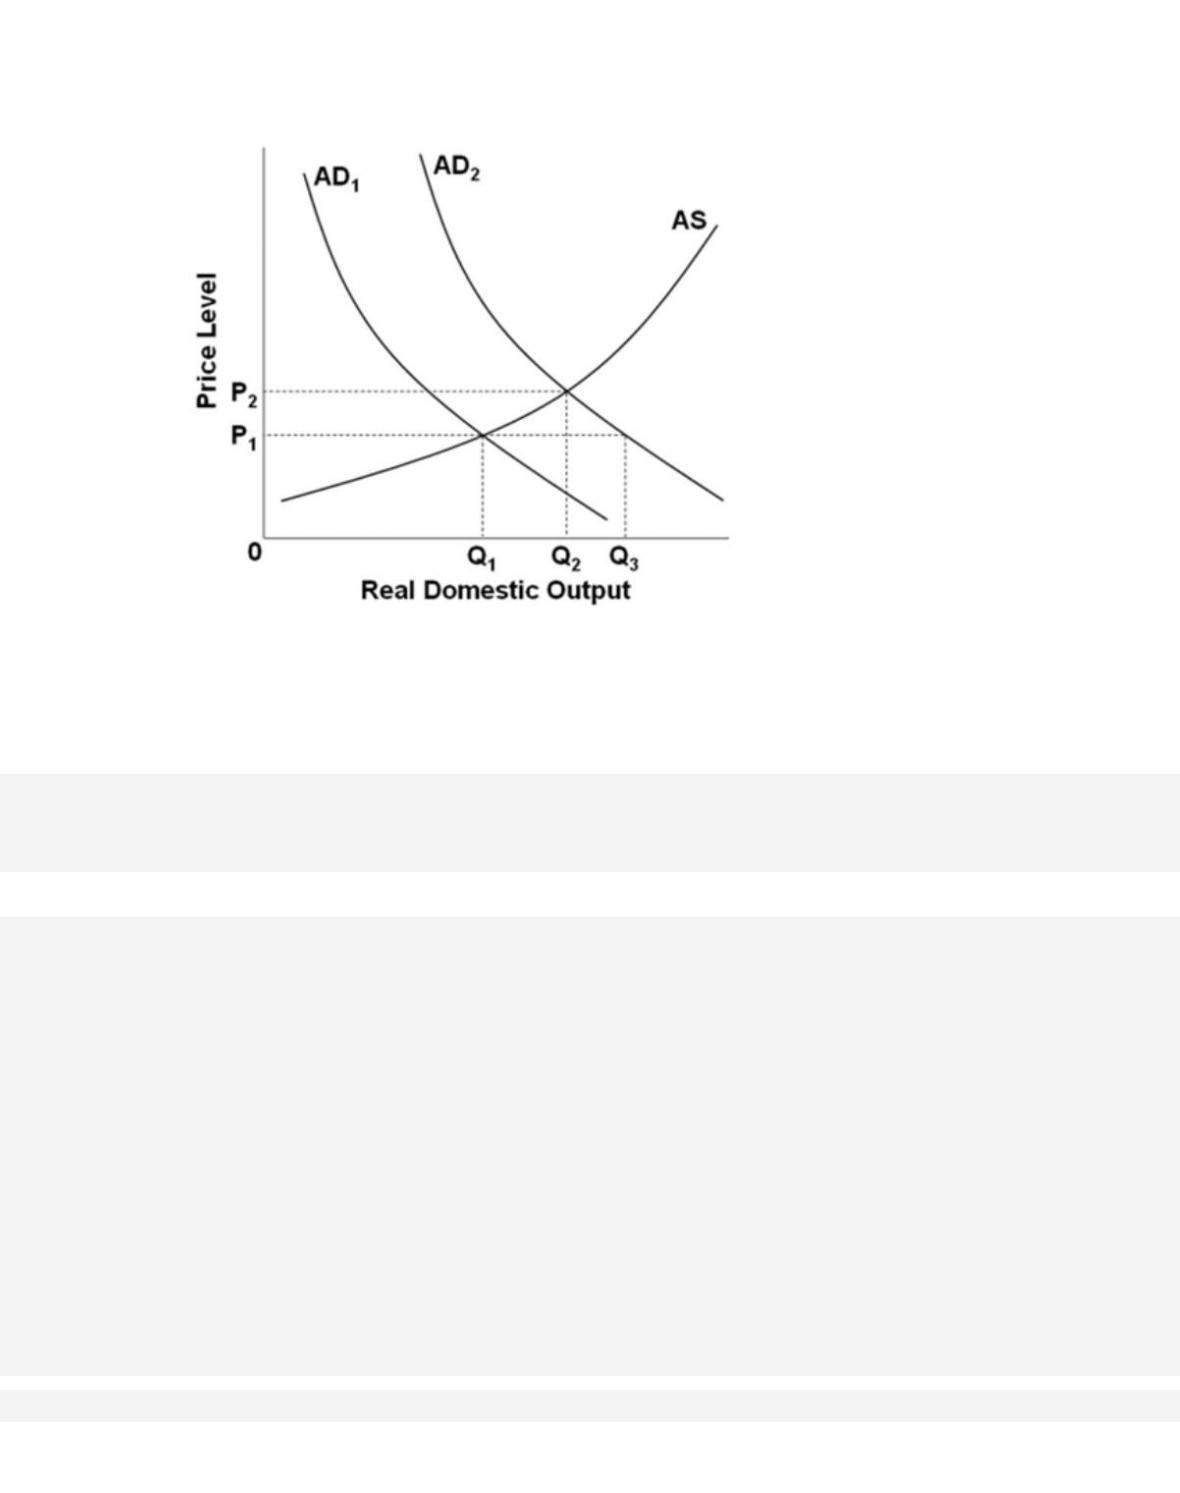
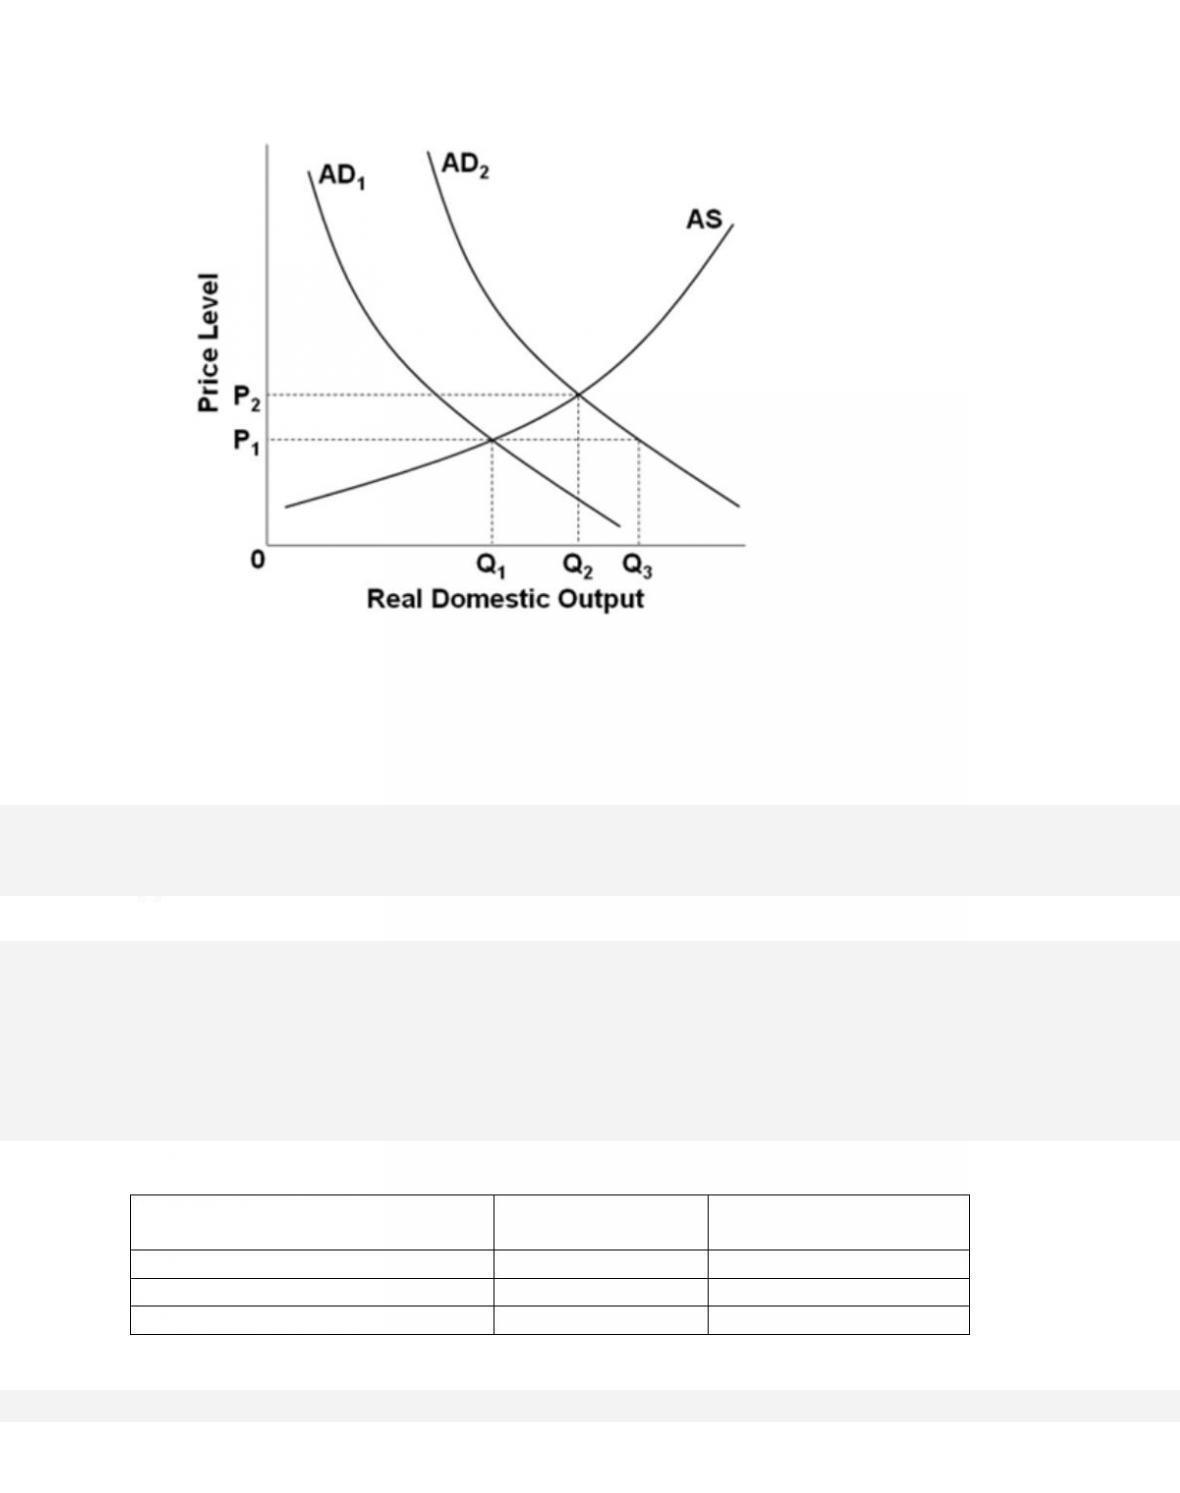
In the accompanying figure, if AD1 shifts to AD2, then the equilibrium output

258.
In the accompanying figure, if AD1 shifts to AD2, the full multiplier effect would be an
increase in real GDP from
259.
In the accompanying figure, a shift from AD1 to AD2 would be consistent with what
economic event in U.S. history?
32-138
260.
In the accompanying figure, a shift from AD2 to AD1 would be consistent with what
economic event in U.S. history?
261.
Real Domestic Output Demanded
(in Billions)
Price Level (Index
Value)
Real Domestic Output
Supplied
$500
350
$3,500
1,000
300
3,000
1,500
250
2,500
32-139
2,000
200
2,000
2,500
150
1,500
3,000
100
1,000
The accompanying table shows the aggregate demand and aggregate supply schedule for a
hypothetical economy. If the quantity of real domestic output demanded increased by
$1,000 at each price level, the new equilibrium price level and quantity of real domestic
output would be
262.
Real Domestic Output
Demanded (in Billions)
Price Level
(Index Value)
Real Domestic Output
Supplied
$500
350
$3,500
1,000
300
3,000
1,500
250
2,500
2,000
200
2,000
2,500
150
1,500
3,000
100
1,000
The accompanying table shows the aggregate demand and aggregate supply schedule for a
hypothetical economy. If the quantity of real domestic output demanded decreased by
$500 and the quantity of real domestic output supplied increased by $500 at each price
level, the new equilibrium price level and quantity of real domestic output would be
32-140
Copyright © 2018 McGraw-Hill Education. All rights reserved. No reproduction or distribution without the prior
written consent of McGraw-Hill Education.
A. 150 and $1,500.
B.
150 and $2,000.
C. 200 and $2,000.
D. 250 and $2,000.
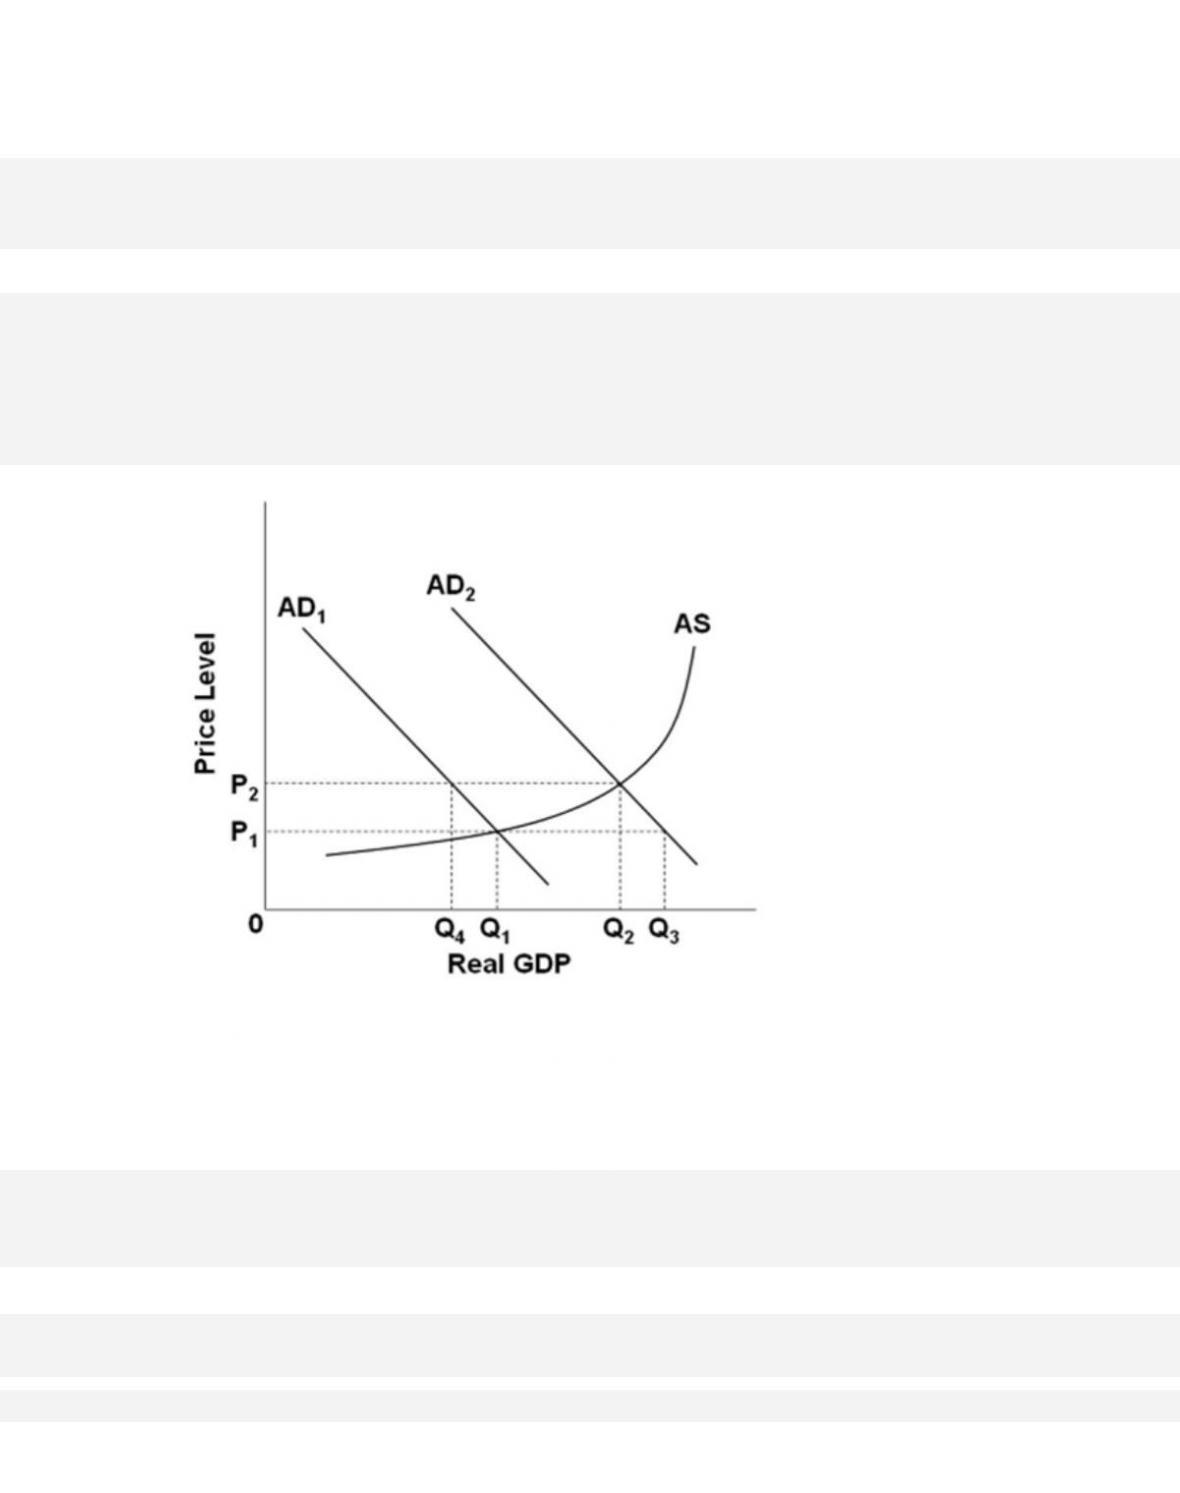
263.
Refer to the figure. If the aggregate demand curve shifts from AD2 to AD1, the multiplier
effect on real GDP will be a decrease from