
32–81
Copyright © 2018 McGraw-Hill Education. All rights reserved. No reproduction or distribution without the prior
written consent of McGraw-Hill Education.
Blooms: Remember
Dif f i c ul t y : 01 Easy
Learning Objective: 32-03 Define aggregate supply AS and explain how it differs in the
immediate short run, the short run, and the long run.
Test Bank: I
Topic: Aggregate Supply
143.
An increase in wealth from a substantial increase in stock prices will move the
economy along a fixed aggregate demand curve.
144.
An increase in imports (independent of a change in the U.S. price level) will increase
both U.S. aggregate supply and U.S. aggregate demand.
145.
An increase in business excise taxes will shift the aggregate supply curve leftward.

32–82
Copyright © 2018 McGraw-Hill Education. All rights reserved. No reproduction or distribution without the prior
written consent of McGraw-Hill Education.
Test Bank: I
To pic: Changes in Aggregate Supply
146.
A decrease in per-unit production costs will shift the aggregate supply curve leftward.
147.
The aggregate supply curve (short run) becomes steeper as the economy moves
rightward and upward along it.
148.
Cost-push inflation is depicted as a rightward shift of the aggregate demand curve along
an upsloping aggregate supply curve.
149.
A negative GDP gap can be caused by either a decrease in aggregate demand or a

decrease in aggregate supply.
150.
The equilibrium price level and equilibrium level of real GDP occur at the intersection
of the aggregate demand curve and the aggregate supply curve.
151.
The greater the upward slope of the AS curve, the larger is the realized multiplier
effect of a change in investment spending.
152.
The price level in the United States is more flexible downward than upward.

32–84
Copyright © 2018 McGraw-Hill Education. All rights reserved. No reproduction or distribution without the prior
written consent of McGraw-Hill Education.
AACSB: Knowledge Application
Accessibility: Keyboard Navigation
Blooms: Understand
Di ffi c ul t y: 02 Medium
Learning Objective: 32-06 Describe how the AD-AS model explains periods of demand-
pull inflation, cost-push inflation, and recession.
Test Bank: I
To pic: Changes in Equilibrium
Multiple Choice Questions
153.
The aggregate expenditures model and the aggregate demand curve can be reconciled
because, other things equal, in the aggregate expenditures model,
154.
In deriving the aggregate demand curve from the aggregate expenditures model, we
note that
32–85
Copyright © 2018 McGraw-Hill Education. All rights reserved. No reproduction or distribution without the prior
written consent of McGraw-Hill Education.
Dif f i c ul t y : 01 Easy
Learning Objective: 32-07 (Appendix) Identify how the aggregate demand curve relates to
the aggregate expenditures model.
Test Bank: I
To pic: The Relationship of the AD Curve to the Aggregate Expenditures Model
155.
An increase in aggregate expenditures resulting from a decrease in the price level is
equivalent to a
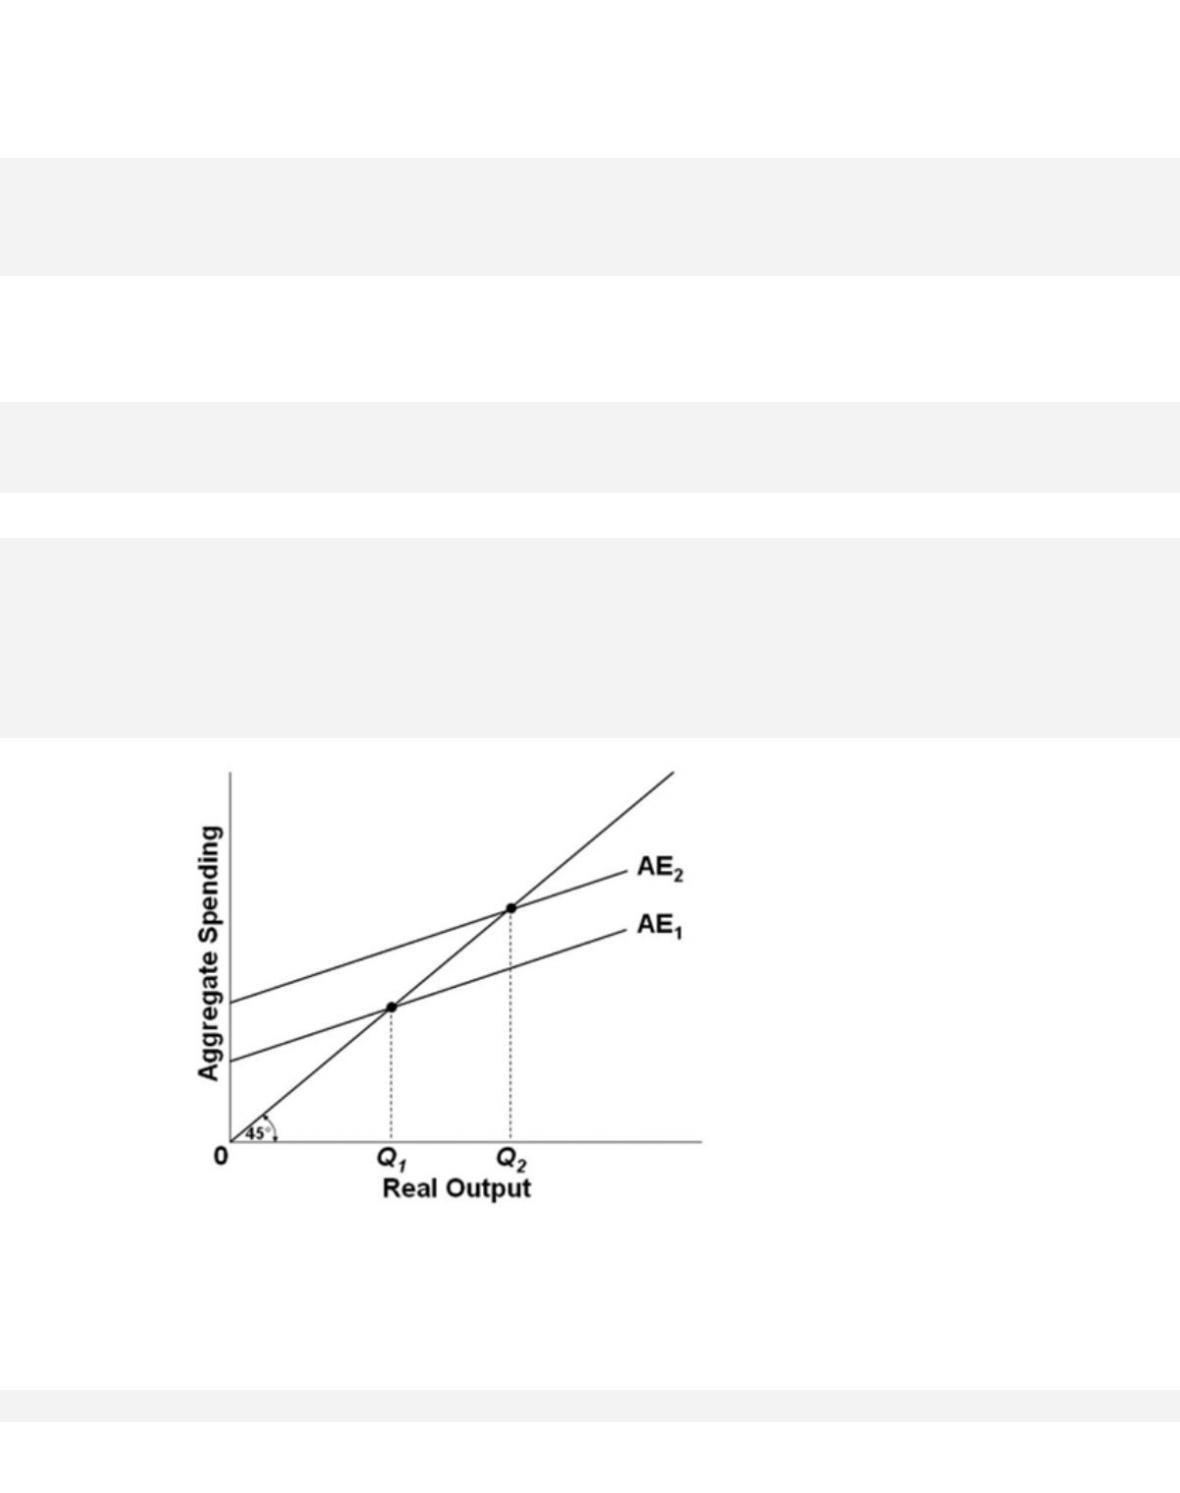
156.
Refer to the diagrams. A decline in aggregate expenditures from AE2 to AE1 resulting from
the real-balances, interest-rate, and foreign purchases effects would be depicted as
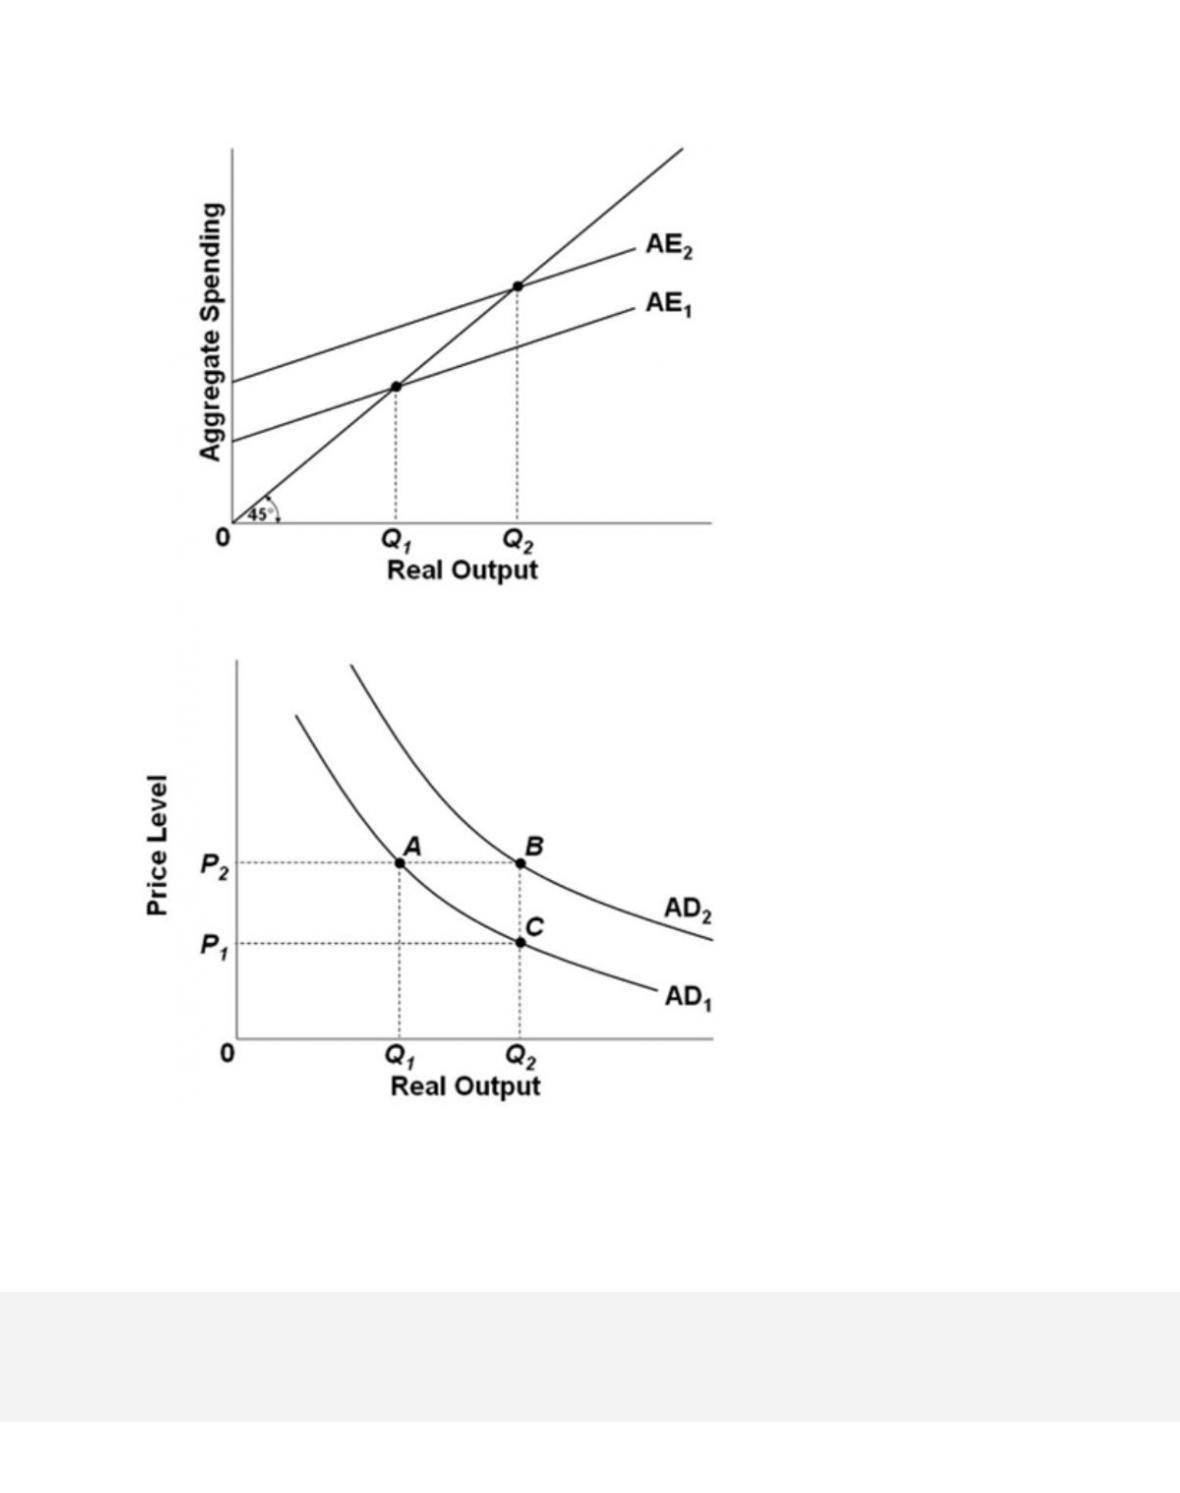
157.
Refer to the diagrams. Assuming a constant price level, an increase in aggregate
expenditures from AE1 to AE2 would

32–88
Copyright © 2018 McGraw-Hill Education. All rights reserved. No reproduction or distribution without the prior
written consent of McGraw-Hill Education.
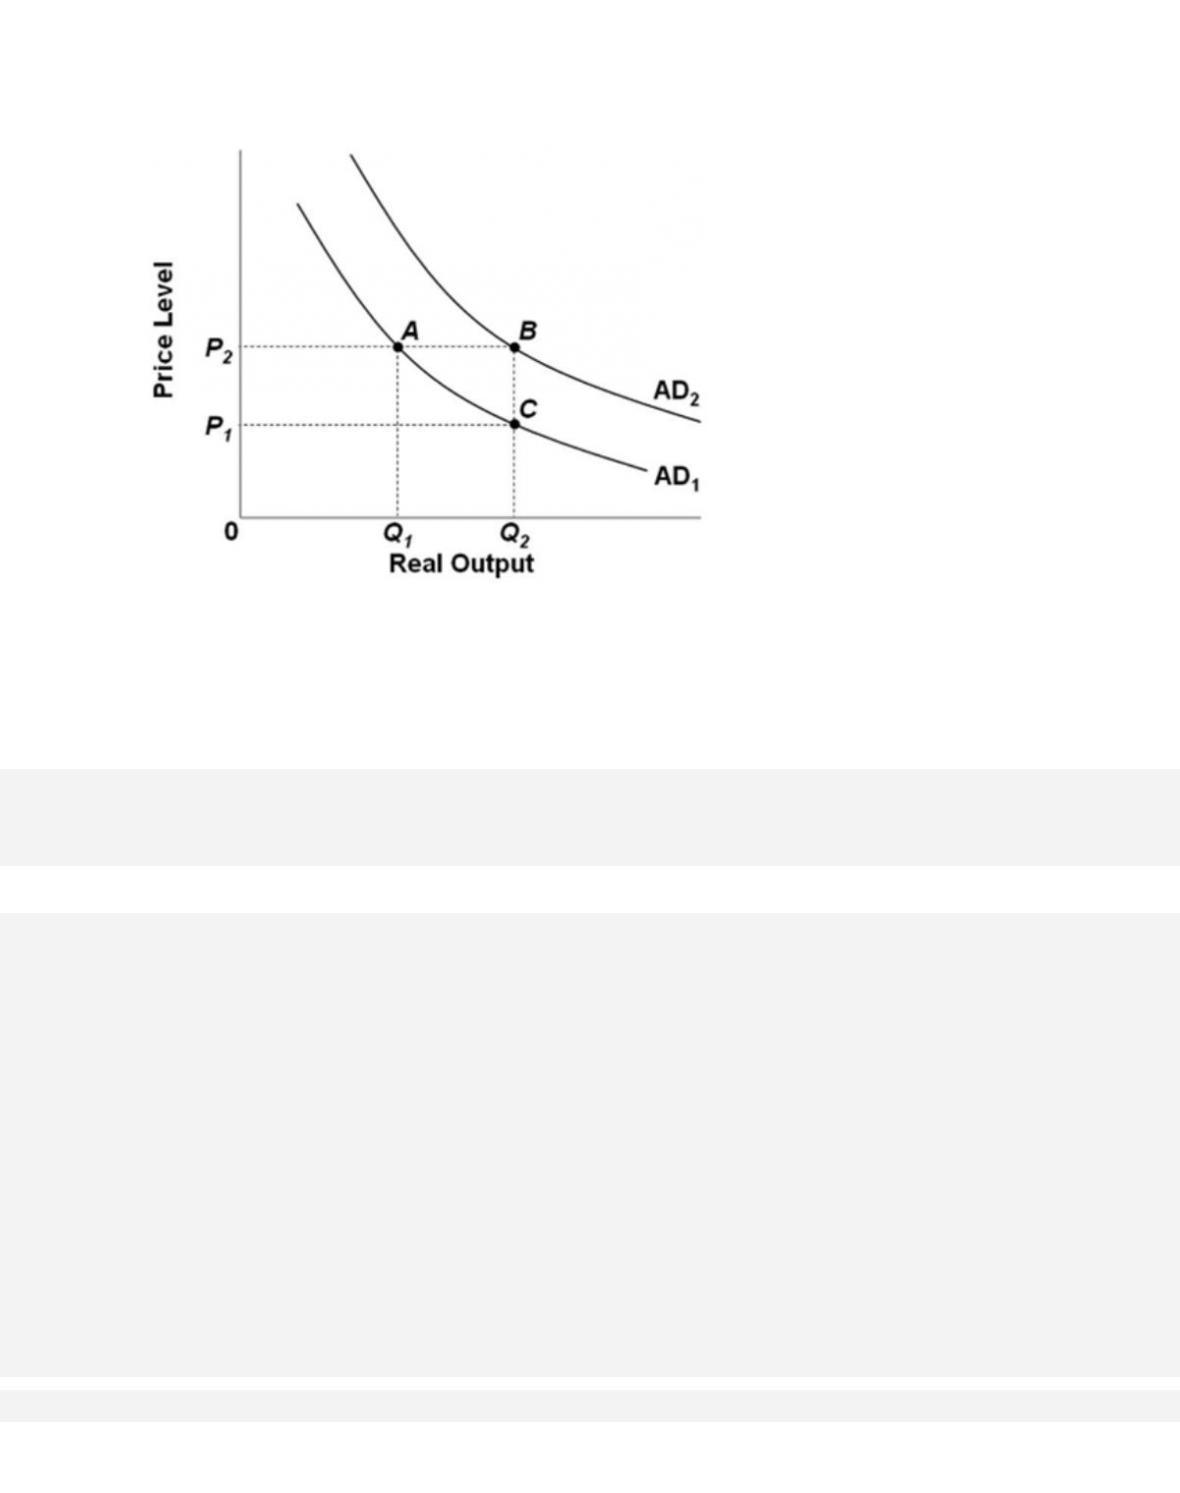
C.
increase aggregate demand from AD1 to AD2.
D. decrease aggregate demand from AD2 to AD1.
158.
An increase in net exports will shift the
159.
An increase in investment spending caused by higher expected rates of return will

32–89
Copyright © 2018 McGraw-Hill Education. All rights reserved. No reproduction or distribution without the prior
written consent of McGraw-Hill Education.
To pic: The Relationship of the AD Curve to the Aggregate Expenditures Model
160.
An increase in aggregate expenditures resulting from some factor other than a change in
the price level is equivalent to
161.
When deriving the aggregate demand (AD) curve from the aggregate expenditures
model, an increase in U.S. product prices would cause an increase in
162.
(Advanced analysis) Assume that the MPS is 0.33 in an economy that has an aggregate
supply curve with a slope of 1. An increase in investment spending of $10 billion will shift
the aggregate demand curve rightward by

163.
(Advanced analysis) Assume that the MPC is 0.8 in an economy that has an aggregate
supply curve with a slope of 1. Also, suppose that the price level is flexible downward. A
decrease in investment spending of $10 billion will shift the aggregate demand curve
leftward by
164.
In the aggregate demand-aggregate supply model, the economy’s price level is assumed
to be

32–91
Copyright © 2018 McGraw-Hill Education. All rights reserved. No reproduction or distribution without the prior
written consent of McGraw-Hill Education.
Test Bank: II
Topic: Aggregate Demand
165.
The aggregate demand curve shows the
166.
The labels for the axes of the aggregate demand graph should be
167.
The aggregate demand curve or schedule shows the relationship between the total
demand for output and the

168.
Which of the following effects best explains the downward slope of the aggregate
demand curve?
169.
The following factors explain the inverse relationship between the price level and the
total demand for output, except

32–93
Copyright © 2018 McGraw-Hill Education. All rights reserved. No reproduction or distribution without the prior
written consent of McGraw-Hill Education.
Test Bank: II
Topic: Aggregate Demand
170.
When the price level decreases,
171.
Which of the following is not an effect that occurs when the general price level in our
economy increases?
172.
The foreign purchases effect on aggregate demand suggests that a

32–94
Copyright © 2018 McGraw-Hill Education. All rights reserved. No reproduction or distribution without the prior
written consent of McGraw-Hill Education.
C.
rise in our domestic price level will increase our imports and reduce our exports,
thereby reducing the net exports component of aggregate demand.
D. rise in our domestic price level will decrease our imports and increase our exports,
thereby reducing the net exports component of aggregate demand.
173.
The interest rate effect on aggregate demand indicates that a(n)
174.
The real-balances effect on aggregate demand suggests that a

32–95
Copyright © 2018 McGraw-Hill Education. All rights reserved. No reproduction or distribution without the prior
written consent of McGraw-Hill Education.
D. higher price level will increase the real value of many financial assets and therefore
cause an increase in spending.
175.
The foreign purchases, interest rate, and real-balances effects explain why the
176.
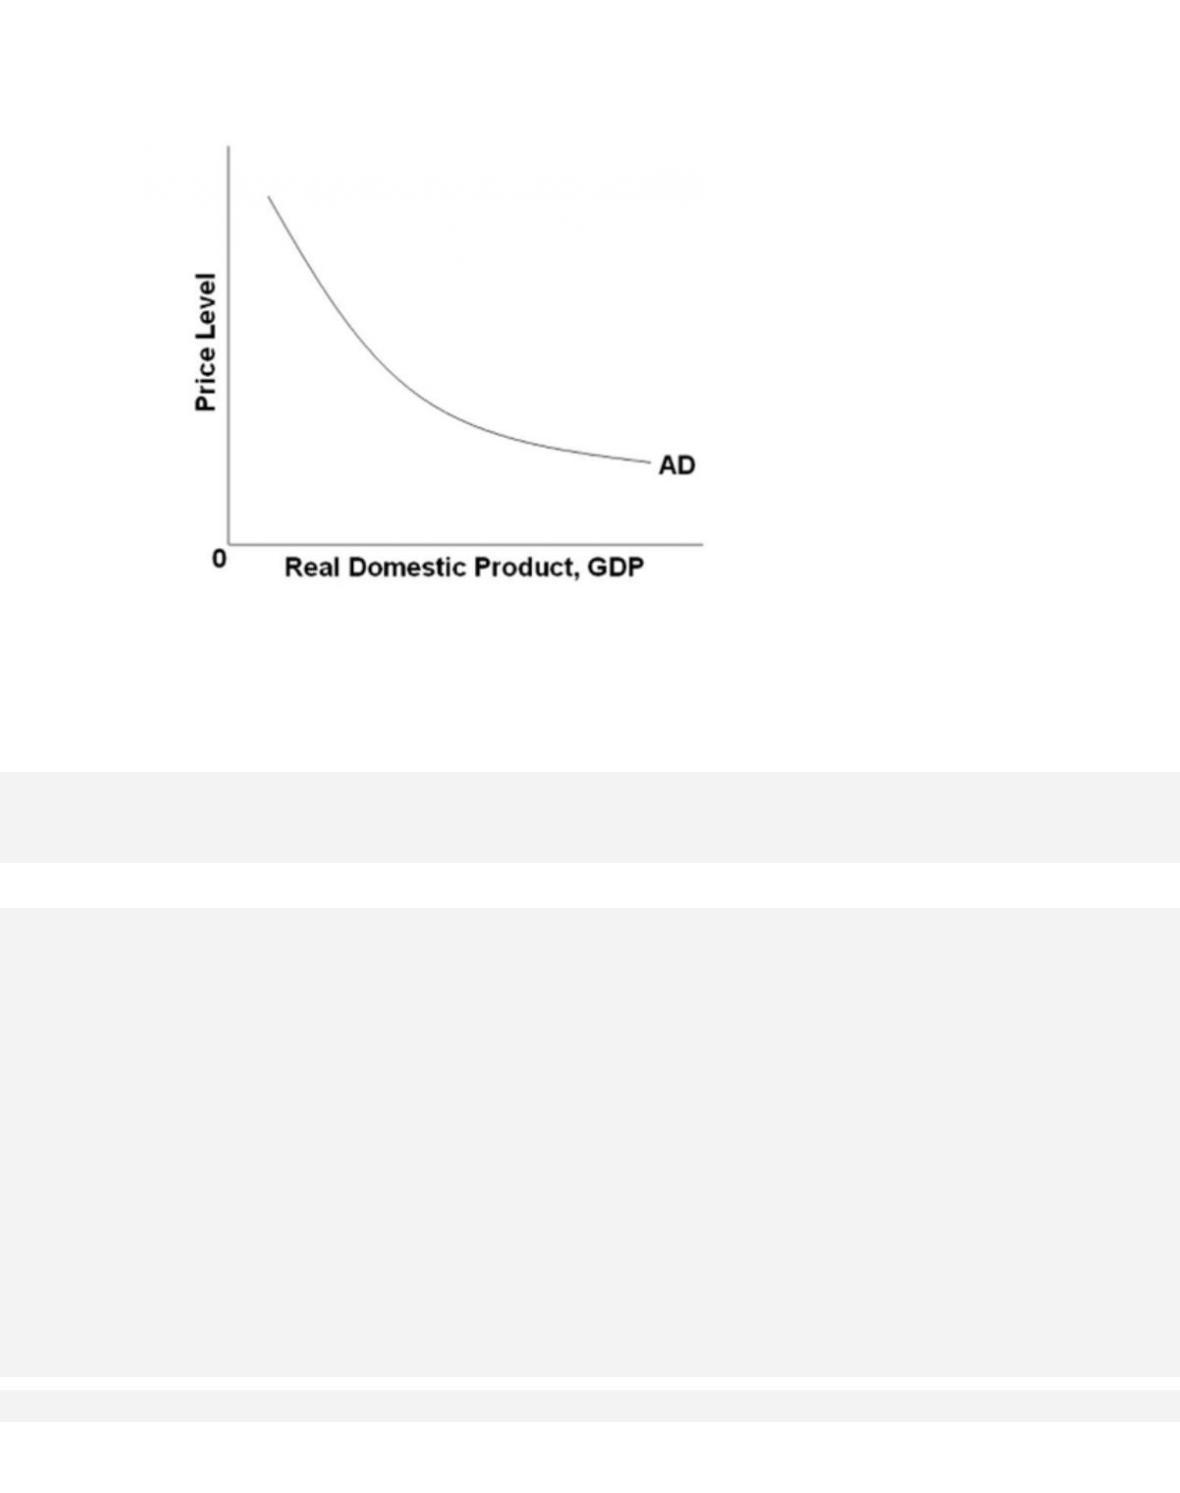
Refer to the graph. Which of the following factors does not explain a movement along the
AD curve?
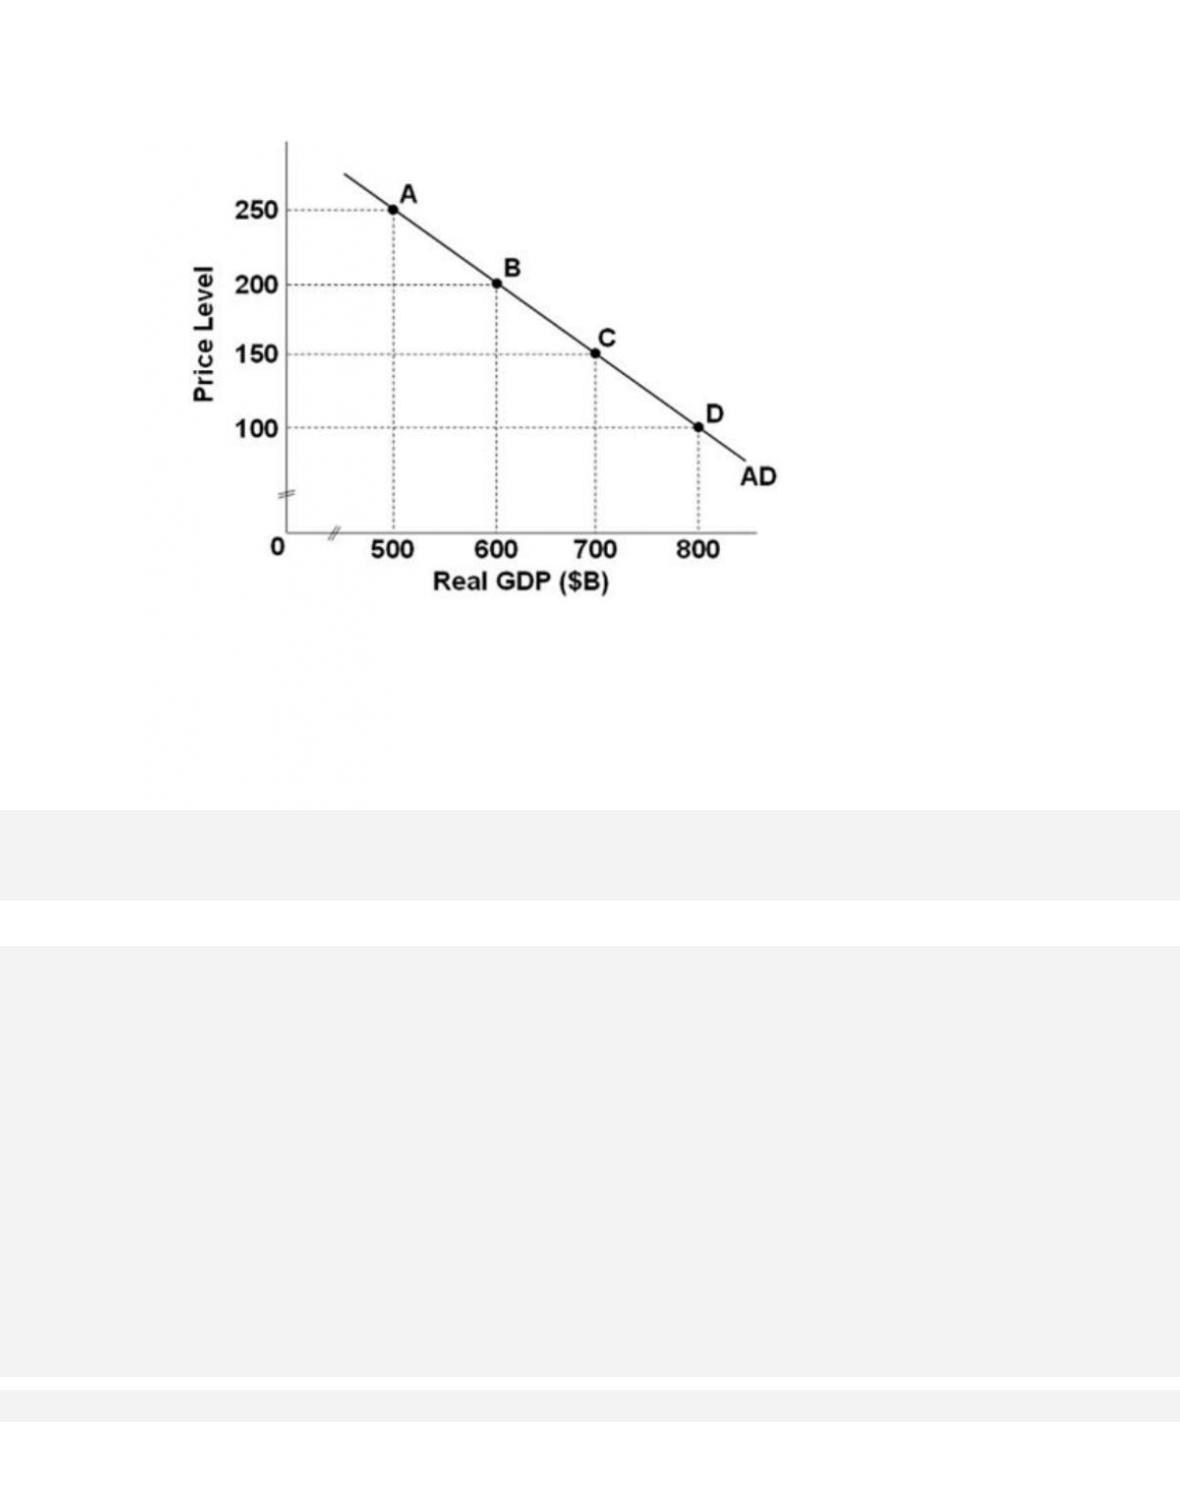
177.
Refer to the graph, which shows an aggregate demand curve. If the price level decreases
from 200 to 100, the real output demanded will
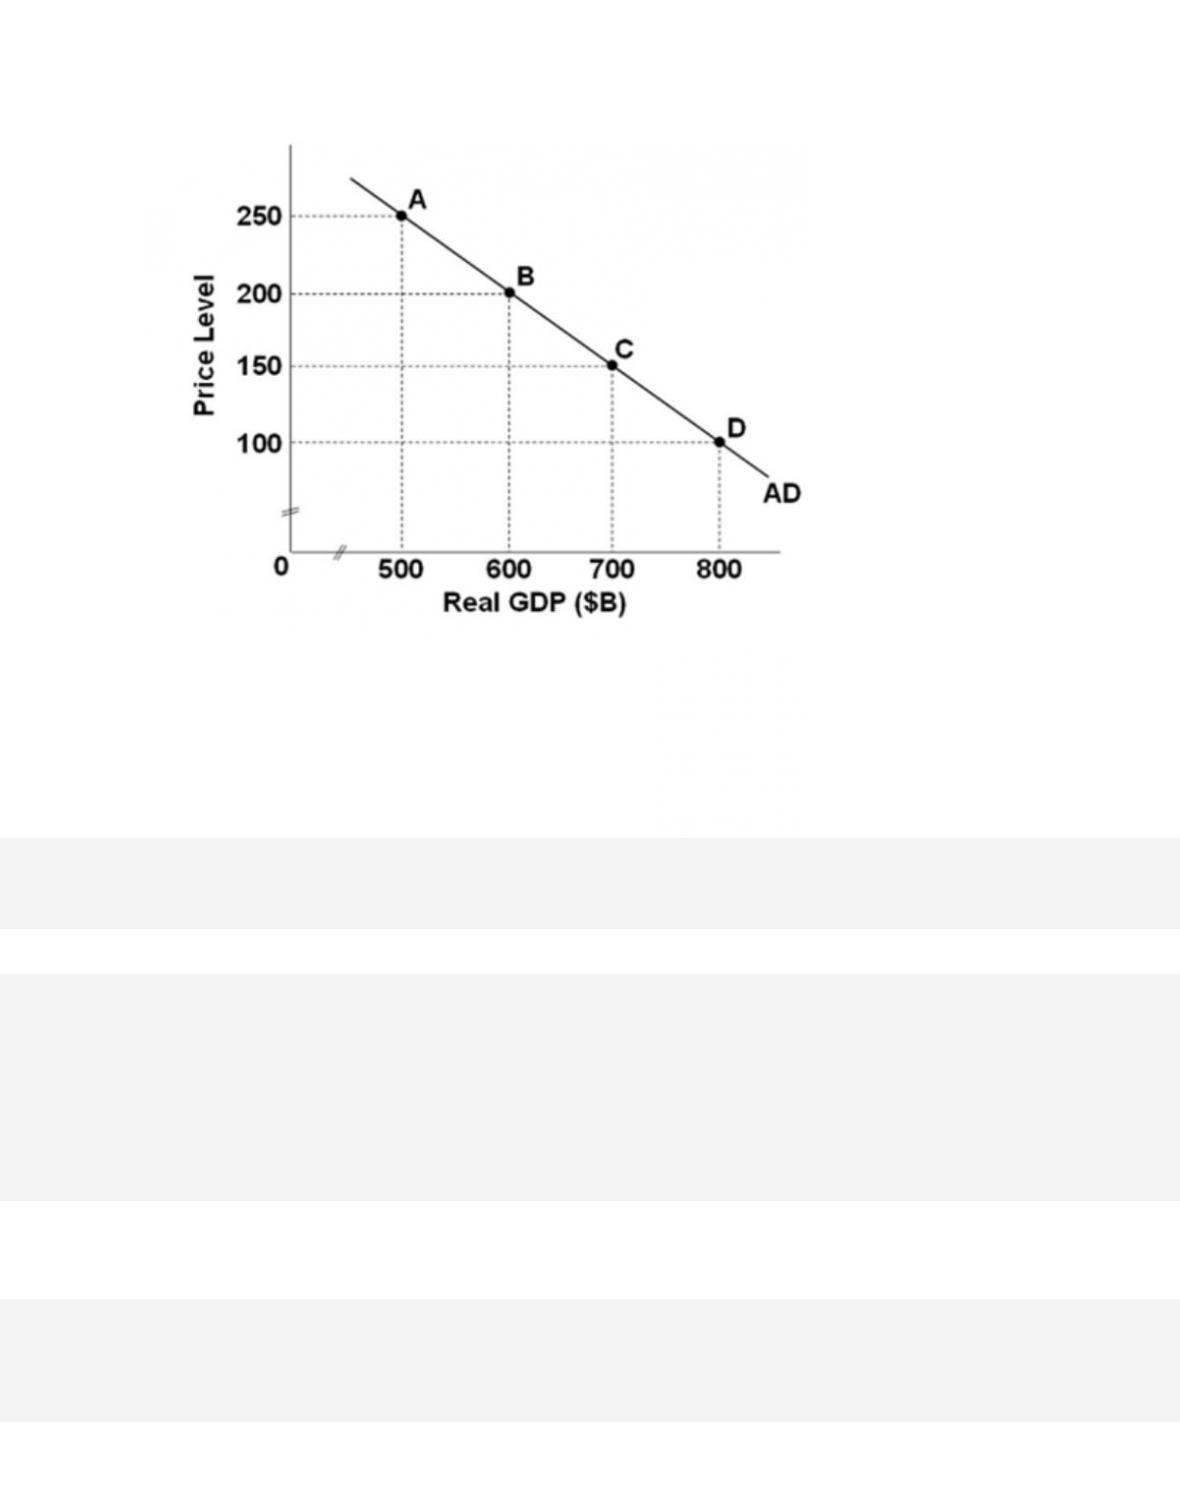
178.
Refer to the graph, which shows an aggregate demand curve. If the economy is at point C
and the price level increases by 100, then the wealth, interest-rate, and foreign purchases
effects will
179.
A decrease in interest rates caused by a change in the price level would cause a(n)

32–99
Copyright © 2018 McGraw-Hill Education. All rights reserved. No reproduction or distribution without the prior
written consent of McGraw-Hill Education.
C.
decrease in the quantity of real output demanded (or movement up along AD).
D.
increase in the quantity of real output demanded (or movement down along AD).
180.
An increase in personal income tax rates will cause a(n)
181.
An expected increase in the prices of consumer goods in the near future will
182.
A decrease in expected returns on investment will most likely shift the AD curve to the

32-100
Copyright © 2018 McGraw-Hill Education. All rights reserved. No reproduction or distribution without the prior
written consent of McGraw-Hill Education.
A.
right because C will increase.
B.
left because C will decrease.
C.
right because Ig will increase.
D.
left because Ig will decrease.
183.
An increase in personal income taxes would shift AD to the
184.
An increase in expected future income will
185.
An increase in aggregate demand is most likely to be caused by which of the