109.
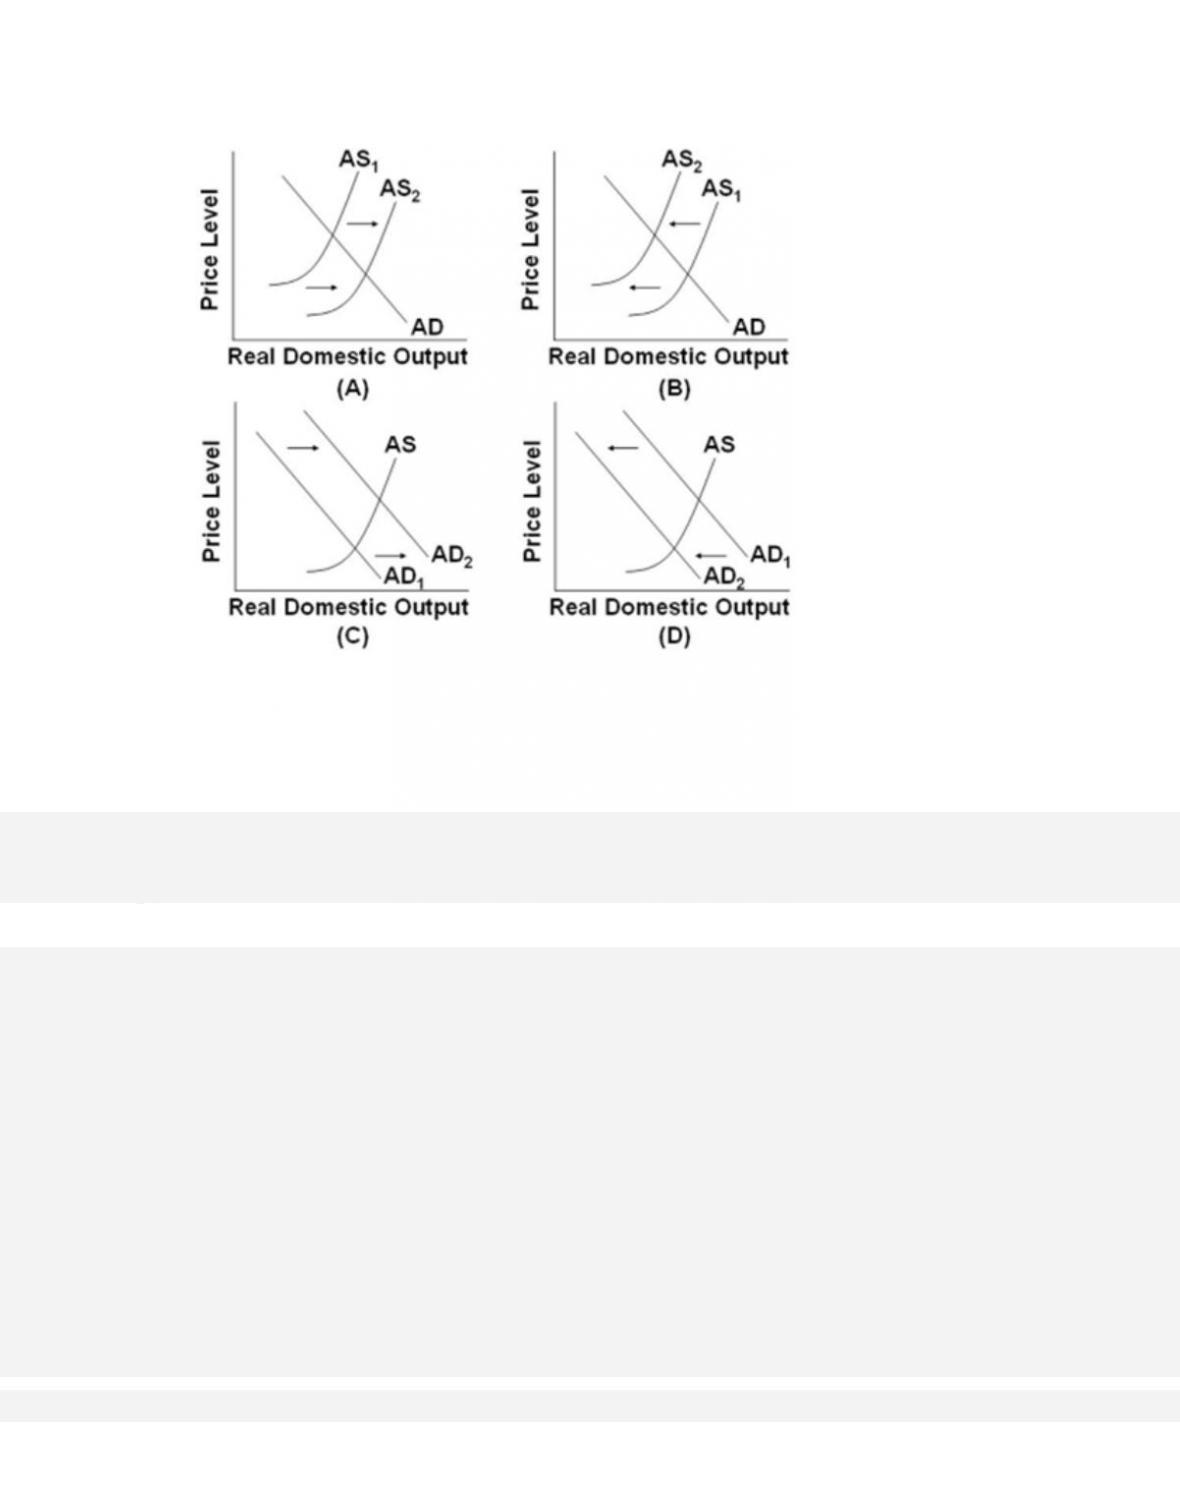
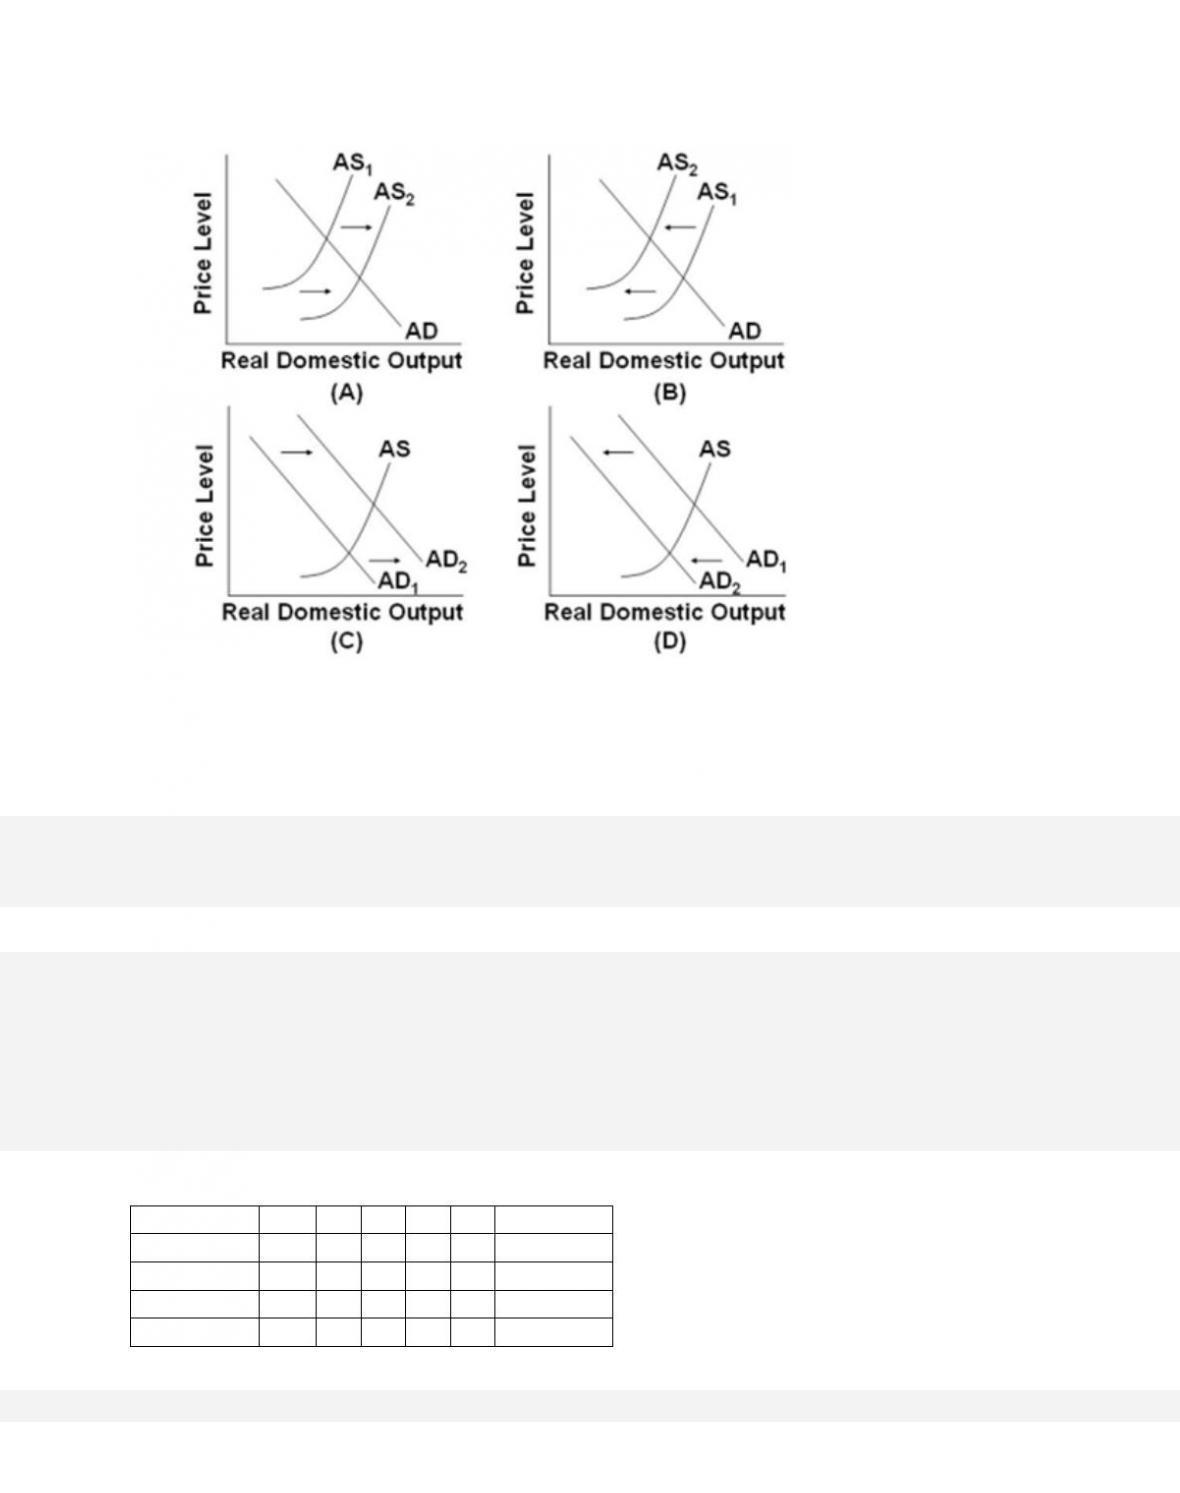
Which of the diagrams for the U.S. economy best portrays the effects of a substantial
reduction in government spending?
32–62
110.
Which of the diagrams for the U.S. economy best portrays the effects of a dramatic increase
in energy prices?
111.
Price Level
C
Ig
G
X
M
Real GDP
128
$18
$2
$3
$1
$5
125
20
4
3
2
4
122
22
6
3
3
3
119
24
8
3
4
2

116
26
10
3
5
1
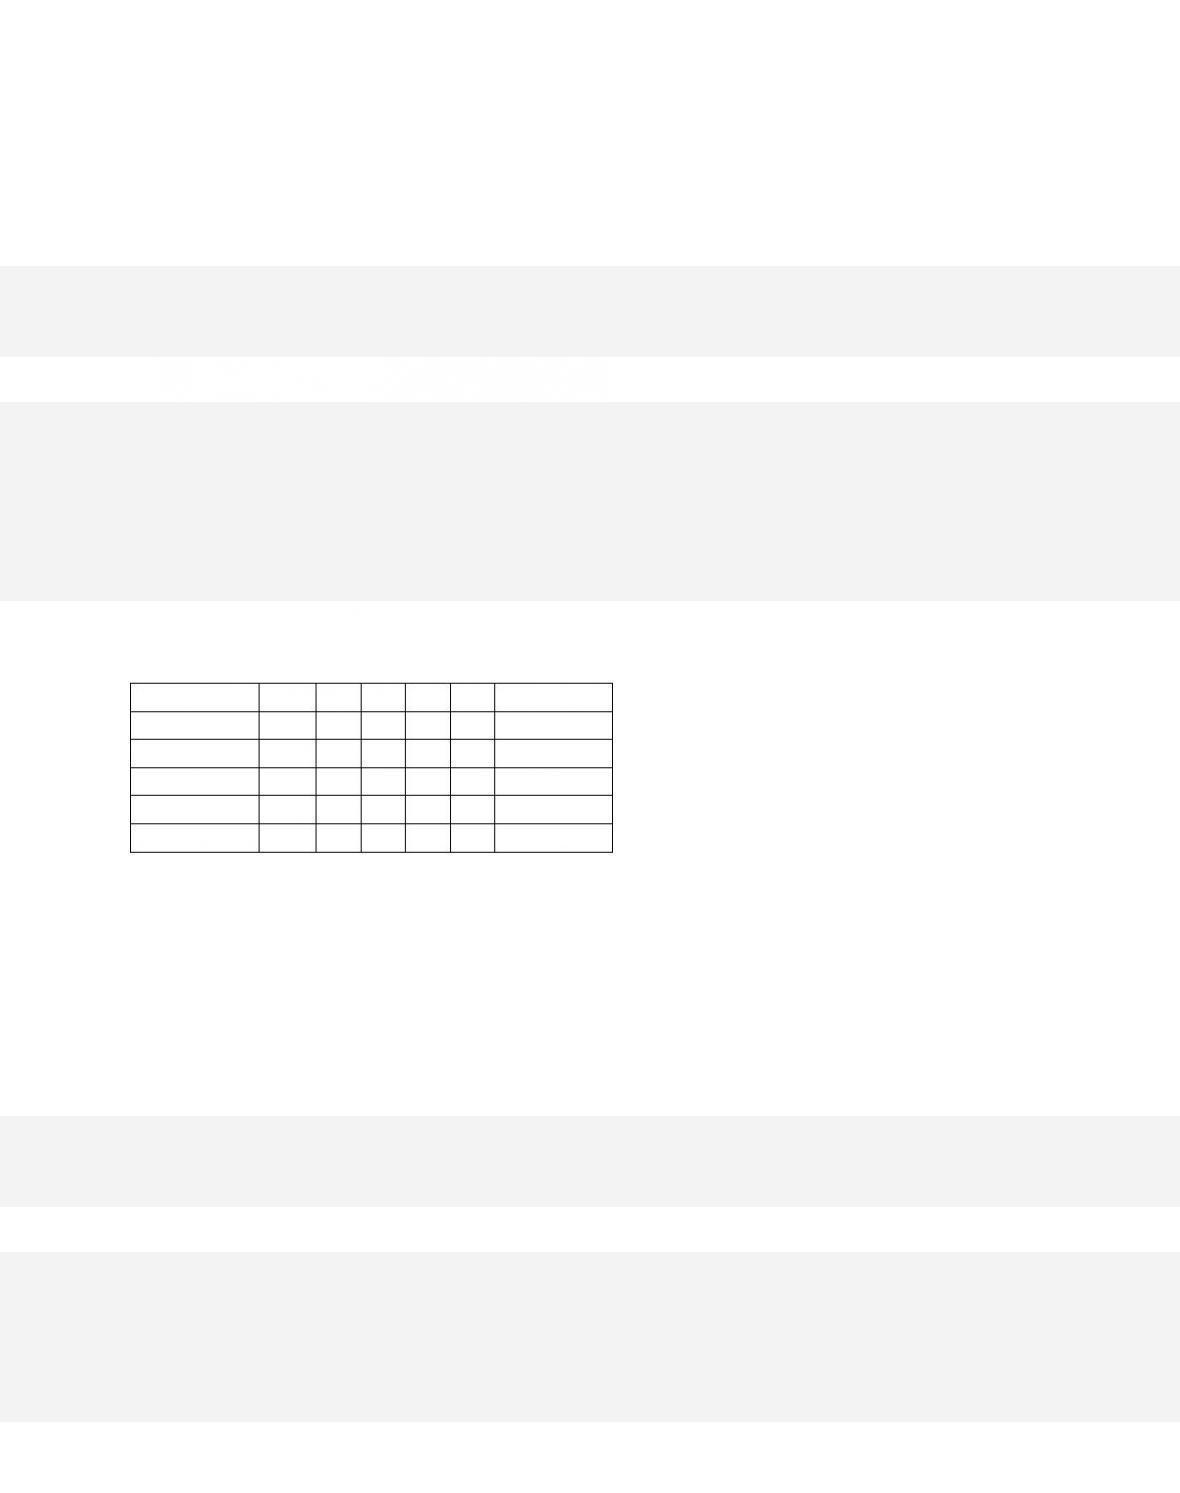
In the accompanying table for a particular country, C is consumption expenditures, Ig is
gross investment expenditures, G is government expenditures, X is exports, and M is
imports. All figures are in billions of dollars. Which of the following schedules constitutes
aggregate demand in this country?
128
$19
125
122
119
116
128
$23
125
122
119
116
128
$20
125
122
119
116
125
37
122
40
119
43
116
46
112.
Price Level
C
Ig
G
X
M
Real GDP
128
$18
$2
$3
$1
$5
125
20
4
3
2
4
122
22
6
3
3
3
119
24
8
3
4
2
116
26
10
3
5
1
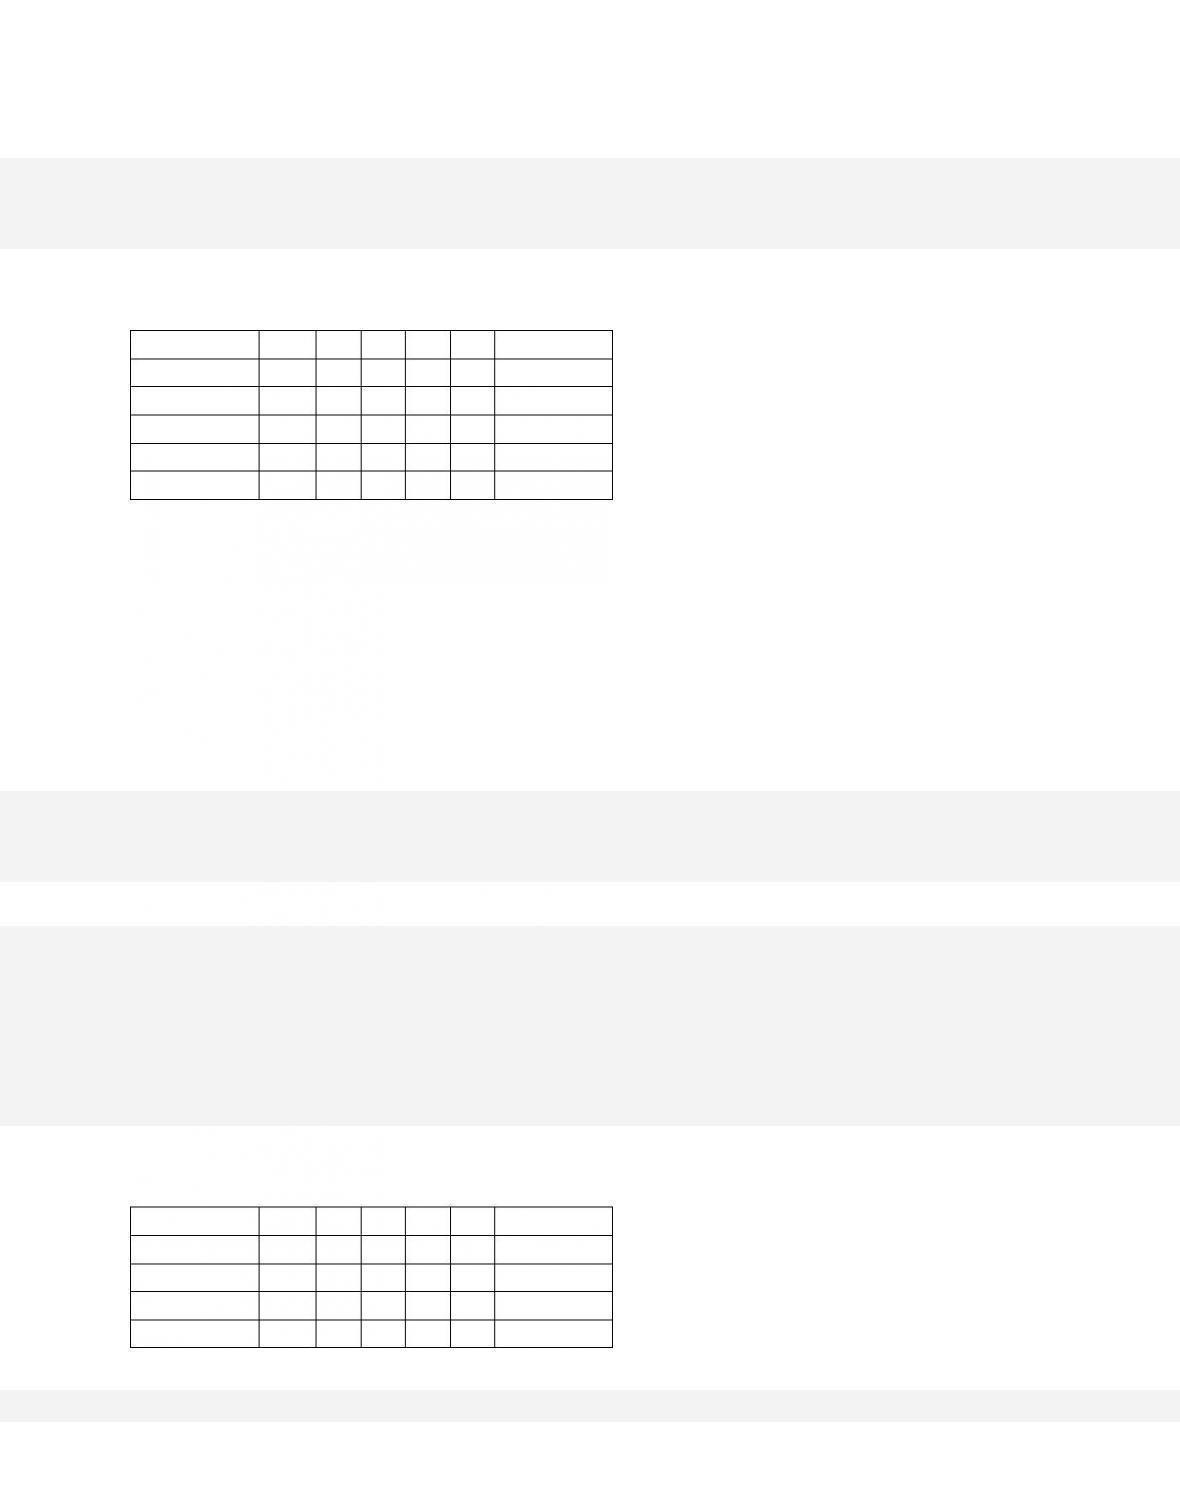
In the accompanying table for a particular country, C is consumption expenditures, Ig is
gross investment expenditures, G is government expenditures, X is exports, and M is
imports. All figures are in billions of dollars. The interest-rate effect of changes in the price
level is shown by columns
32–65
113.
Price Level
C
Ig
G
X
M
Real GDP
128
$18
$2
$3
$1
$5
125
20
4
3
2
4
122
22
6
3
3
3
119
24
8
3
4
2
116
26
10
3
5
1
In the accompanying table for a particular country, C is consumption expenditures, Ig is
gross investment expenditures, G is government expenditures, X is exports, and M is
imports. All figures are in billions of dollars. The real-balances effect of changes in the
price level is
114.
Price Level
C
Ig
G
X
M
Real GDP
128
$18
$2
$3
$1
$5
125
20
4
3
2
4
122
22
6
3
3
3
119
24
8
3
4
2
116
26
10
3
5
1
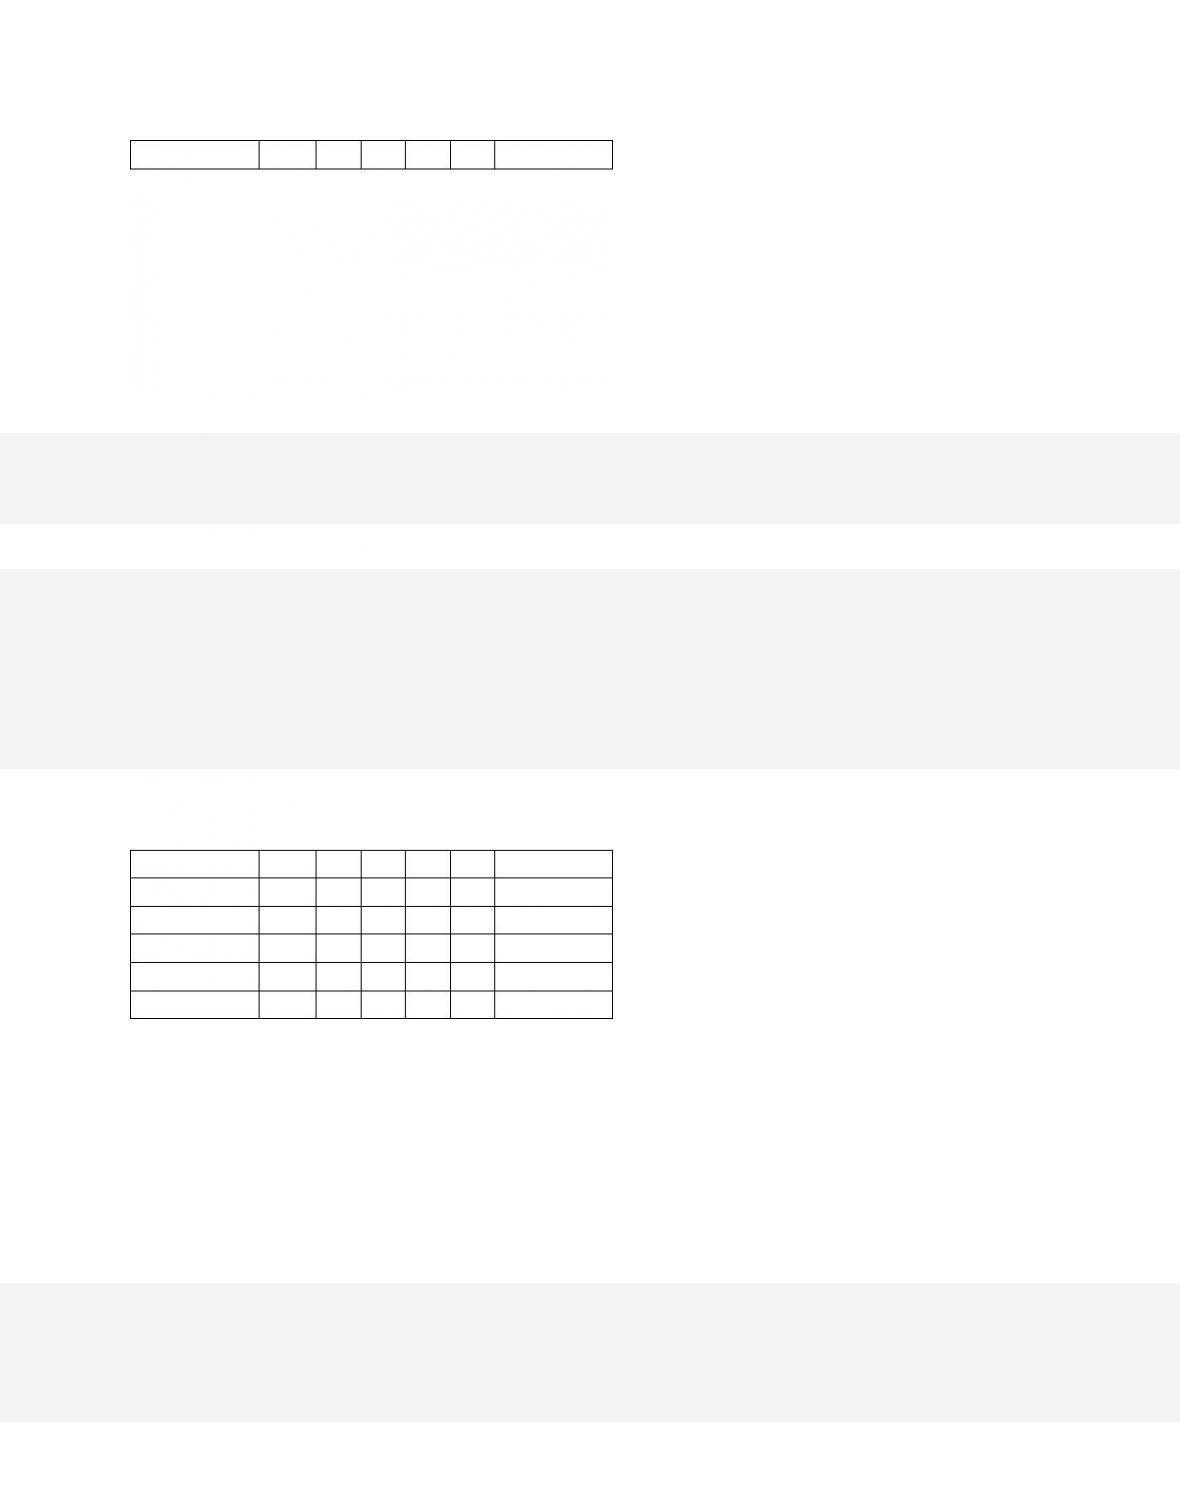
In the accompanying table for a particular country, C is consumption expenditures, Ig is
gross investment expenditures, G is government expenditures, X is exports, and M is
imports. All figures are in billions of dollars. If equilibrium real GDP is $31 billion, the
equilibrium price level will be
115.
Price Level
C
Ig
G
X
M
Real GDP
128
$18
$2
$3
$1
$5
125
20
4
3
2
4
122
22
6
3
3
3
119
24
8
3
4
2
116
26
10
3
5
1
In the accompanying table for a particular country, C is consumption expenditures, Ig is
gross investment expenditures, G is government expenditures, X is exports, and M is
imports. All figures are in billions of dollars. If the amounts of GDP supplied at the price
levels shown (in descending order) are $45, $43, $40, $37, and $31, the equilibrium
level
of real GDP will be
32–67
Copyright © 2018 McGraw-Hill Education. All rights reserved. No reproduction or distribution without the prior
written consent of McGraw-Hill Education.
price level and level of real GDP.
Test Bank: I
Topic: Equilibrium in the AD–AS Model
Type: Table
116.
Price Level
C
Ig
G
X
M
Real GDP
128
$18
$2
$3
$1
$5
125
20
4
3
2
4
122
22
6
3
3
3
119
24
8
3
4
2
116
26
10
3
5
1
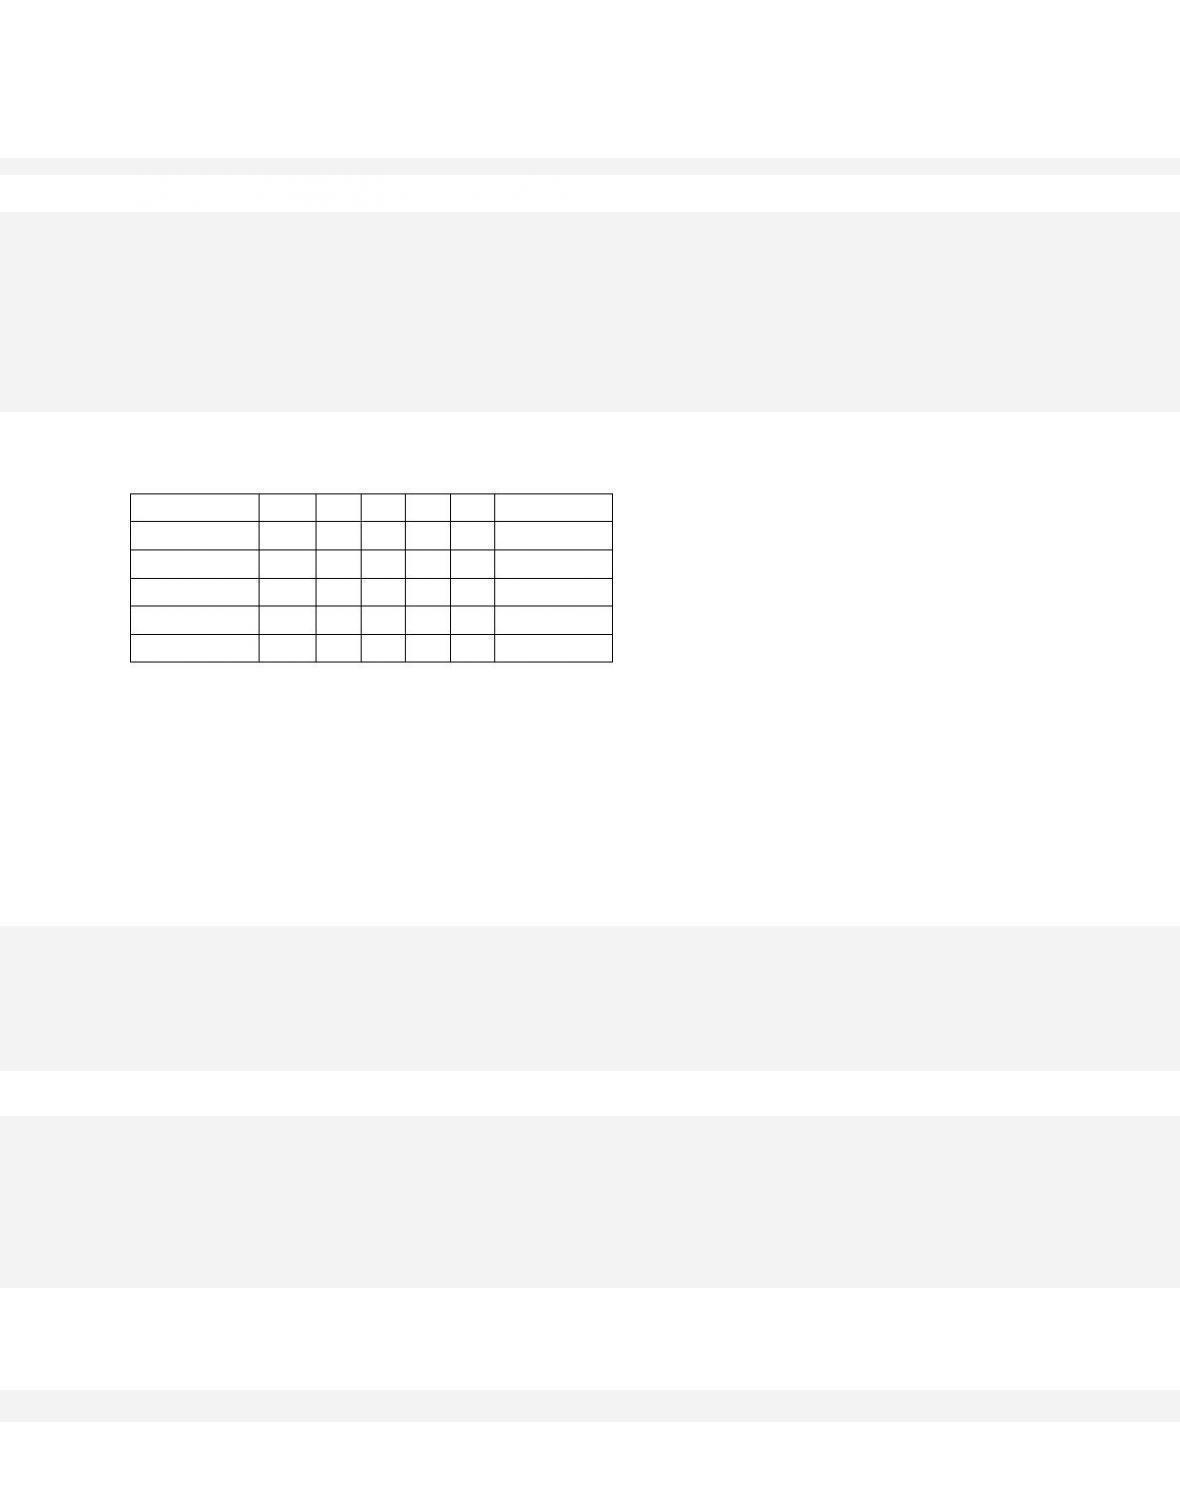
In the accompanying table for a particular country, C is consumption expenditures, Ig is
gross investment expenditures, G is government expenditures, X is exports, and M is
imports. All figures are in billions of dollars. If the amounts of GDP supplied at the price
levels shown (in descending order) are $27, $25, $22, $18, and $13, the equilibrium
price
level will be
117.
Price Level
C
Ig
G
X
M
Real GDP
128
$18
$2
$3
$1
$5
125
20
4
3
2
4
122
22
6
3
3
3
119
24
8
3
4
2
116
26
10
3
5
1
In the accompanying table for a particular country, C is consumption expenditures, Ig is
gross investment expenditures, G is government expenditures, X is exports, and M is
imports. All figures are in billions of dollars. If this nation’s equilibrium price level is 125,
its net exports will be
118.
Price Level
C
Ig
G
X
M
Real GDP
128
$18
$2
$3
$1
$5
125
20
4
3
2
4
122
22
6
3
3
3
119
24
8
3
4
2
116
26
10
3
5
1
In the accompanying table for a particular country, C is consumption expenditures, Ig is
gross investment expenditures, G is government expenditures, X is exports, and M is
imports. All figures are in billions of dollars. If the equilibrium level of real GDP is $43
billion, its level of consumption will be
32–69
Copyright © 2018 McGraw-Hill Education. All rights reserved. No reproduction or distribution without the prior
written consent of McGraw-Hill Education.
D.
$26 billion.
119.
Price Level
C
Ig
G
X
M
Real GDP
128
$18
$2
$3
$1
$5
125
20
4
3
2
4
122
22
6
3
3
3
119
24
8
3
4
2
116
26
10
3
5
1
In the accompanying table for a particular country, C is consumption expenditures, Ig is
gross investment expenditures, G is government expenditures, X is exports, and M is
imports. All figures are in billions of dollars. A decline in the international value of the
dollar would
120.

Price Level
C
Ig
G
X
M
Real GDP
128
$18
$2
$3
$1
$5
125
20
4
3
2
4
122
22
6
3
3
3
119
24
8
3
4
2
116
26
10
3
5
1
In the accompanying table for a particular country, C is consumption expenditures, Ig is
gross investment expenditures, G is government expenditures, X is exports, and M is
imports. All figures are in billions of dollars. A decrease in the interest rate not caused by a
change in the price level would
121.
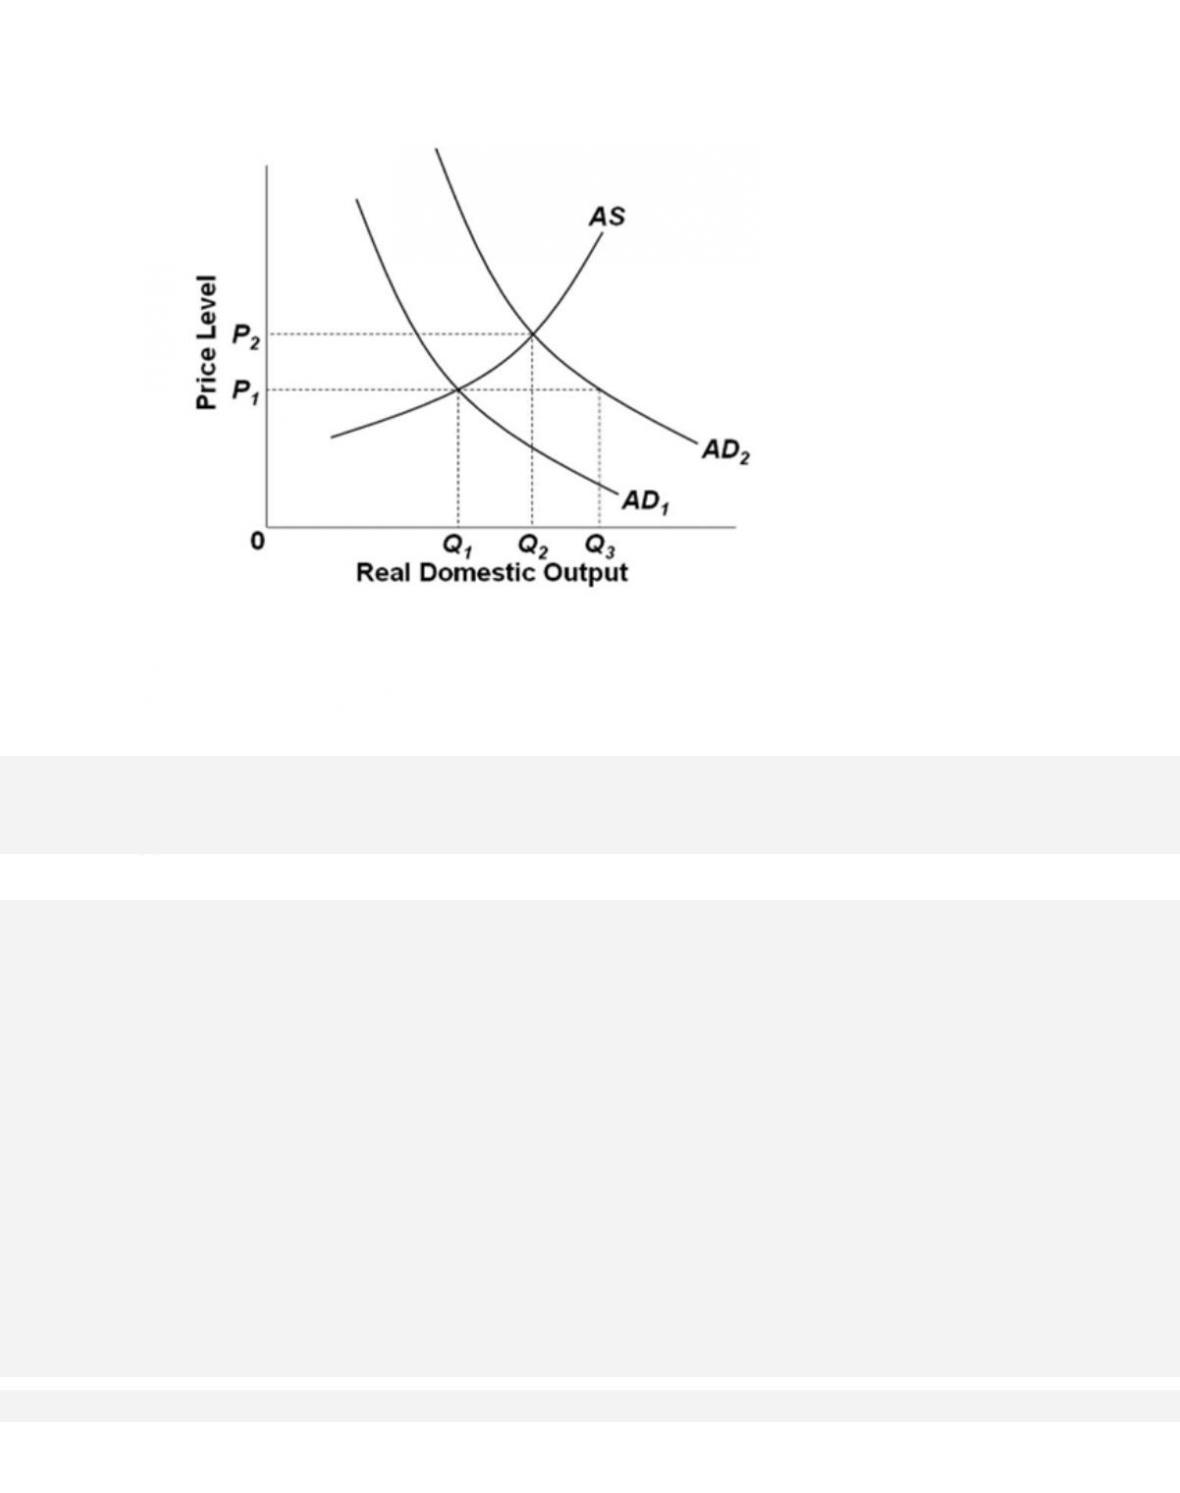
Refer to the diagram. If equilibrium real output is Q2, then
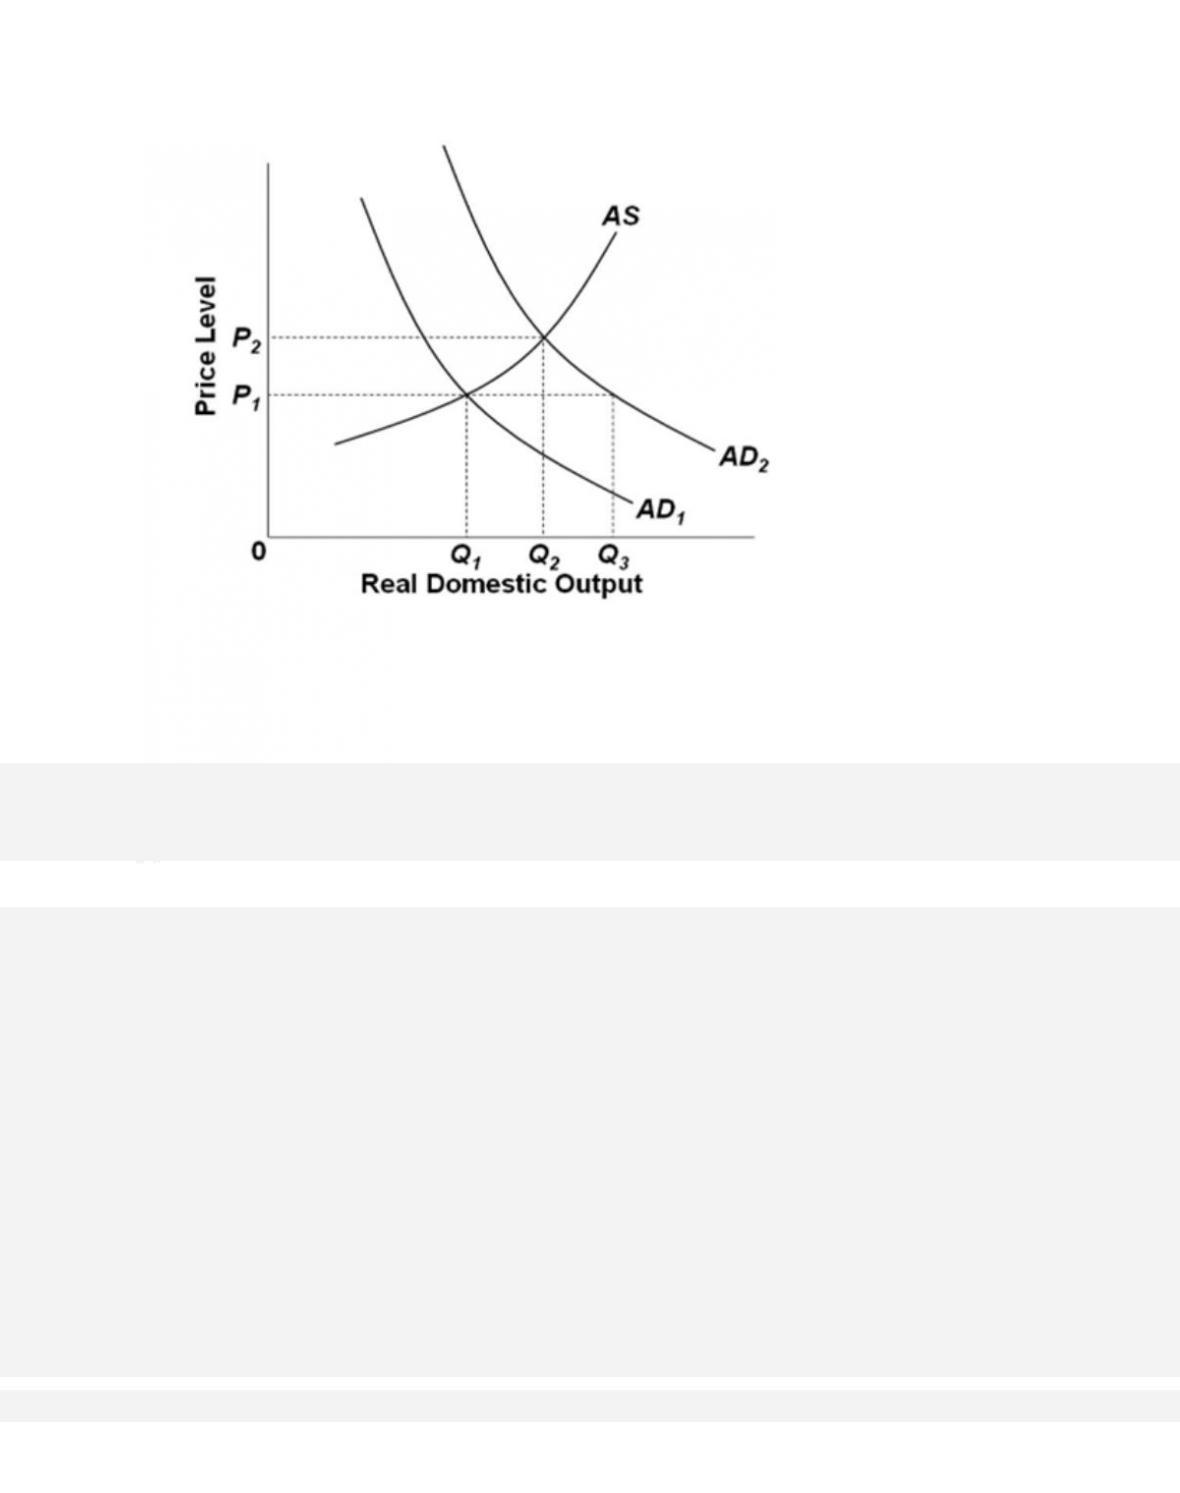
122.
Refer to the diagram. If the equilibrium price level is P1, then
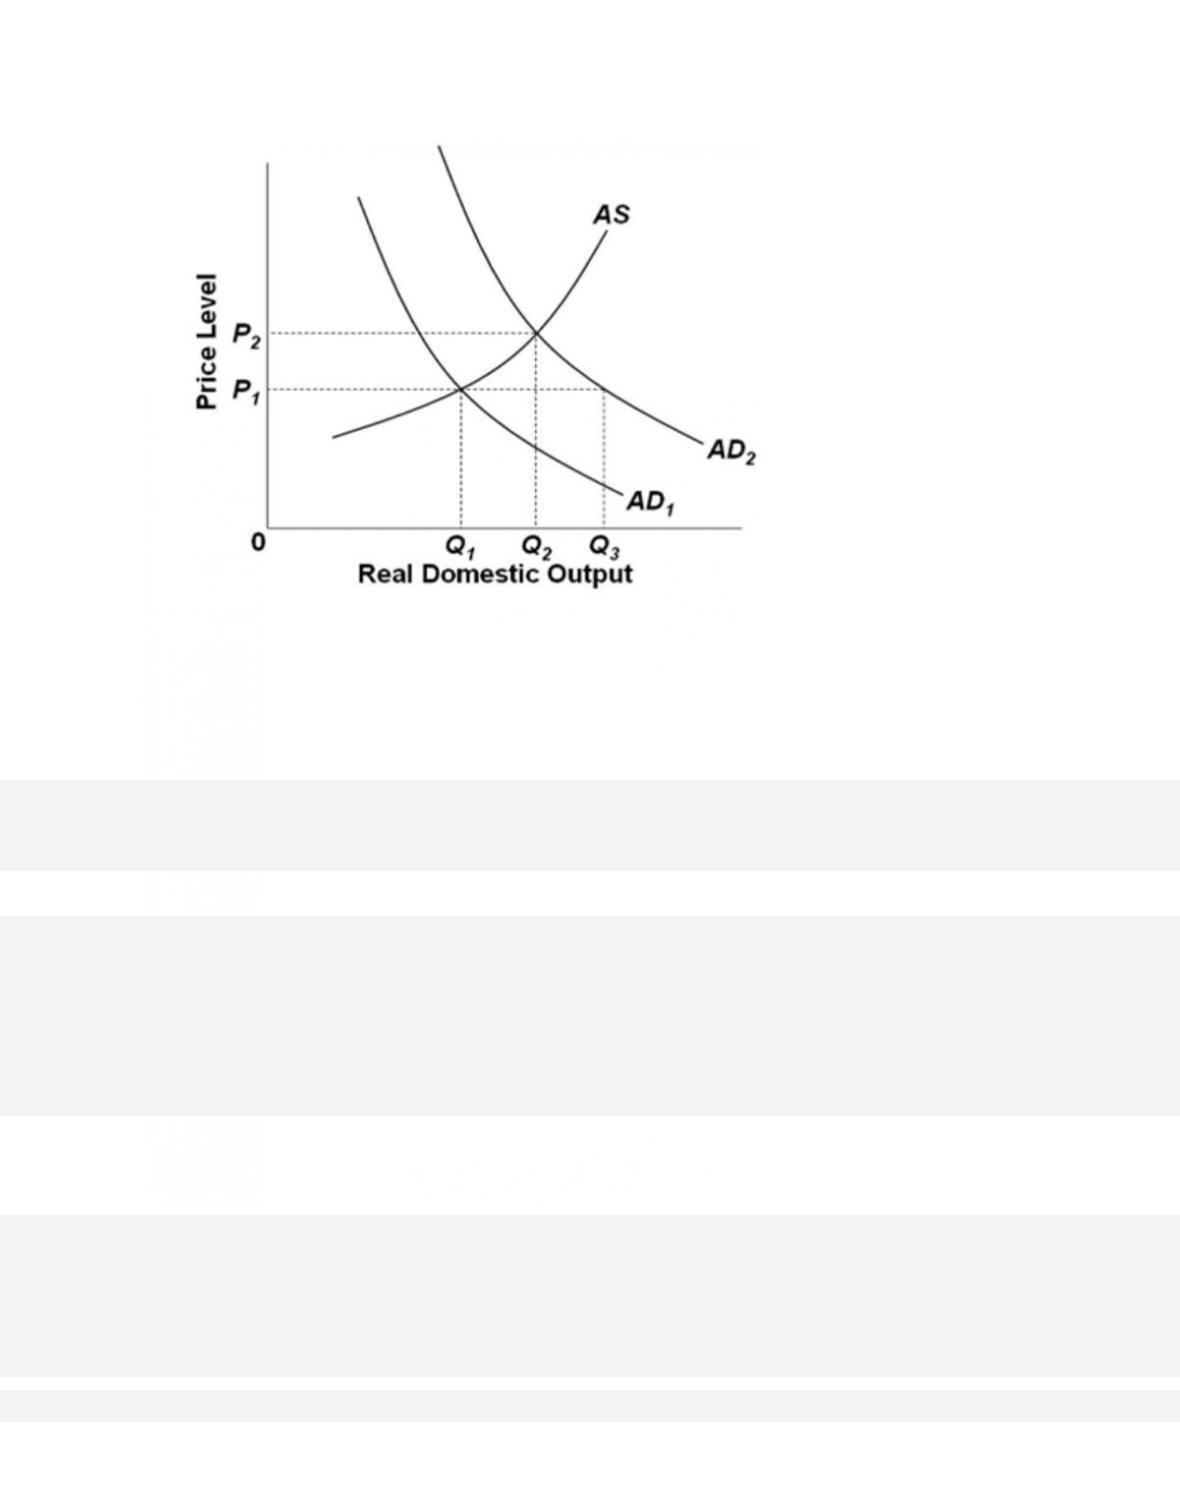
123.
Refer to the diagram. Suppose that aggregate demand increased from AD1 to AD2. For the
price level to stay constant,
124.
The size of the multiplier associated with an initial increase in spending will be

32–74
Copyright © 2018 McGraw-Hill Education. All rights reserved. No reproduction or distribution without the prior
written consent of McGraw-Hill Education.
AACSB: Knowledge Application
Accessibility: Keyboard Navigation
Blooms: Understand
Diffic ult y: 02 Medium
Learning Objective: 32-06 Describe how the AD-AS model explains periods of demand-
pull inflation, cost-push inflation, and recession.
Test Bank: I
Topic: Changes in Equilibrium
126.
Prices and wages tend to be

127.
Efficiency wages are
128.
When aggregate demand declines, wage rates may be inflexible downward, at least for
a time, because of
129.
When aggregate demand declines, many firms may reduce employment rather than
wages because wage reductions may

32–76
Copyright © 2018 McGraw-Hill Education. All rights reserved. No reproduction or distribution without the prior
written consent of McGraw-Hill Education.
Accessibility: Keyboard Navigation
Blooms: Understand
Diffic ult y: 02 Medium
Learning Objective: 32-06 Describe how the AD-AS model explains periods of demand-
pull inflation, cost-push inflation, and recession.
Test Bank: I
Topic: Changes in Equilibrium
130.
When aggregate demand declines, some firms may reduce employment rather than
wages because wage reductions may
131.
When aggregate demand declines, the price level may remain constant, at least for a
time, because
132.
Menu costs

32–77
Copyright © 2018 McGraw-Hill Education. All rights reserved. No reproduction or distribution without the prior
written consent of McGraw-Hill Education.
A.
increase during recession.
B.
decrease during recession.
C.
are the costs to firms of changing prices and communicating them to customers.
D. are sunk costs and therefore should be disregarded.
133.
The fear of unwanted price wars may explain why many firms are reluctant to
134.
(Consider This) The idea that the price level readily moves upward but not downward
is called the

32–78
Copyright © 2018 McGraw-Hill Education. All rights reserved. No reproduction or distribution without the prior
written consent of McGraw-Hill Education.
Test Bank: I
Topic: Changes in Equilibrium
135.
(Consider This) The ratchet effect is the tendency of
136.
(Last Word) In response to the Great Recession, the federal government engaged in
significant deficit-funded spending. What was the result of that spending over the first three
years?
137.
(Last Word) In response to the Great Recession, the federal government engaged in
significant deficit-funded spending, but it did not fully achieve the desired result. Which of
the
following best explains why the fiscal policy actions fell short of their objective?

32–79
Copyright © 2018 McGraw-Hill Education. All rights reserved. No reproduction or distribution without the prior
written consent of McGraw-Hill Education.
A. Monetary policy counteracted fiscal policy, keeping the unemployment rate from falling
as much as intended.
B.
Consumers did not respond to the fiscal stimulus as well as hoped, as they put more
income into saving and repaying debt.
C.
Although the fiscal stimulus increased consumer spending significantly, it mostly went to
purchase foreign-produced goods and services.
D.
The fiscal stimulus caused massive inflation that further disrupted economic activity.
138.
(Last Word) In response to the Great Recession, the federal government engaged in
significant deficit-funded spending. While it kept the recession from getting worse, and did
result in some positive economic growth, it did not fully achieve the desired result. Which
of the following best explains why the fiscal policy actions fell short of their objective?
True / False Questions
139.
The interest-rate effect is one of the determinants of aggregate demand.

32–80
Copyright © 2018 McGraw-Hill Education. All rights reserved. No reproduction or distribution without the prior
written consent of McGraw-Hill Education.
AACSB: Knowledge Application
Accessibility: Keyboard Navigation
Blooms: Remember
Di f f i c u l t y : 01 Easy
Learning Objective: 32-01 Define aggregate demand AD and explain how its downward
slope is the result of the real-balances effect, the interest-rate effect, and the foreign
purchases effect.
Test Bank: I
Topic: Aggregate Demand
140.
The real-balances effect indicates that inflation makes the public feel wealthier and
they therefore spend more out of their current incomes.
141.
Other things equal, an increase in productivity will shift the short-run aggregate supply
curve rightward.
142.
In the immediate short run, both input and output prices are fixed.