32–41
81.
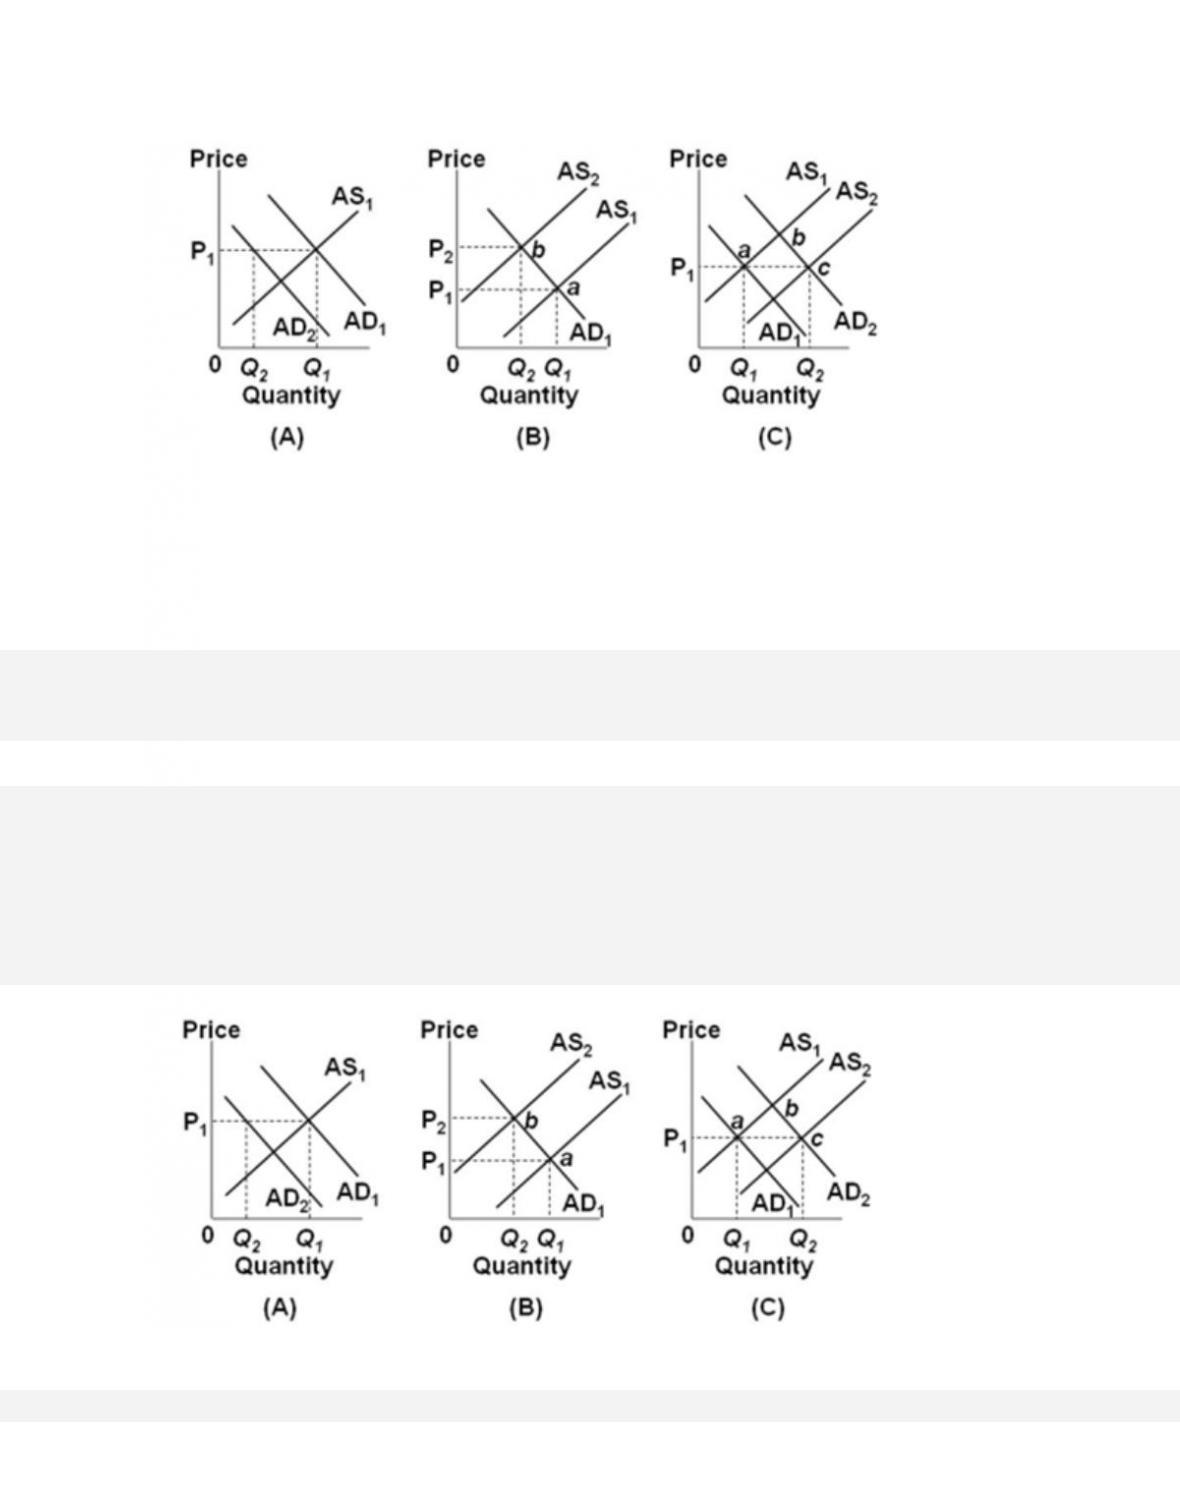
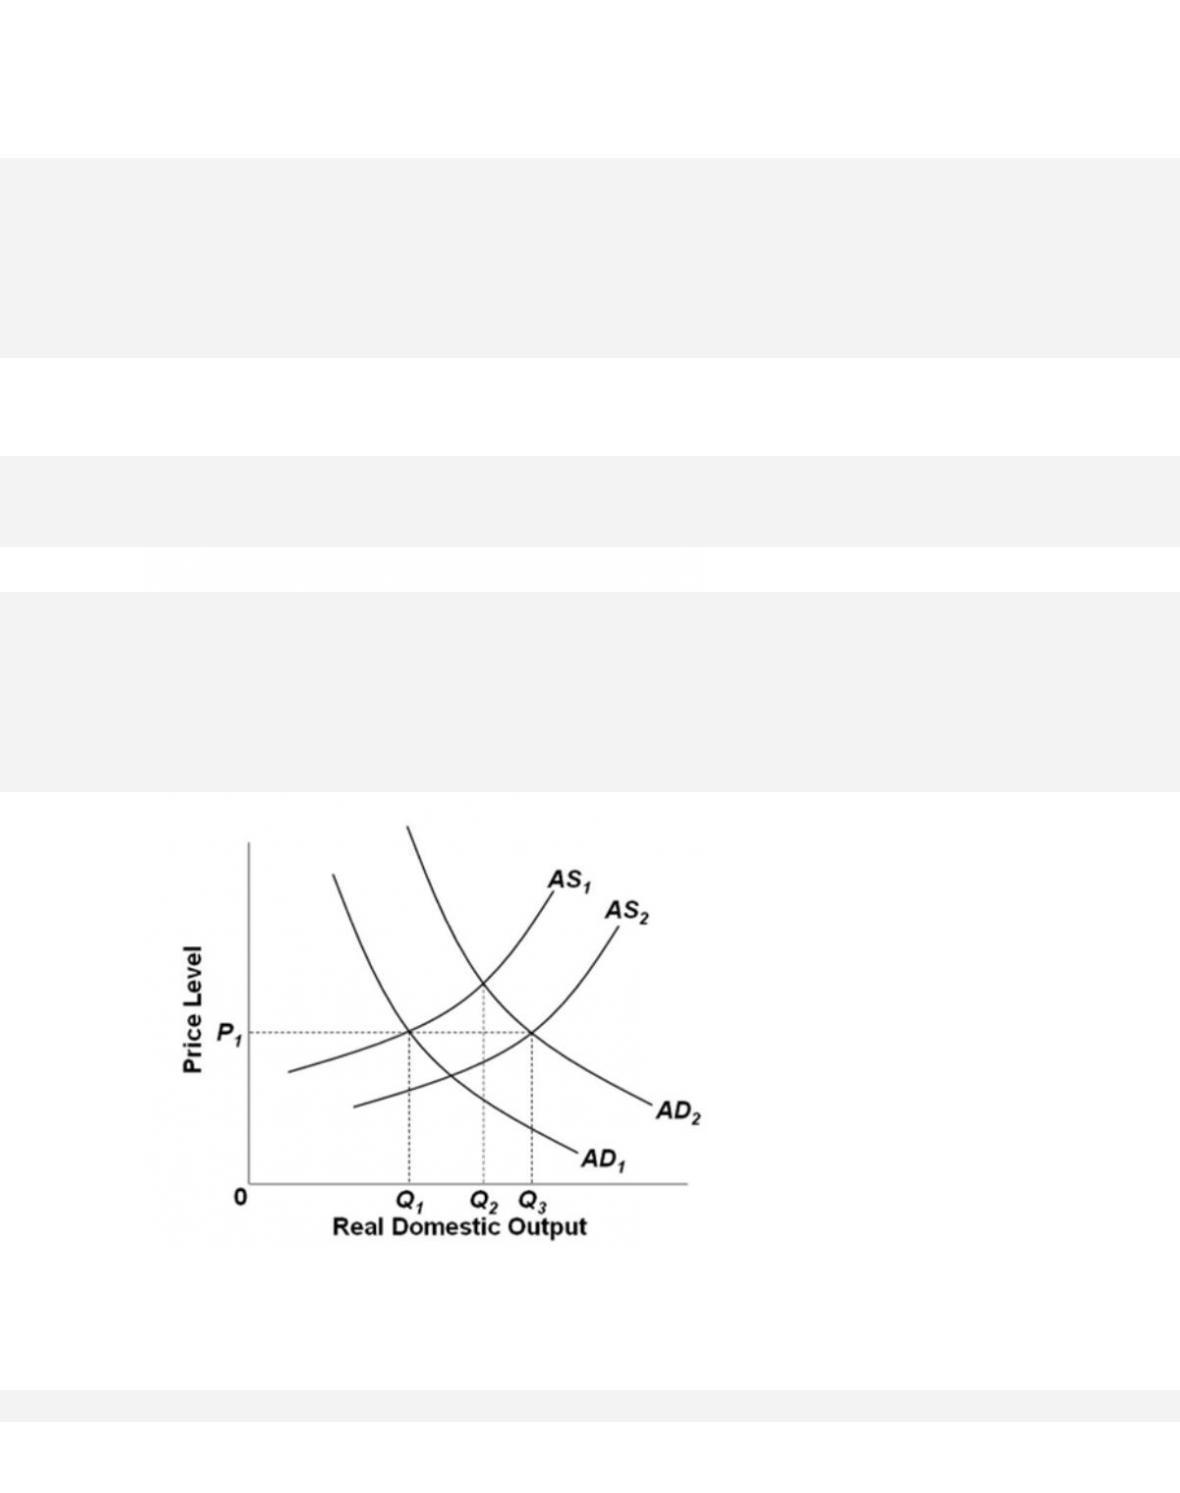
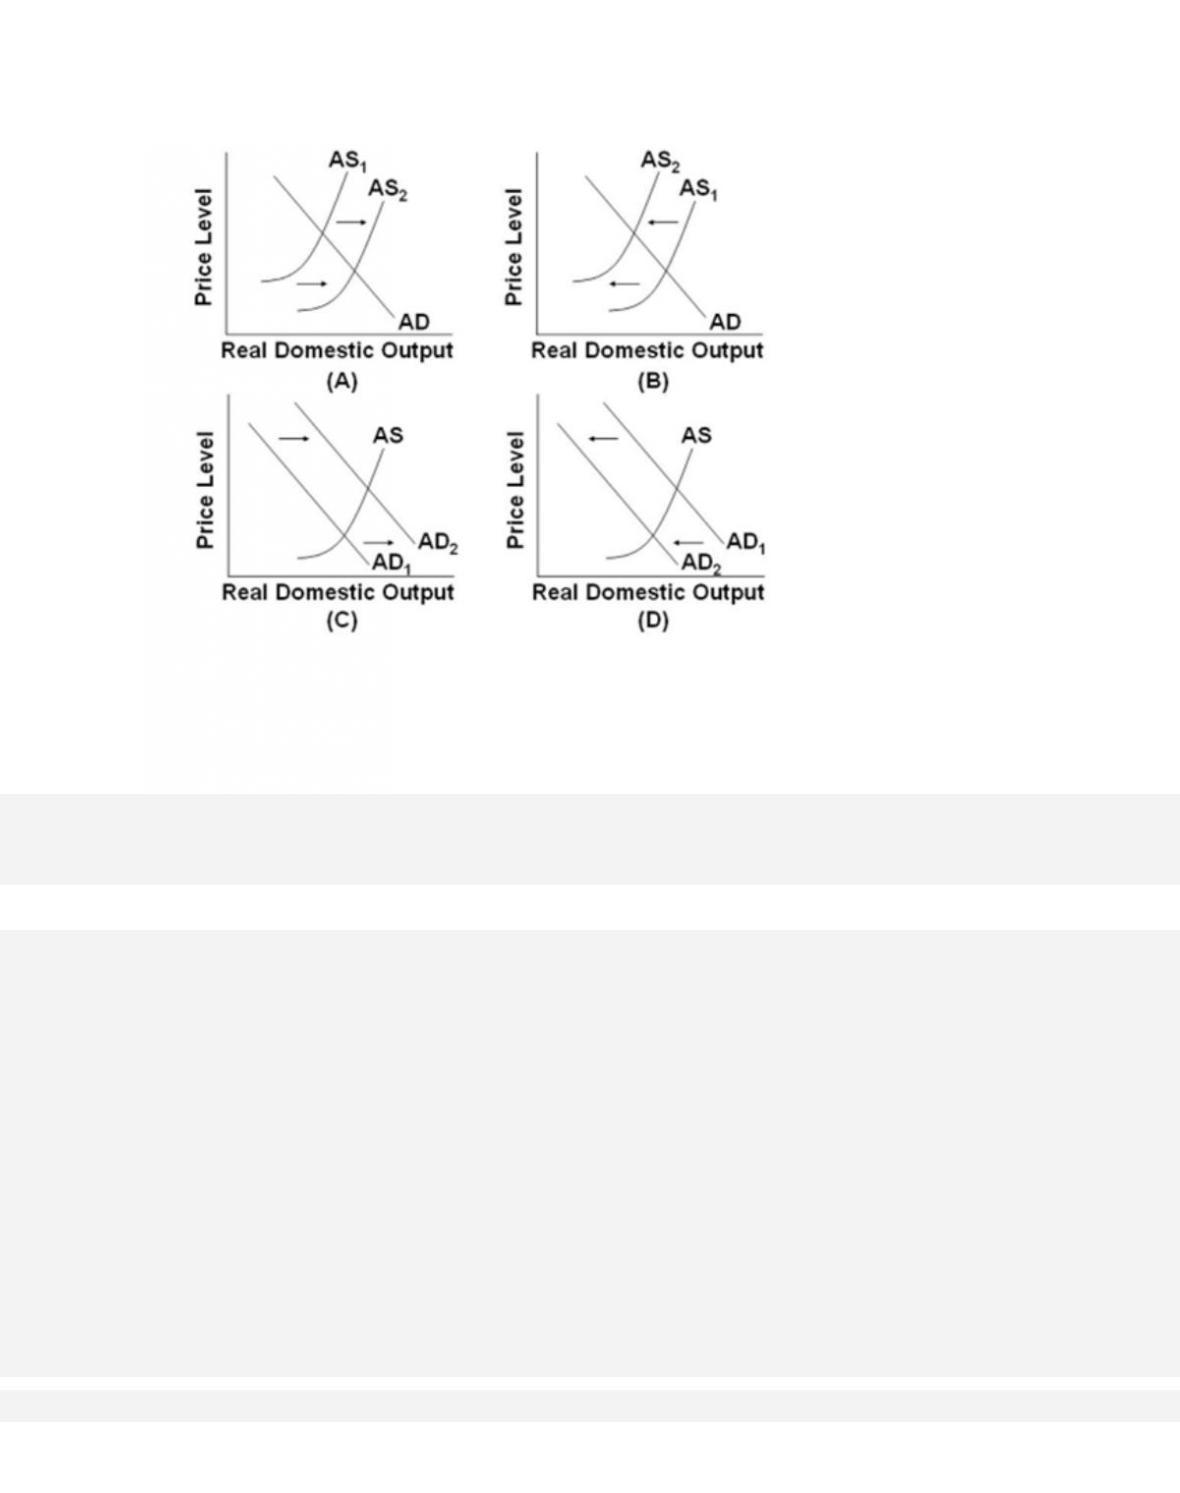
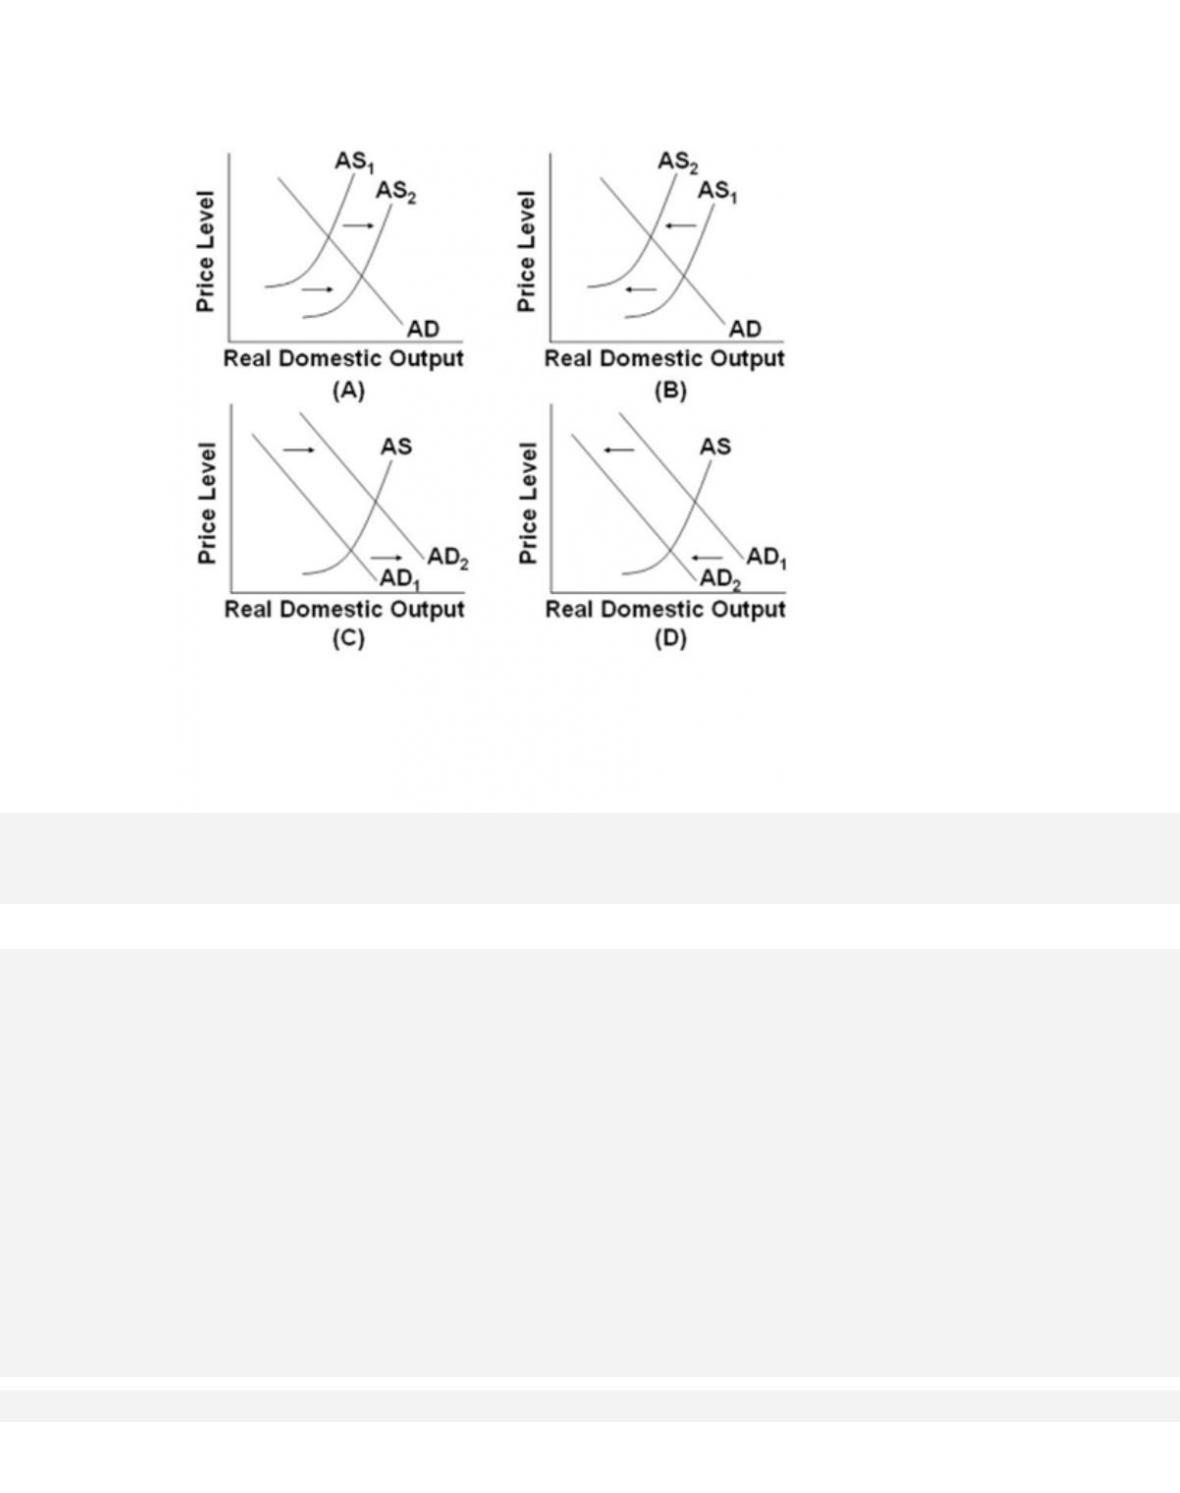
Refer to the diagrams, in which AD1 and AS1 are the “before” curves and AD2 and AS2 are
the “after” curves. Other things equal, a decline in net exports caused by a change in
incomes abroad is depicted by
82.
Refer to the diagrams, in which AD1 and AS1 are the “before” curves and AD2 and AS2 are
the “after” curves. Other things equal, a decline in net exports caused by the foreign
purchases effect of a price-level increase is depicted by the
83.
Refer to the diagrams, in which AD1 and AS1 are the “before” curves and AD2 and AS2 are
the “after” curves. Other things equal, a decline in investment spending caused by the
interest-rate effect of a price-level increase is depicted by the
32–43
Copyright © 2018 McGraw-Hill Education. All rights reserved. No reproduction or distribution without the prior
written consent of McGraw-Hill Education.
Blooms: Understand
Diffic ult y: 02 Medium
Learning Objective: 32-06 Describe how the AD-AS model explains periods of demand-
pull inflation, cost-push inflation, and recession.
Test Bank: I
Topic: Changes in Equilibrium
Type: Graph
84.
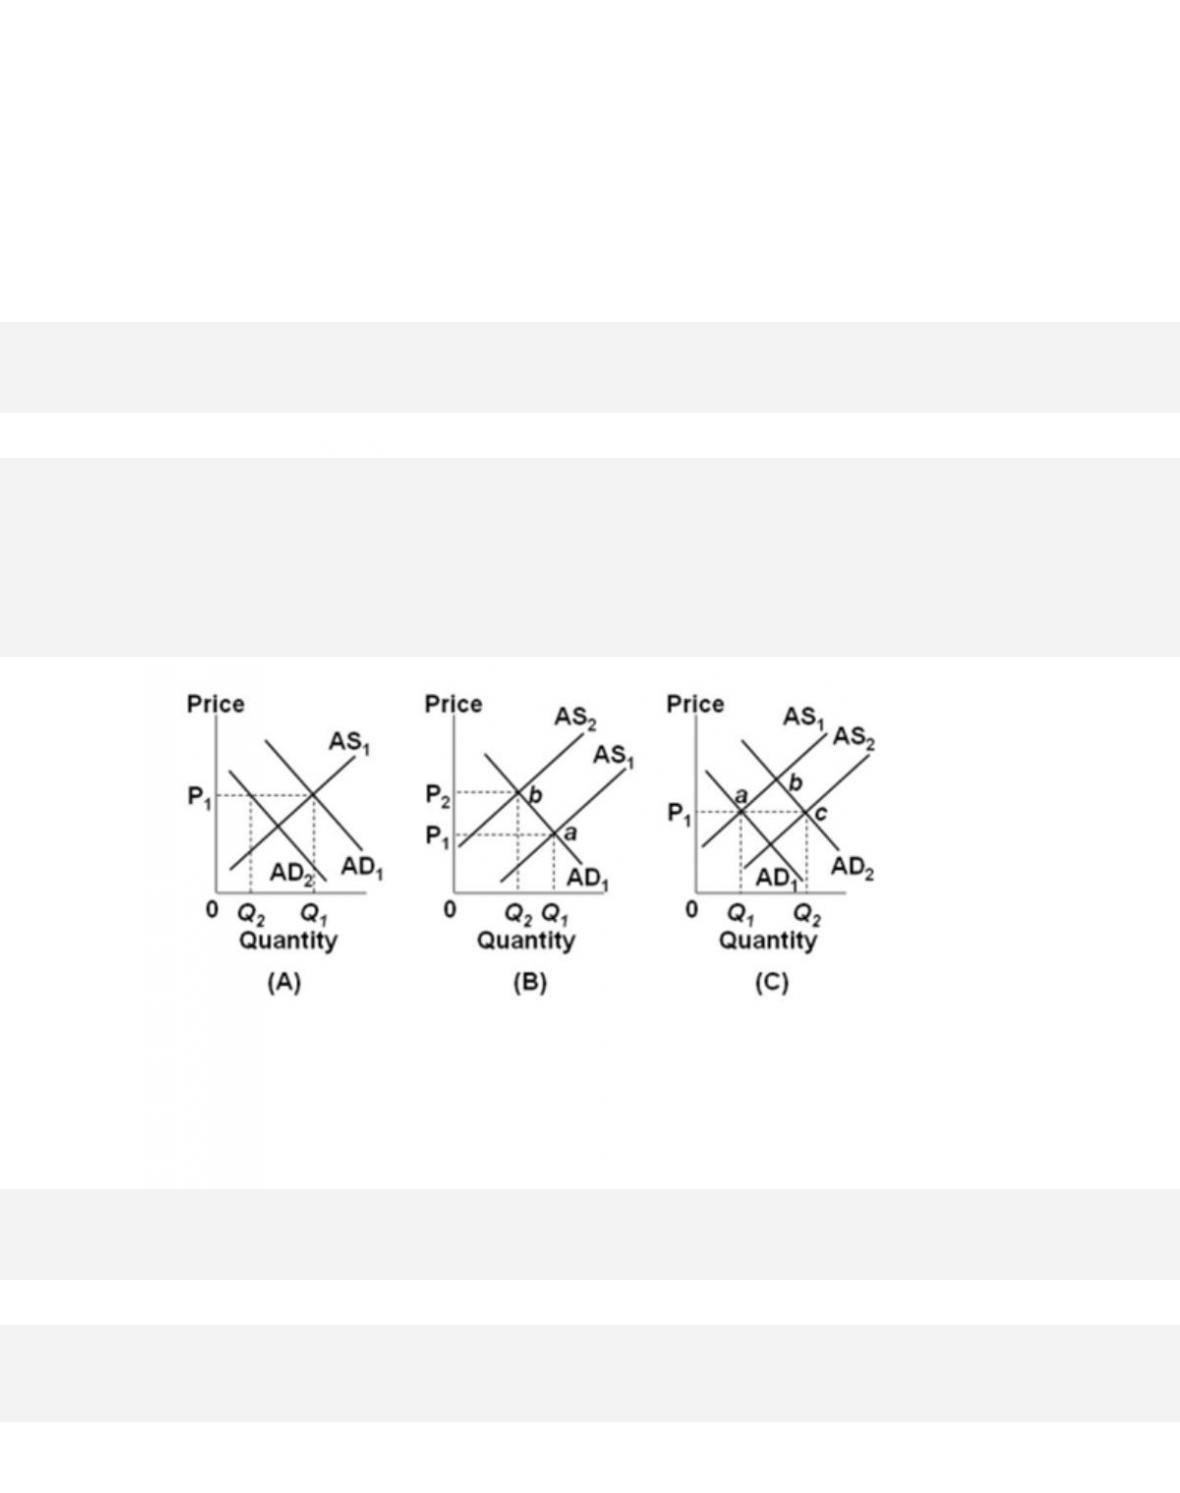
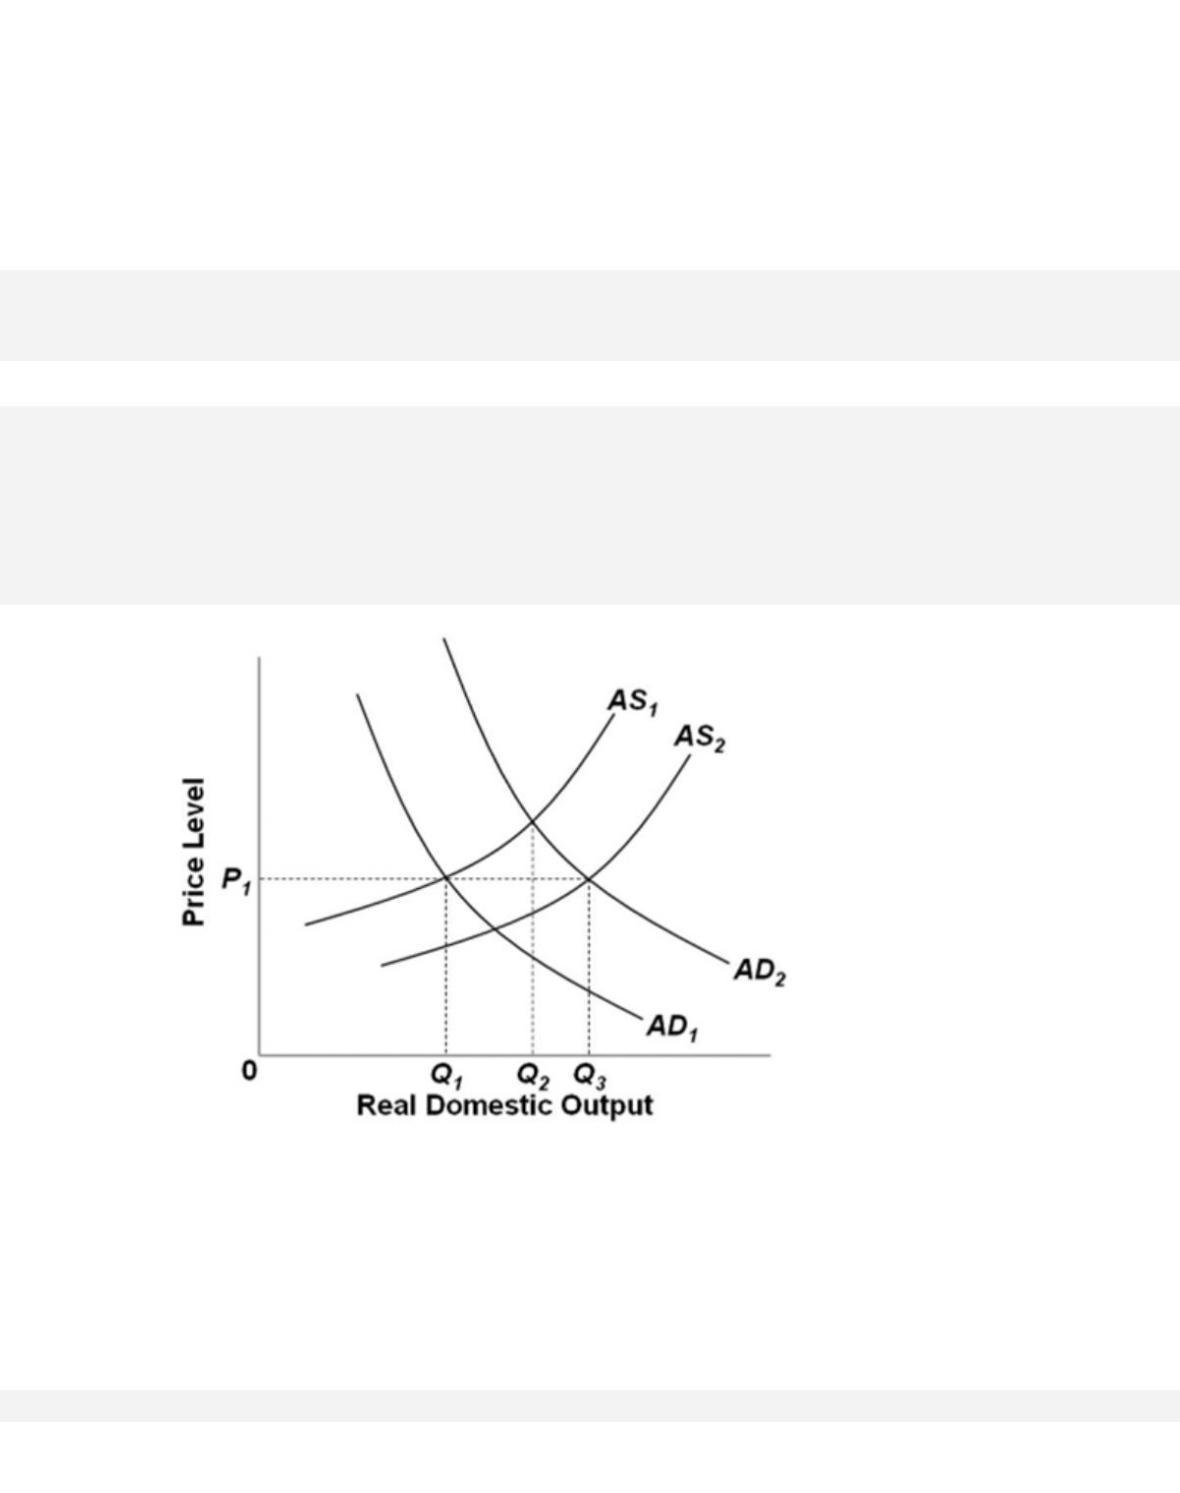
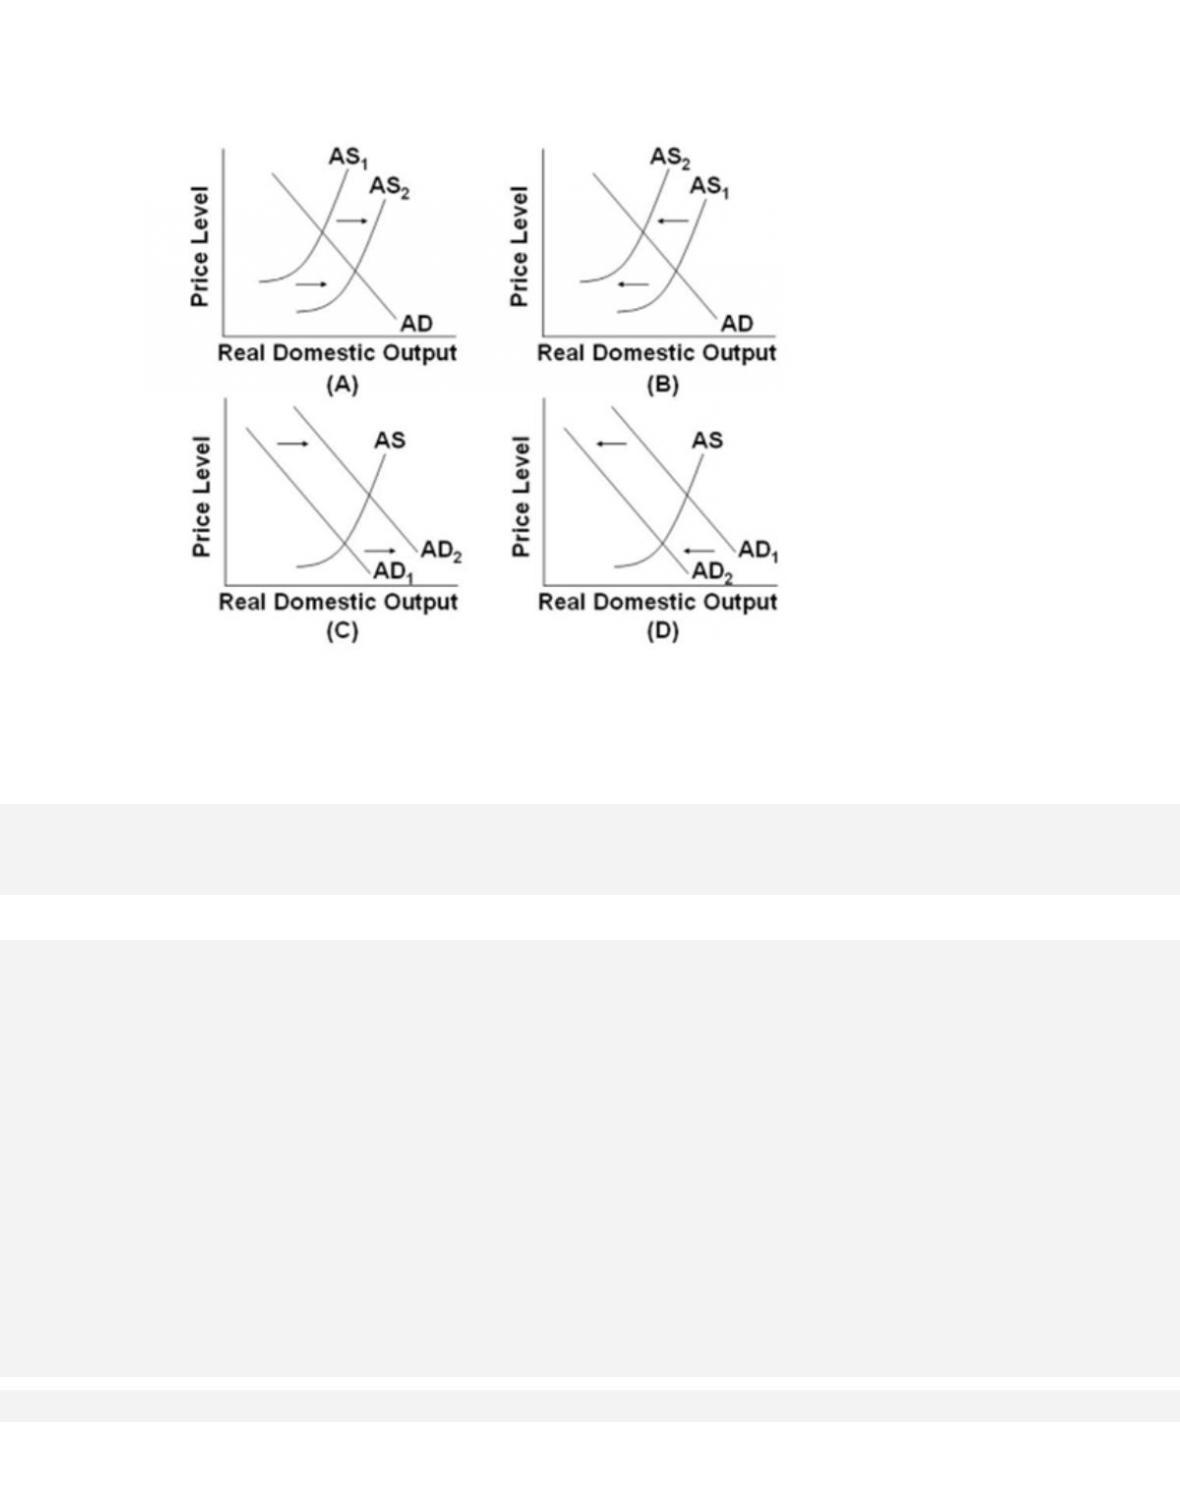
Refer to the diagrams, in which AD1 and AS1 are the “before” curves and AD2 and AS2 are
the “after” curves. Other things equal, a decrease in resource prices is depicted by
85.
Refer to the diagrams, in which AD1 and AS1 are the “before” curves and AD2 and AS2 are
the “after” curves. Other things equal, inflation is absent in
86.
If aggregate demand decreases, and, as a result, real output and employment decline but
the price level remains unchanged, it is most likely that

32–45
Copyright © 2018 McGraw-Hill Education. All rights reserved. No reproduction or distribution without the prior
written consent of McGraw-Hill Education.
pull inflation, cost-push inflation, and recession.
Test Bank: I
Topic: Changes in Equilibrium
87.
A rightward shift of the AD curve in the very steep upper part of the short–run AS curve
will
88.
A rightward shift of the AD curve in the very flat part of the short–run AS curve will
89.
Given a fixed upsloping AS curve, a rightward shift of the AD curve will
32–46
Copyright © 2018 McGraw-Hill Education. All rights reserved. No reproduction or distribution without the prior
written consent of McGraw-Hill Education.
AACSB: Knowledge Application
Accessibility: Keyboard Navigation
Blooms: Understand
Diffic ult y: 02 Medium
Learning Objective: 32-06 Describe how the AD-AS model explains periods of demand-
pull inflation, cost-push inflation, and recession.
Test Bank: I
Topic: Changes in Equilibrium
90.
A decrease in aggregate demand will cause a greater decline in real output the
91.
In the figure, AD1 and AS1 represent the original aggregate supply and demand curves, and
32–47
AD2 and AS2 show the new aggregate demand and supply curves. The change in
aggregate
supply from AS1 to AS2 could be caused by
92.
In the figure, AD1 and AS1 represent the original aggregate supply and demand curves, and
AD2 and AS2 show the new aggregate demand and supply curves. The changes in
aggregate demand and supply in the diagram produce
32–48
Copyright © 2018 McGraw-Hill Education. All rights reserved. No reproduction or distribution without the prior
written consent of McGraw-Hill Education.
A. a higher price level.
B.
an expansion of real output and a stable price level.
C.
an expansion of real output and a higher price level.
D.
a decline in real output and a stable price level.
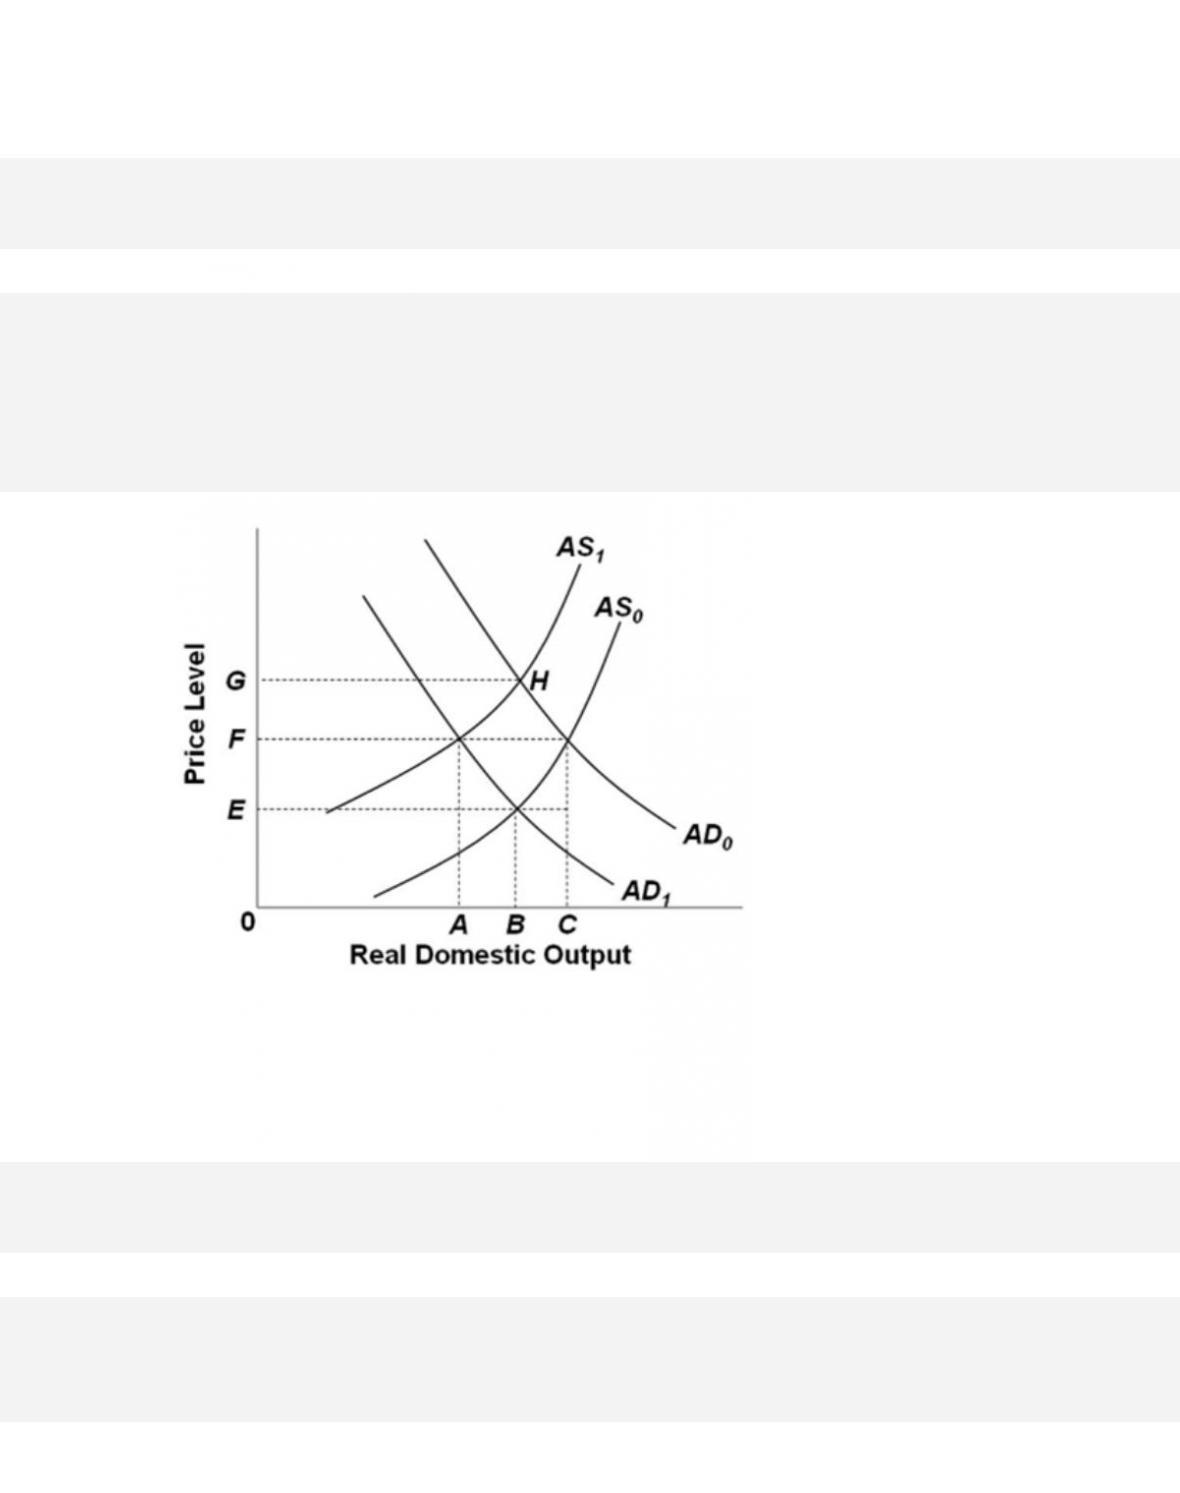
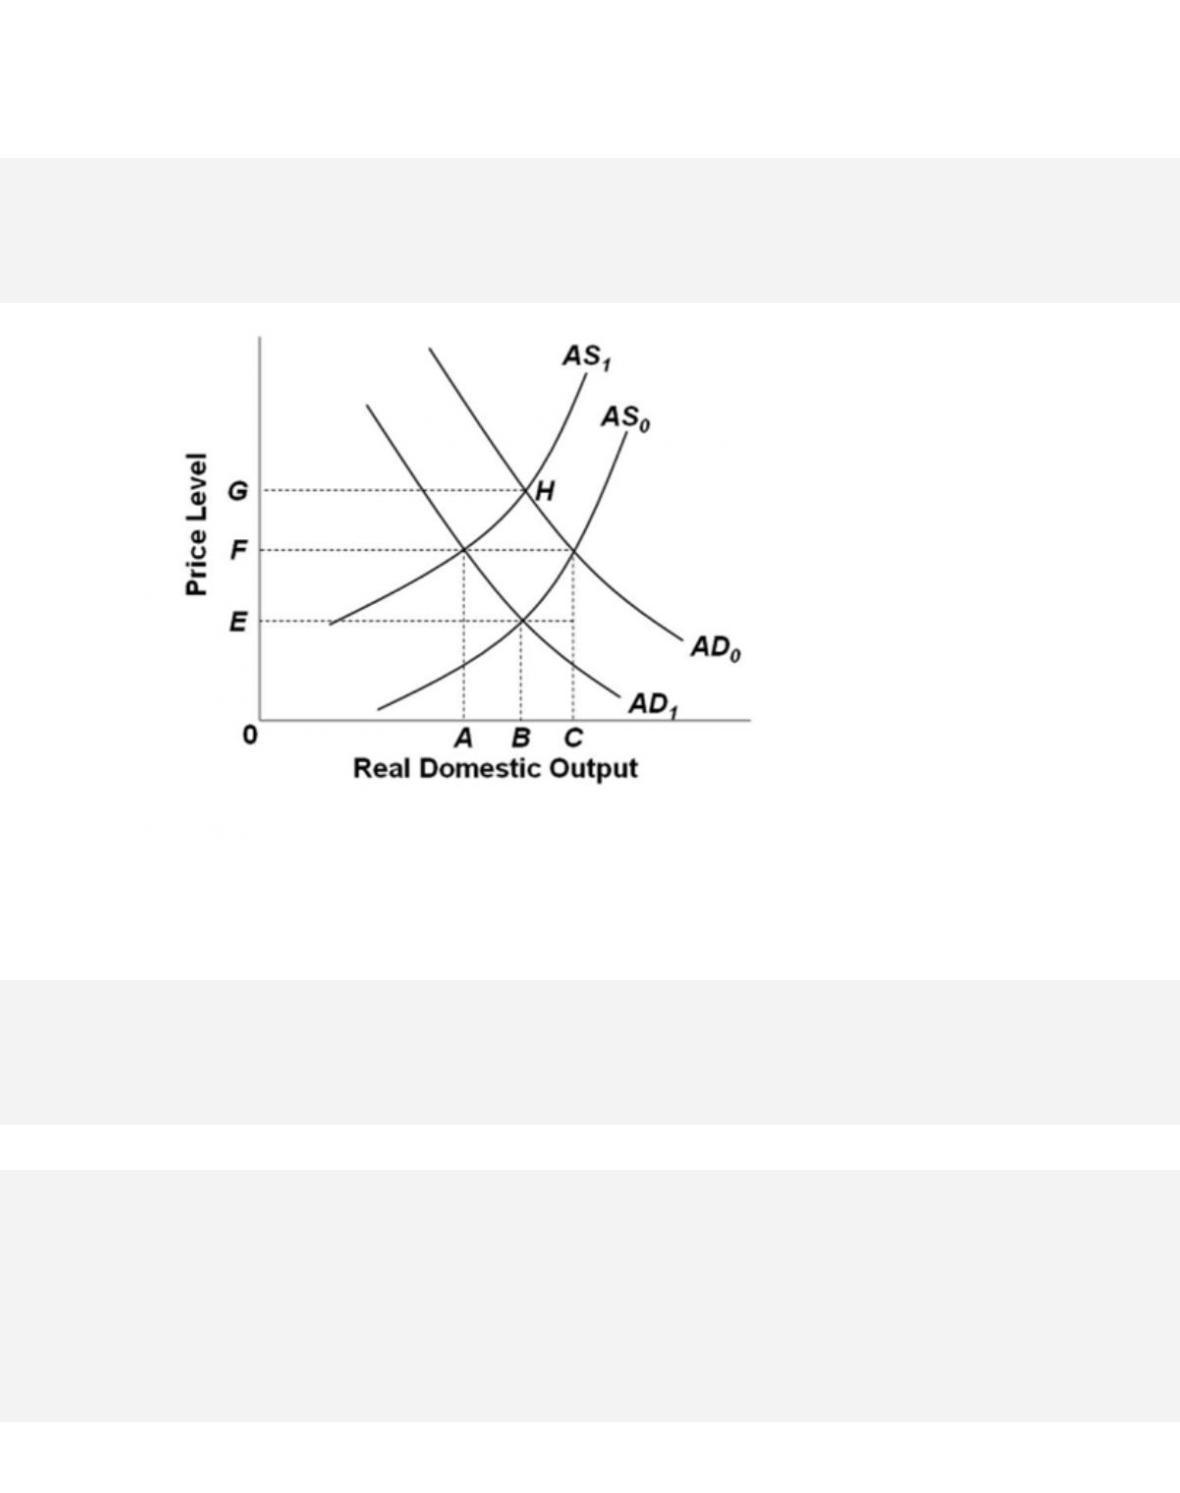
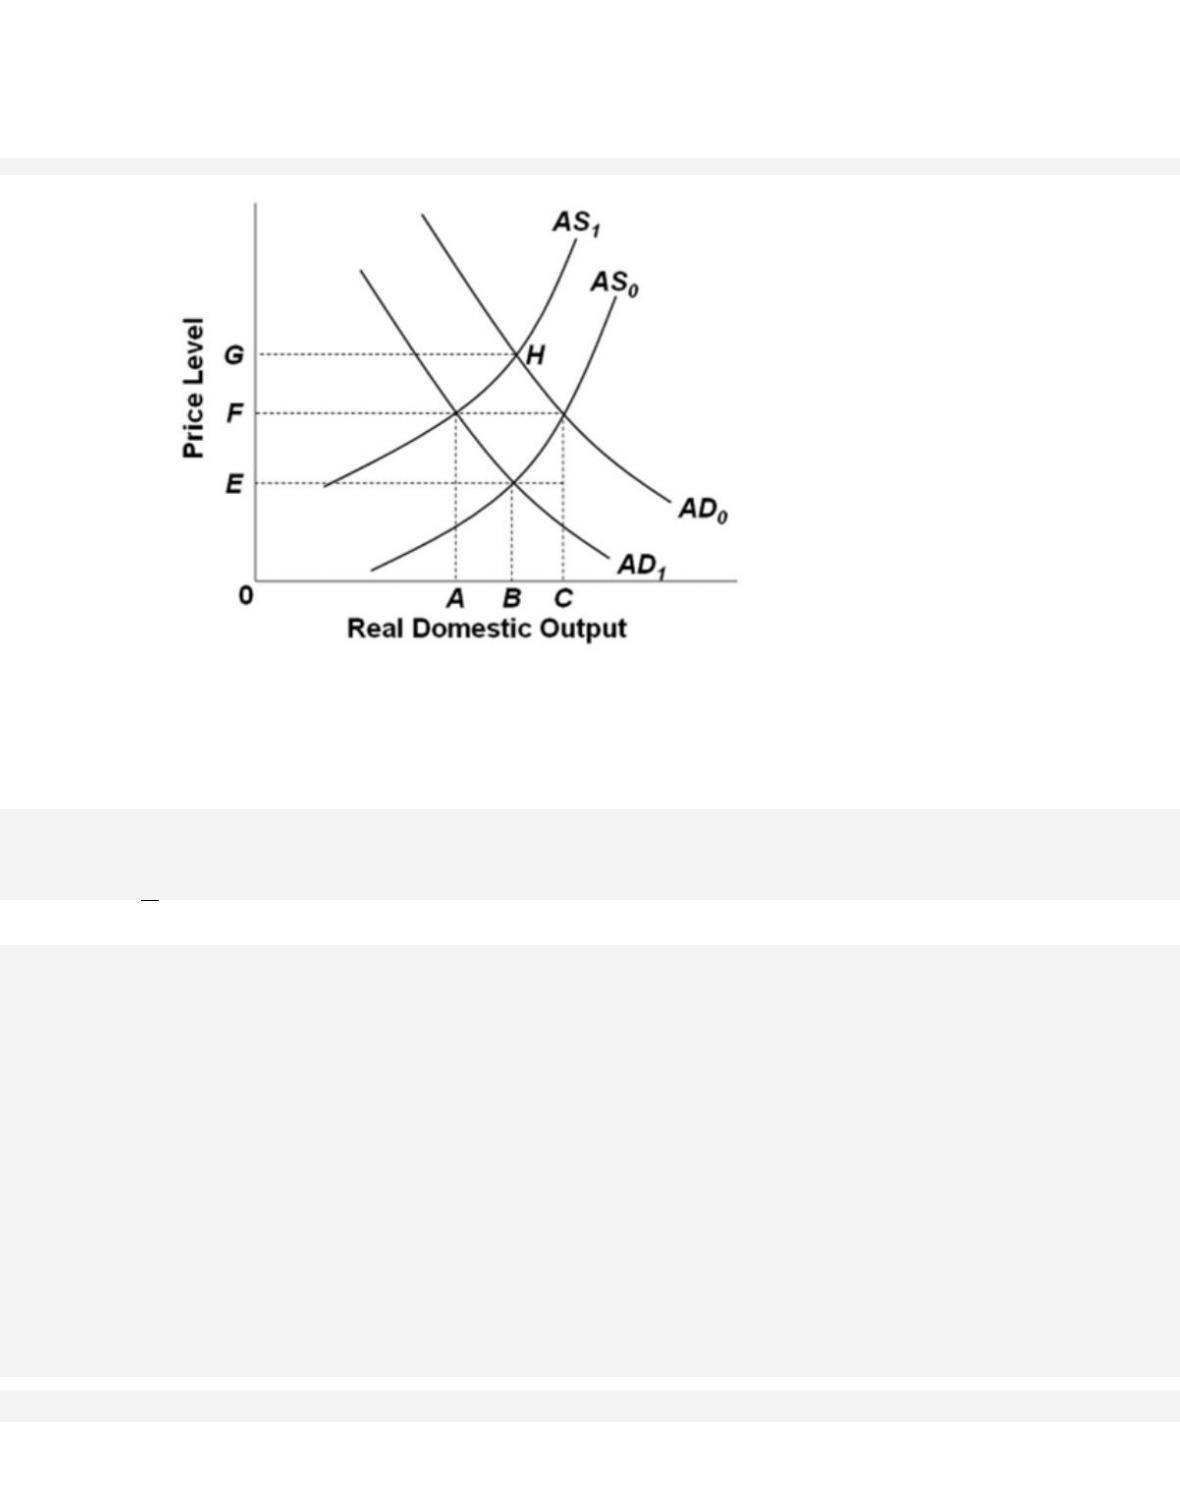
93.
Refer to the diagram. If the initial aggregate demand and supply curves are AD0 and AS0,
the equilibrium price level and level of real domestic output will be
32–49
Copyright © 2018 McGraw-Hill Education. All rights reserved. No reproduction or distribution without the prior
written consent of McGraw-Hill Education.
Diffic ult y: 02 Medium
Learning Objective: 32-05 Discuss how AD and AS determine an economys equilibrium
price level and level of real GDP.
Test Bank: I
Topic: Equilibrium in the AD–AS Model
Type: Graph
94.
Refer to the diagram. If the aggregate supply curve shifted from AS0 to AS1 and the
aggregate demand curve remains at AD0, we could say that
32–50
Copyright © 2018 McGraw-Hill Education. All rights reserved. No reproduction or distribution without the prior
written consent of McGraw-Hill Education.
Type: Graph
95.
Refer to the diagram. If aggregate supply is AS1 and aggregate demand is AD0, then
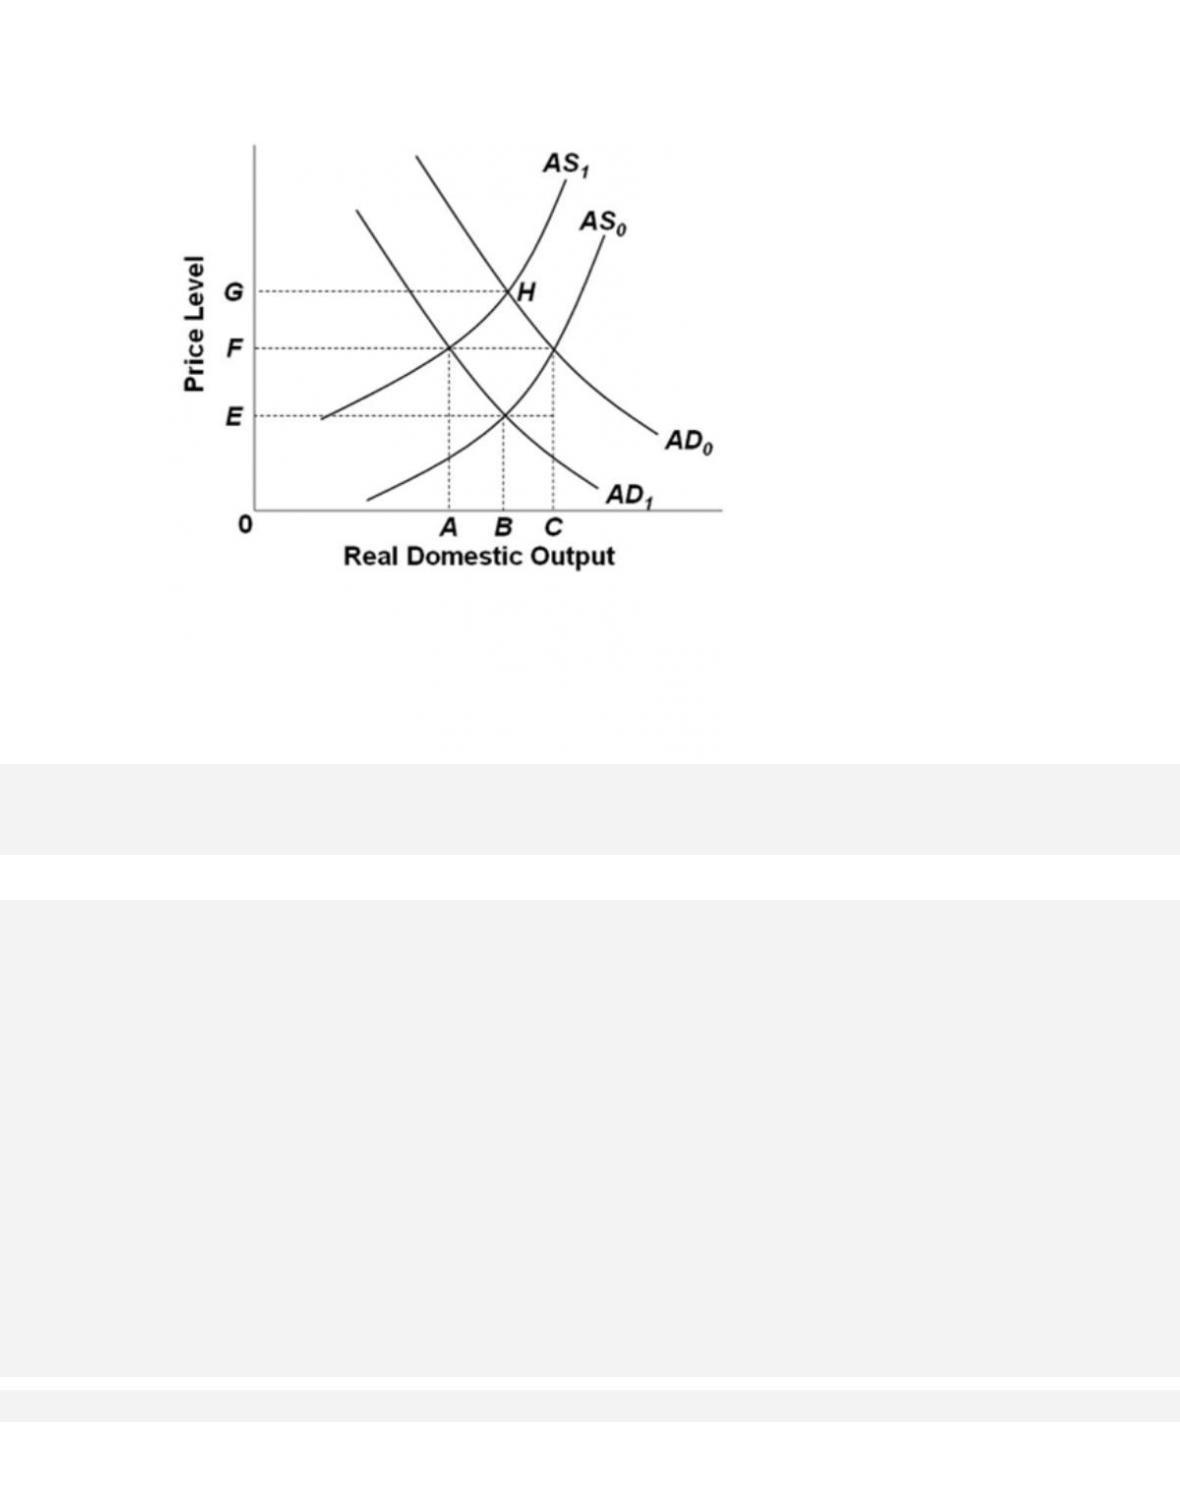
96.
Refer to the diagram. A shift of the aggregate demand curve from AD1 to AD0 might be
caused by a(n)
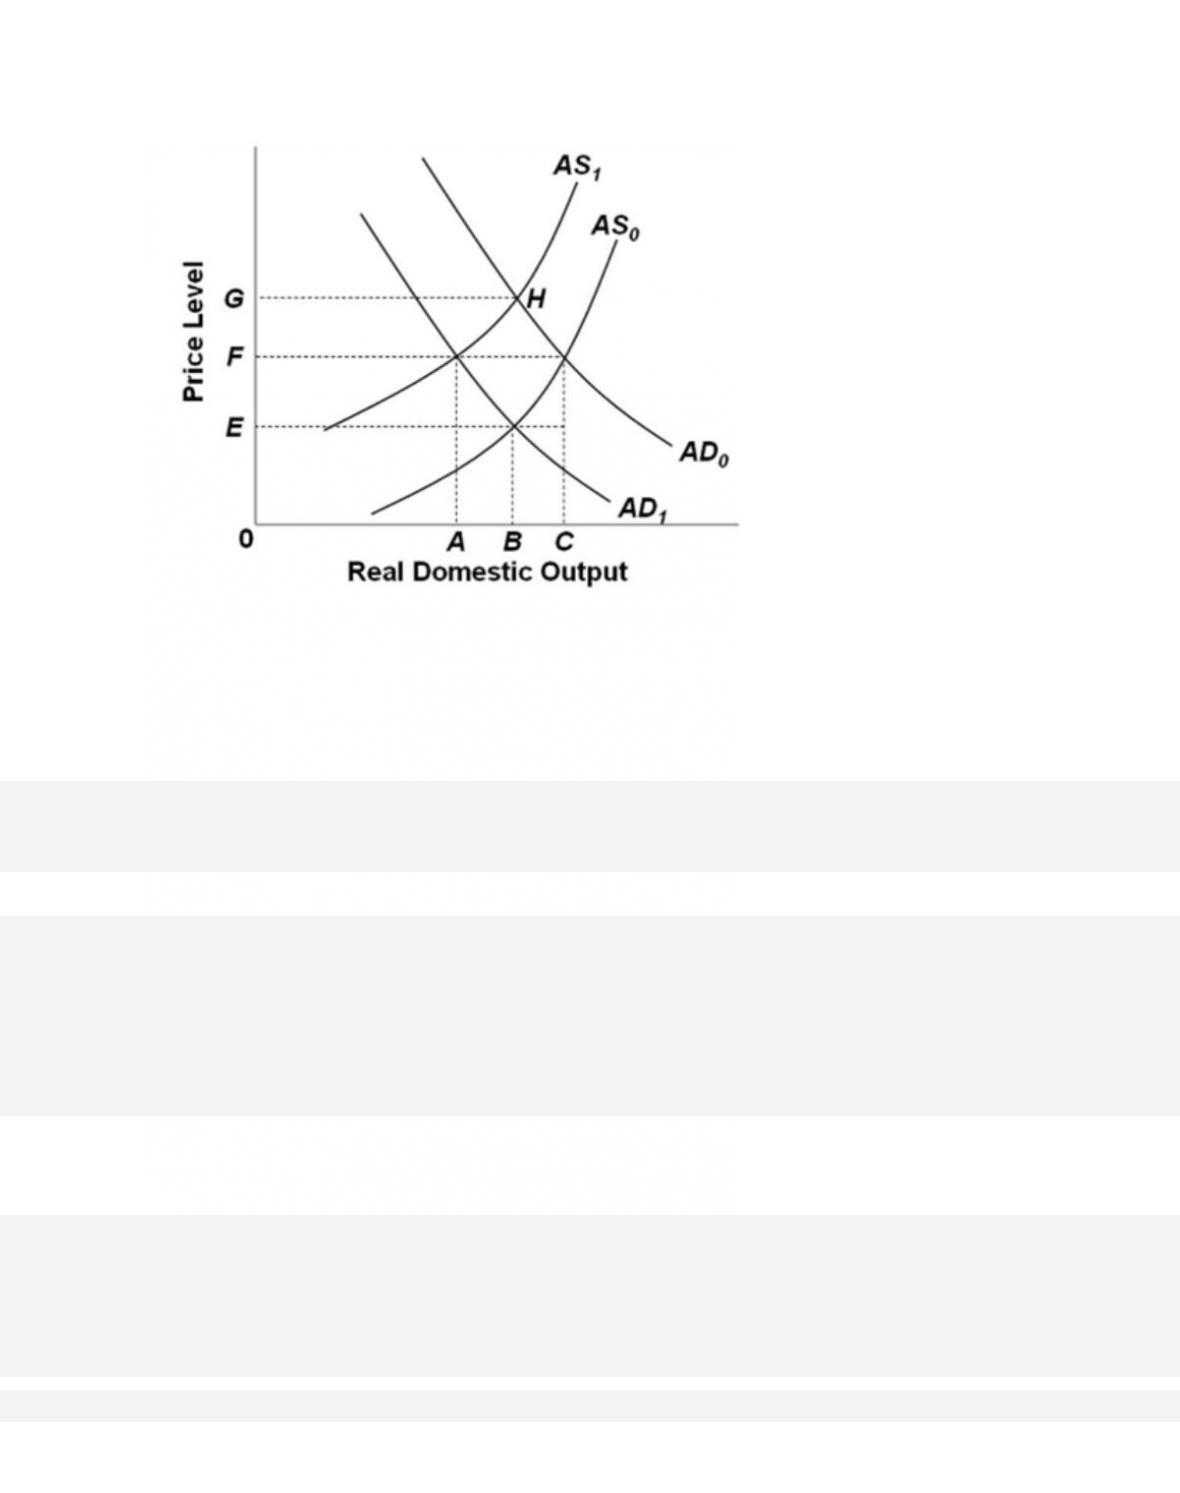
97.
Refer to the diagram. Other things equal, a shift of the aggregate supply curve from AS0 to
AS1 might be caused by a(n)
98.
If aggregate demand increases and aggregate supply decreases, the price level

32–53
Copyright © 2018 McGraw-Hill Education. All rights reserved. No reproduction or distribution without the prior
written consent of McGraw-Hill Education.
AACSB: Knowledge Application
Accessibility: Keyboard Navigation
Blooms: Understand
Diffic ult y: 02 Medium
Learning Objective: 32-06 Describe how the AD-AS model explains periods of demand-
pull inflation, cost-push inflation, and recession.
Test Bank: I
Topic: Changes in Equilibrium
99.
If the dollar price of foreign currencies falls (that is, the dollar appreciates), we would
expect
100.
An increase in input productivity will
101.
If personal taxes were decreased and resource productivity increased simultaneously,
the equilibrium

102.
In which of the following sets of circumstances can we confidently expect inflation?
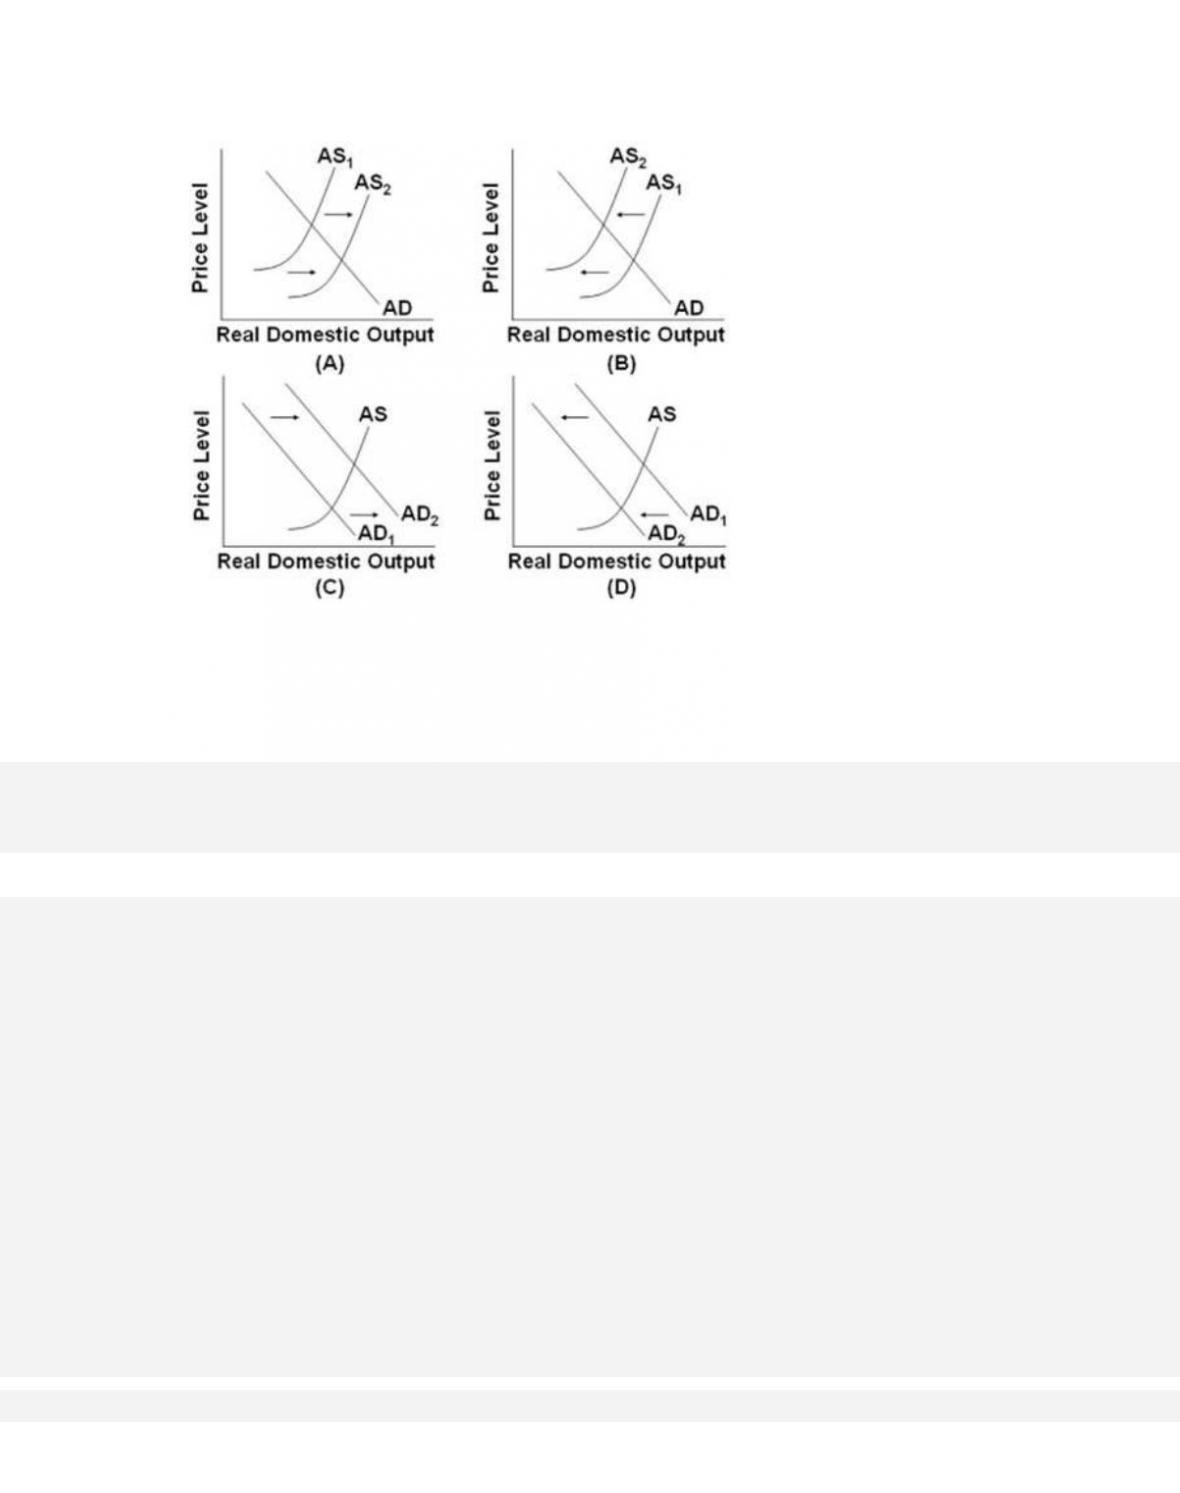
103.
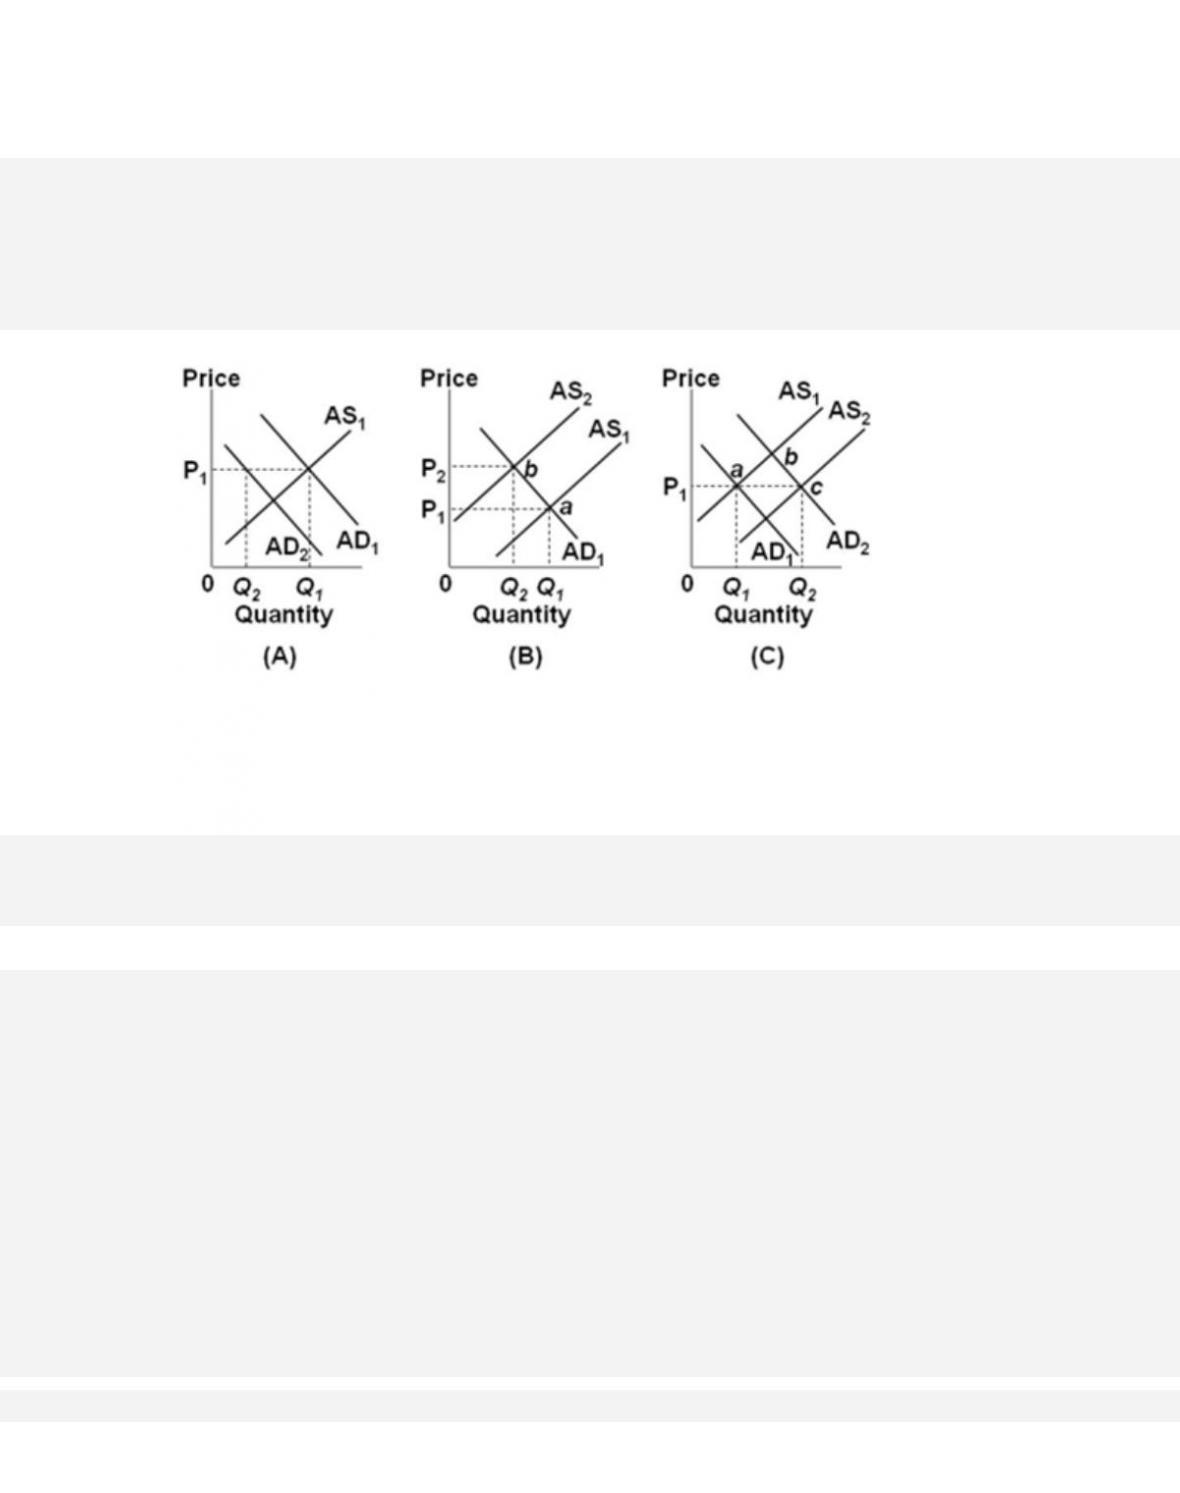
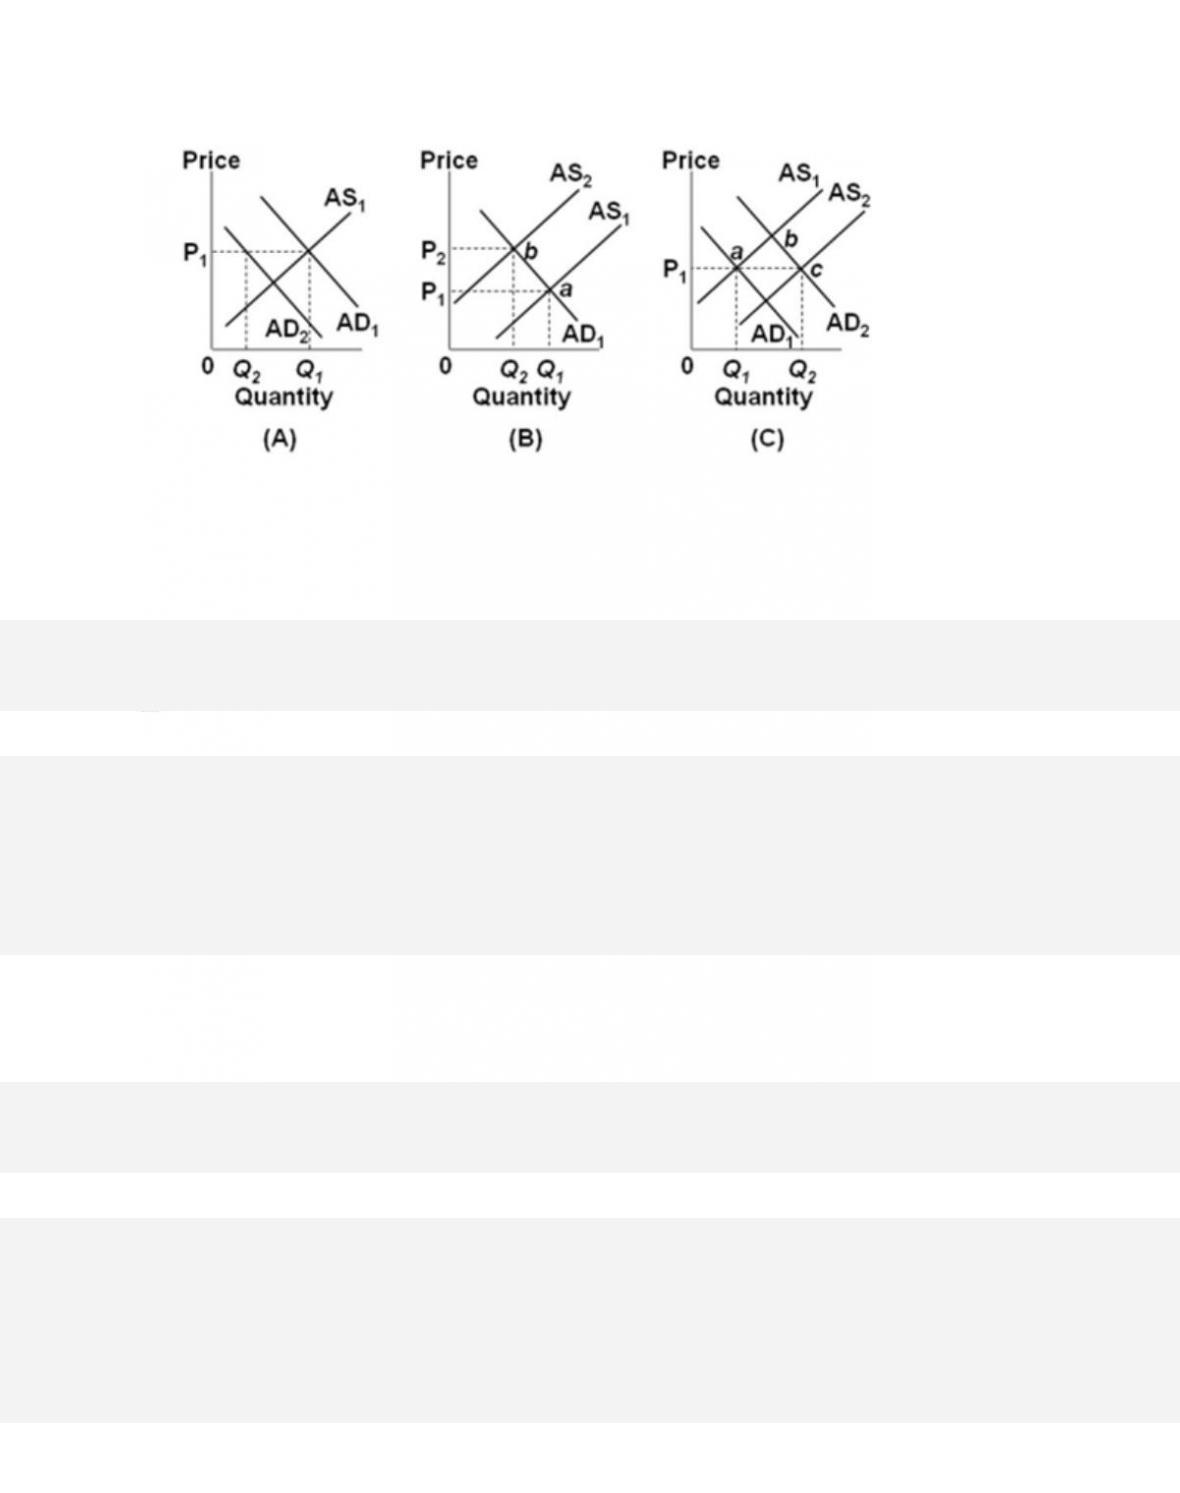
Which of the diagrams for the U.S. economy best portrays the effects of an increase in
resource productivity?
104.
Which of the diagrams for the U.S. economy best portrays the effects of a decrease in the
availability of key natural resources?
105.
Which of the diagrams for the U.S. economy best portrays the effects of an increase in
foreign spending on U.S. products?
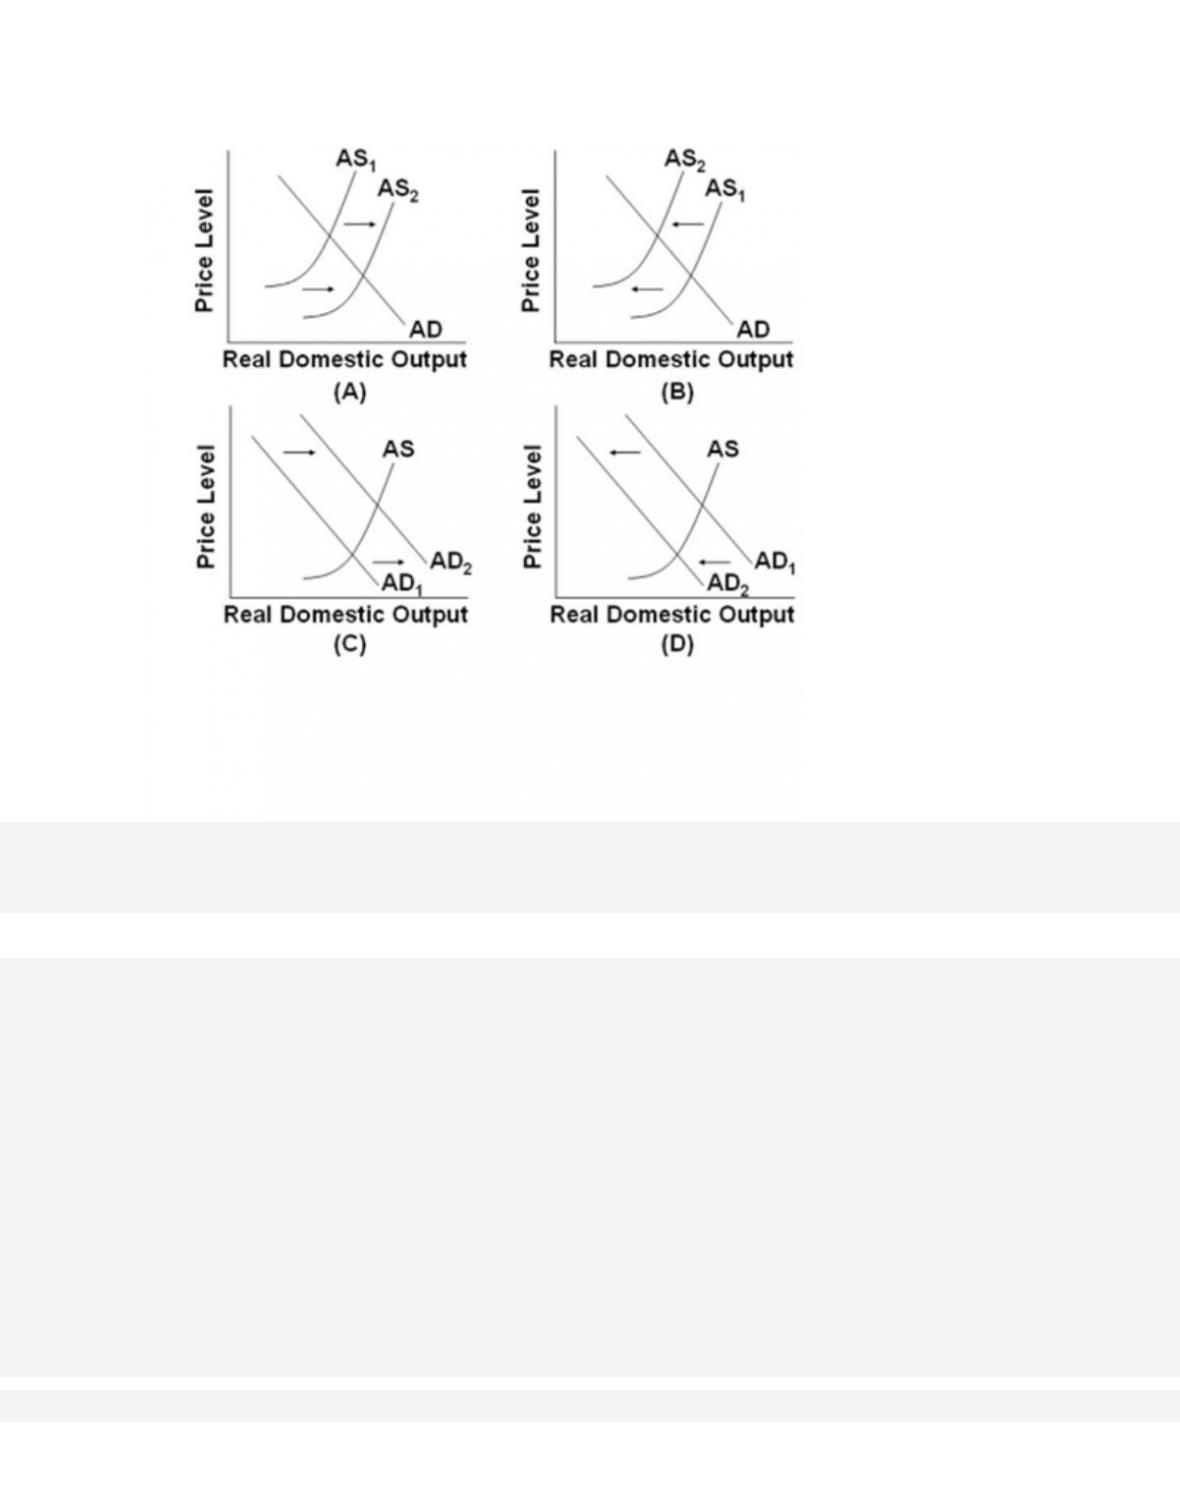
106.
Which of the diagrams for the U.S. economy best portrays an improvement in expected rates
of return on investment?
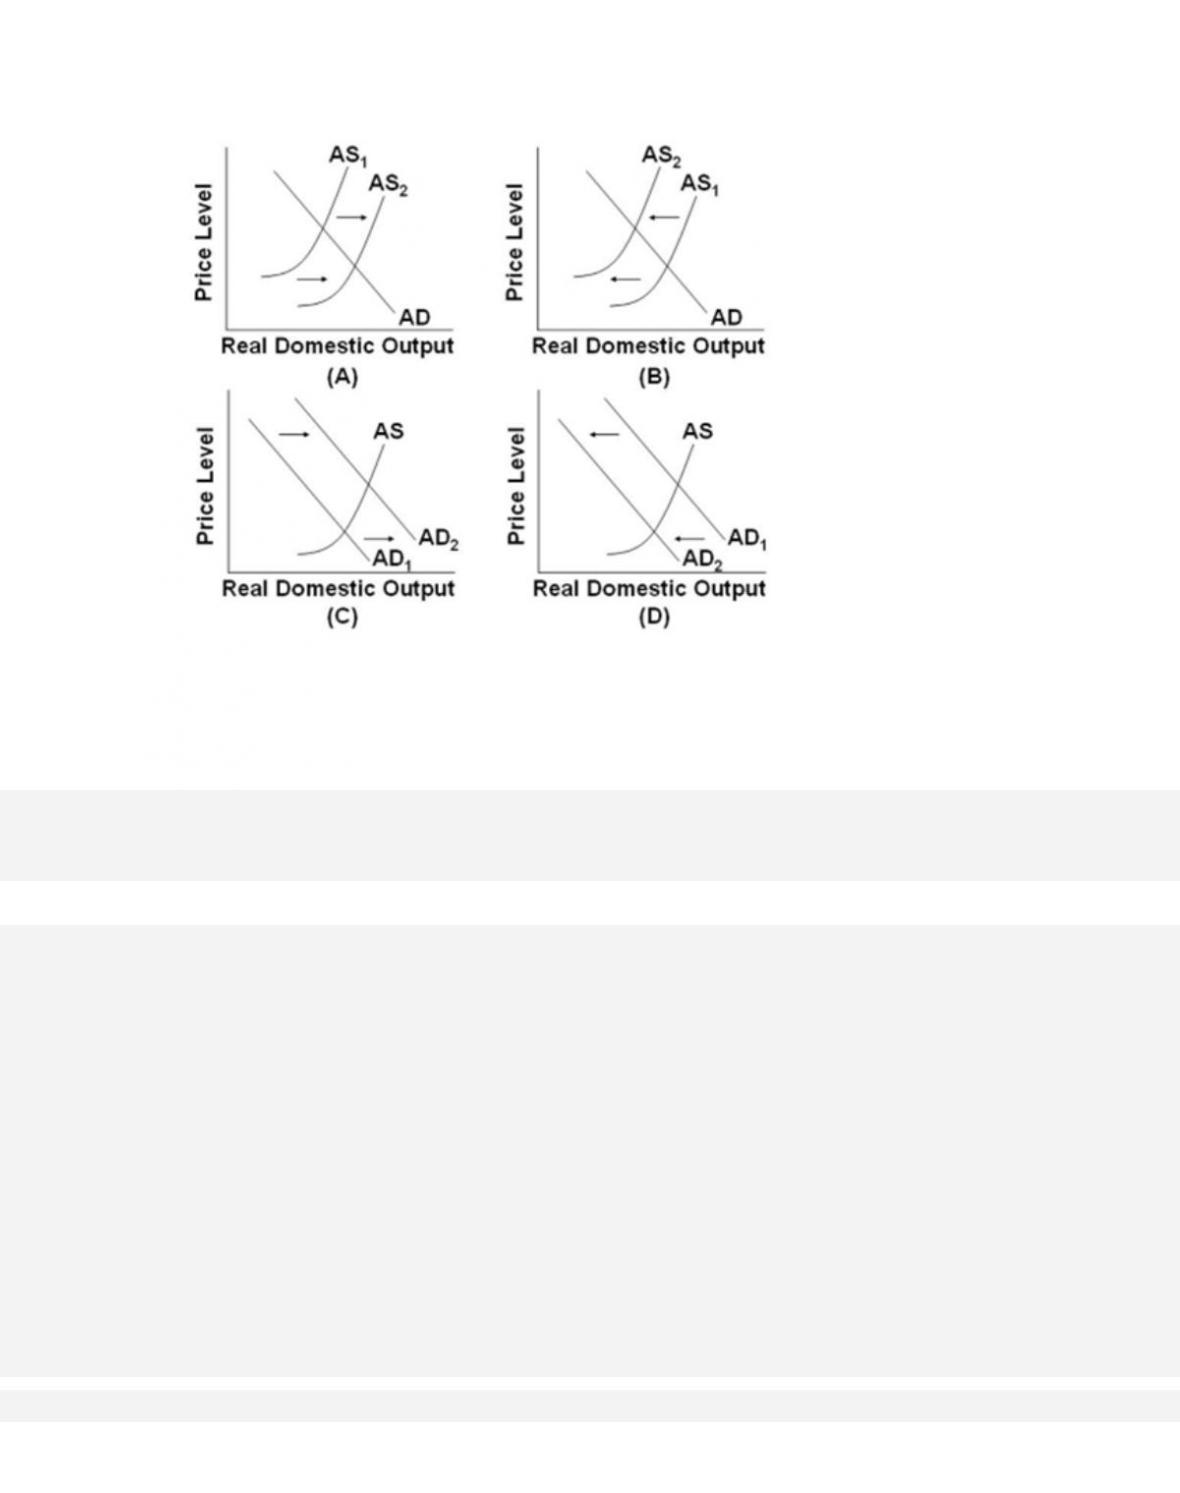
107.
Which of the diagrams for the U.S. economy best portrays the effects of declines in the
incomes of U.S. trading partners?
108.
Which of the diagrams for the U.S. economy best portrays the effects of declines in the
prices of imported resources?