
32–21
Copyright © 2018 McGraw-Hill Education. All rights reserved. No reproduction or distribution without the prior
written consent of McGraw-Hill Education.
D. $5.
44.
Suppose that real domestic output in an economy is 20 units, the quantity of inputs is 10,
and the price of each input is $4. All else being equal, if the price of each input increased
from $4 to $6, productivity would
45.
Suppose that real domestic output in an economy is 20 units, the quantity of inputs is 10,
and the price of each input is $4. Given an increase in input price from $4 to $6, we would
expect the aggregate

46.
Other things equal, if the U.S. dollar were to depreciate, the
47.
Which one of the following would increase per-unit production cost and therefore shift
the aggregate supply curve to the left?
48.
An economy is employing 2 units of capital, 5 units of raw materials, and 8 units of
labor to produce its total output of 640 units. Each unit of capital costs $10; each unit of raw
materials, $4; and each unit of labor, $3. The per-unit cost of production in this economy is

32–23
Copyright © 2018 McGraw-Hill Education. All rights reserved. No reproduction or distribution without the prior
written consent of McGraw-Hill Education.
Dif fic ult y: 01 Easy
Learning Objective: 32-03 Define aggregate supply AS and explain how it differs in the
immediate short run, the short run, and the long run.
Test Bank: I
To pic: Aggregate Supply
49.
An economy is employing 2 units of capital, 5 units of raw materials, and 8 units of
labor to produce its total output of 640 units. Each unit of capital costs $10; each unit of raw
materials, $4; and each unit of labor, $3. If the per-unit price of raw materials rises from $4
to $8 and all else remains constant, the per–unit cost of production will rise by about
50.
An economy is employing 2 units of capital, 5 units of raw materials, and 8 units of
labor to produce its total output of 640 units. Each unit of capital costs $10; each unit of raw
materials, $4; and each unit of labor, $3. If the per-unit price of raw materials rises from $4
to $8 and all else remains constant, the aggregate
51.
The determinants of aggregate supply

52.
Which of the following would not shift the aggregate supply curve?
53.
Productivity measures

54.
Per-unit production cost is
55.
Suppose that nominal wages fall and productivity rises in a particular economy. Other
things equal, the aggregate
56.
Other things equal, appreciation of the dollar

32–26
Copyright © 2018 McGraw-Hill Education. All rights reserved. No reproduction or distribution without the prior
written consent of McGraw-Hill Education.
Accessibility: Keyboard Navigation
Blooms: Understand
Di ffi culty: 02 Medium
Learning Objective: 32-02 Explain the factors that cause changes shifts in AD. Learning
Objective: 32-04 Explain the factors that cause changes shifts in AS.
Test Bank: I
To pic: Changes in Aggregate Demand
T o p i c : Changes in Aggregate Supply
57.
Other things equal, a reduction in personal and business taxes can be expected to
58.
Other things equal, an improvement in productivity will
59.
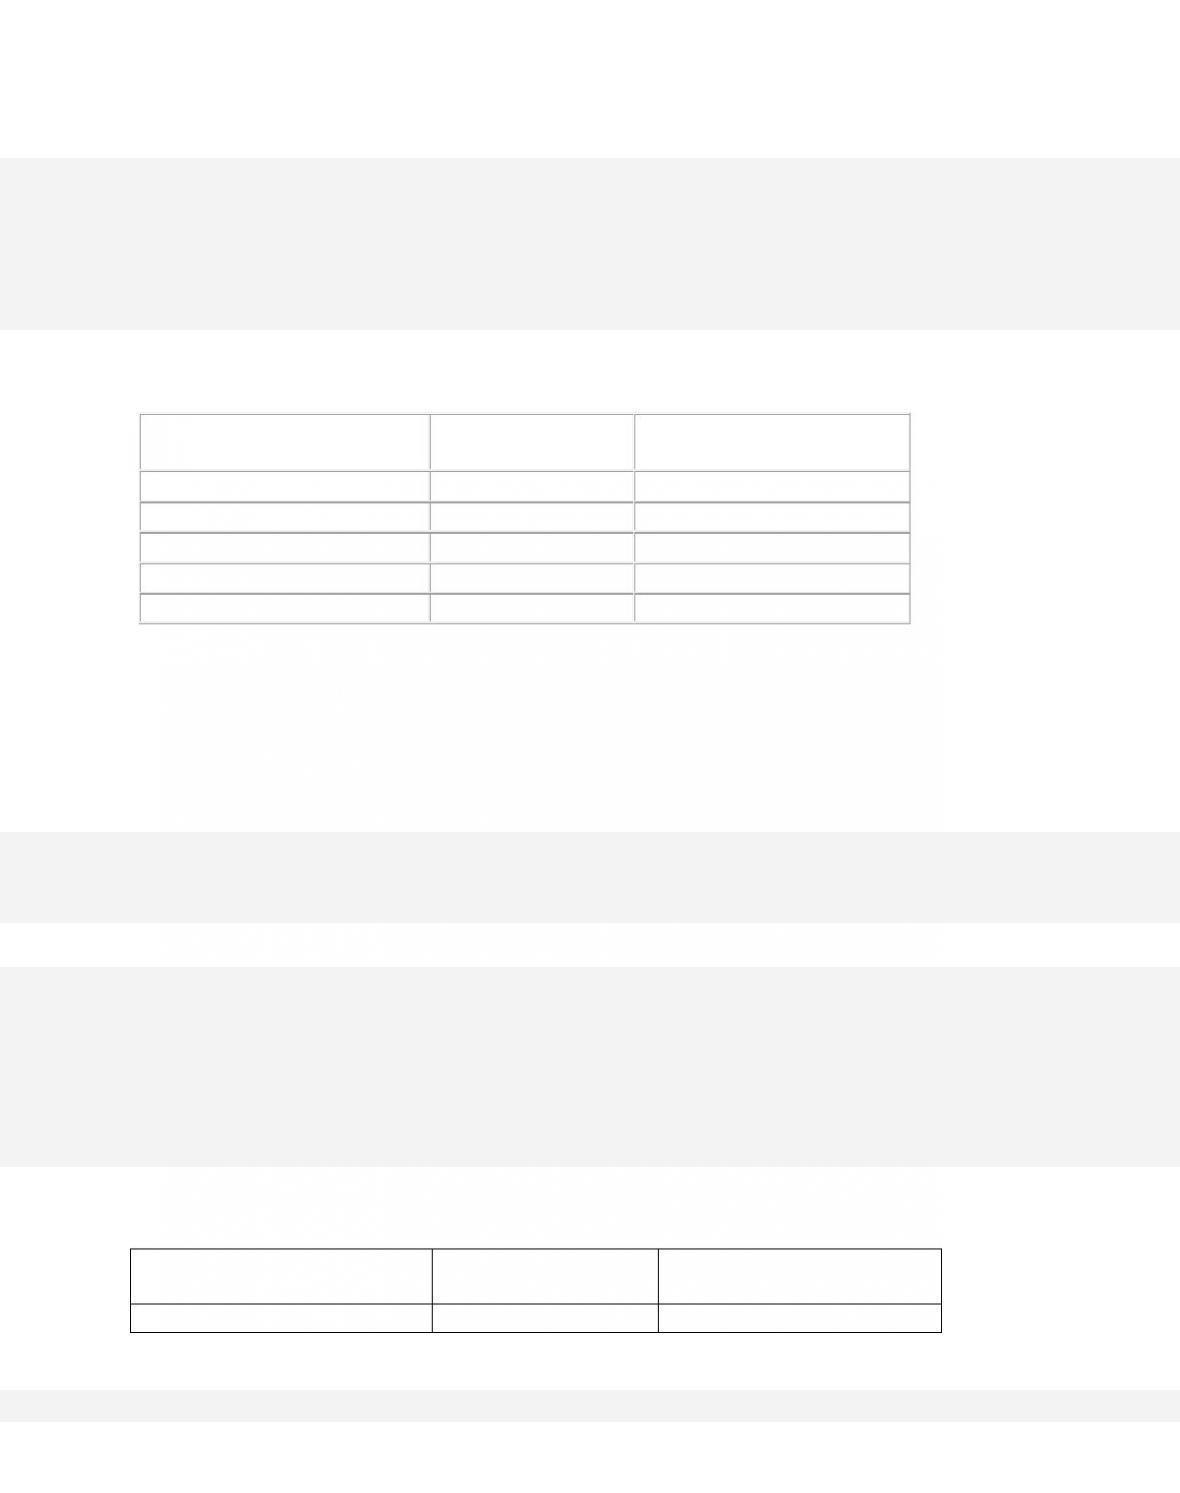
Input Quantity
Real Domestic Output

100
200
150
300
200
400
The table gives information about the relationship between input quantities and real
domestic output in a hypothetical economy. The level of productivity in the economy is
60.
Input Quantity
Real Domestic Output
100
200
150
300
200
400
The table gives information about the relationship between input quantities and real
domestic output in a hypothetical economy. If the price of each input is $5, the per-unit cost
of
production in the economy is
32–28
Copyright © 2018 McGraw-Hill Education. All rights reserved. No reproduction or distribution without the prior
written consent of McGraw-Hill Education.
Learning Objective: 32-03 Define aggregate supply AS and explain how it differs in the
immediate short run, the short run, and the long run.
Test Bank: I
To pic: Aggregate Supply
Type: Table
61.
Input Quantity
Real Domestic Output
100
200
150
300
200
400
The table gives information about the relationship between input quantities and real
domestic output in a hypothetical economy. Suppose that the price of each input increased
from $5 to $8. The per-unit cost of production in the economy would
62.
The short-run aggregate supply curve represents circumstances where

32–29
Copyright © 2018 McGraw-Hill Education. All rights reserved. No reproduction or distribution without the prior
written consent of McGraw-Hill Education.
Learning Objective: 32-03 Define aggregate supply AS and explain how it differs in the
immediate short run, the short run, and the long run.
Test Bank: I
To pic: Aggregate Supply
63.
The economy’s long-run aggregate supply curve
64.
The economy‘s long-run AS curve assumes that wages and other resource prices
65.
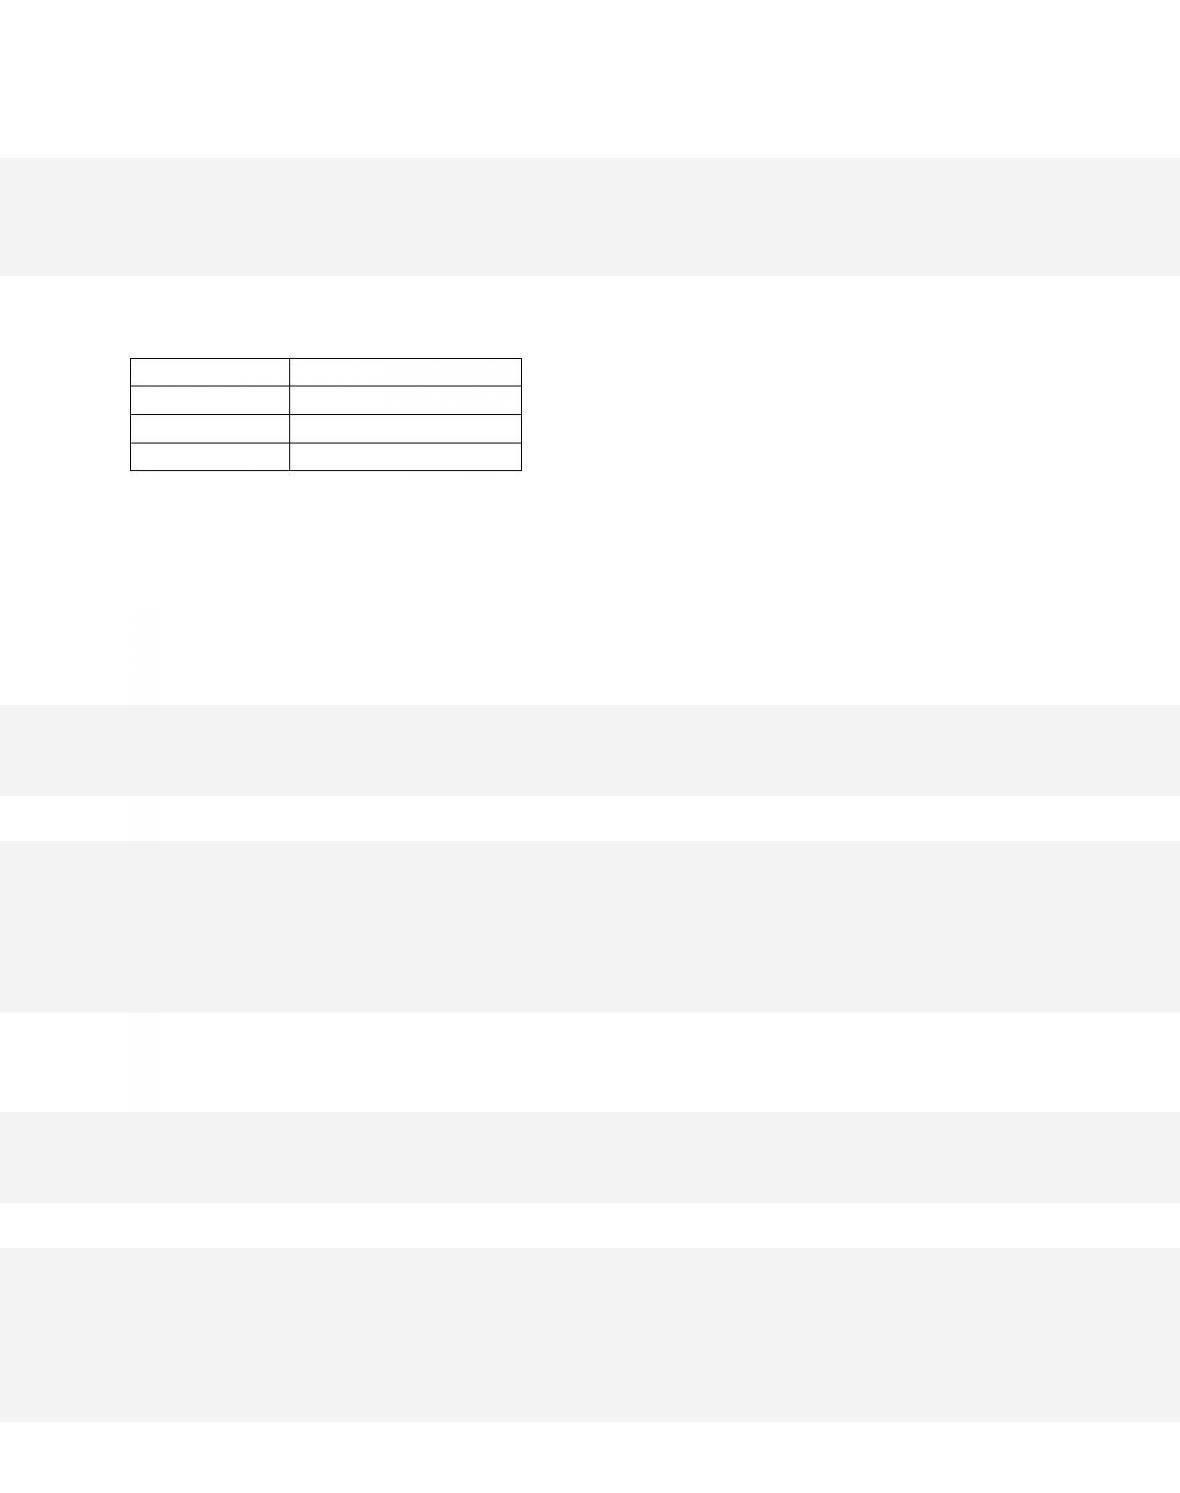
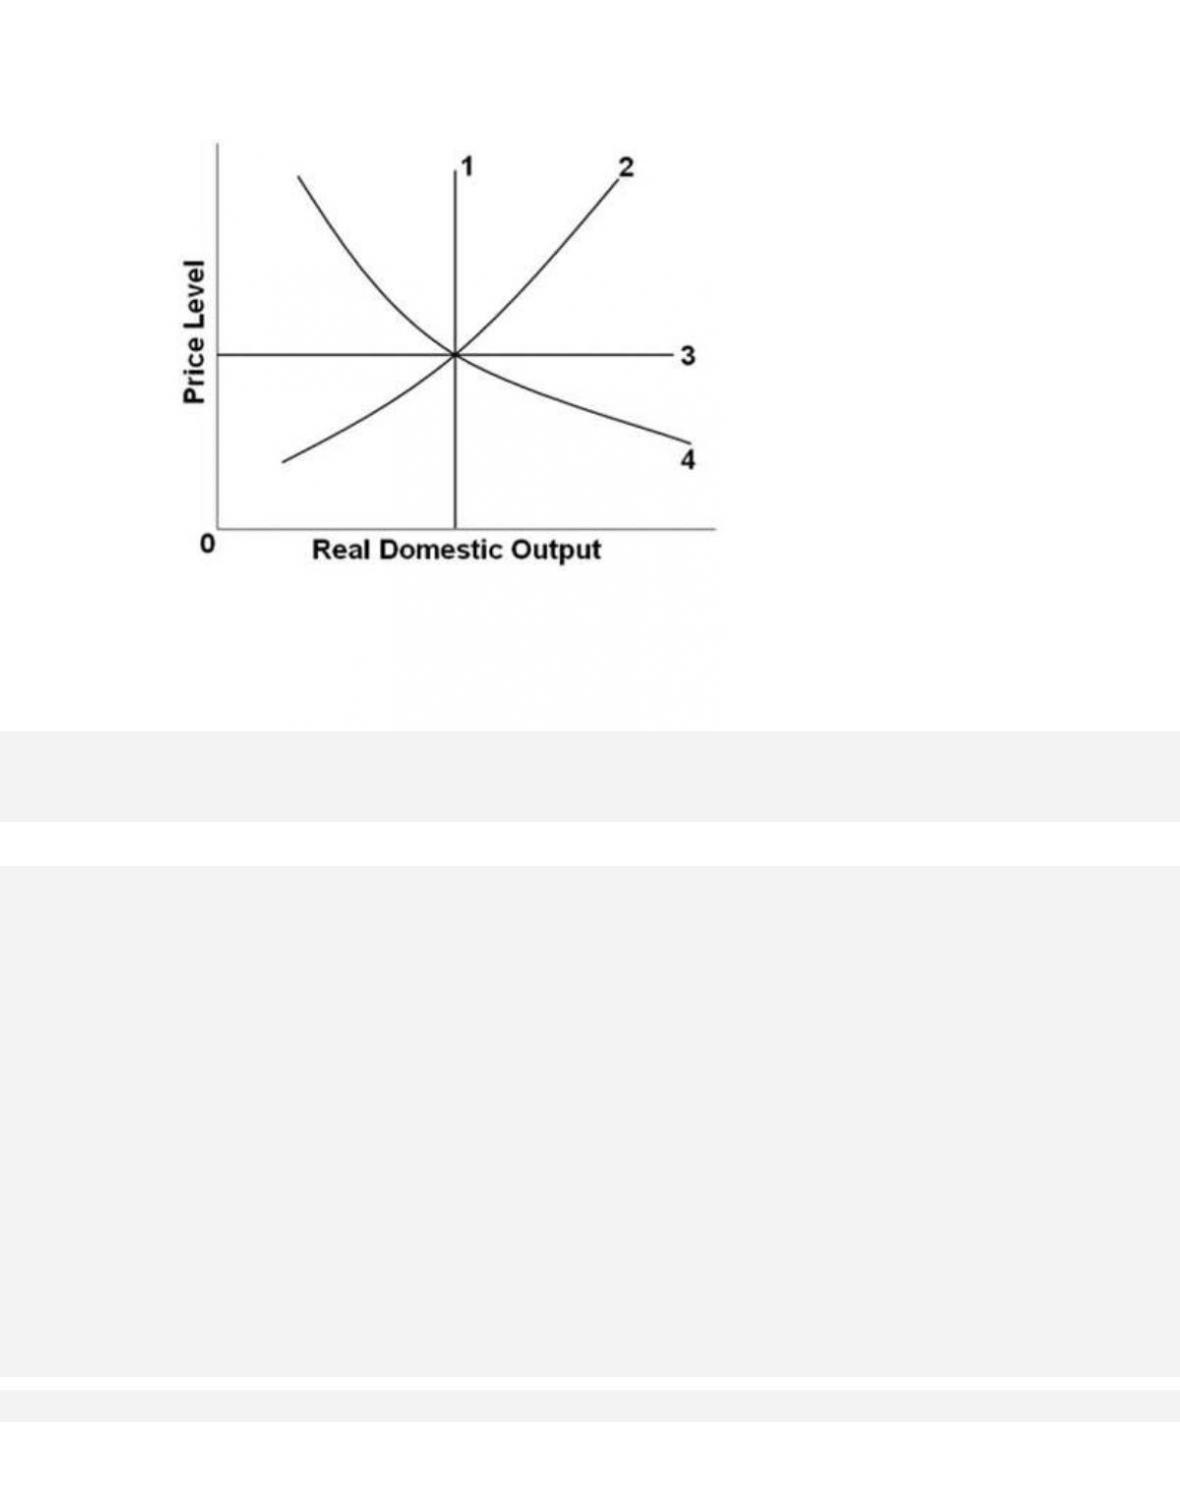
In the diagram, the economy‘s long-run aggregate supply curve is shown by line
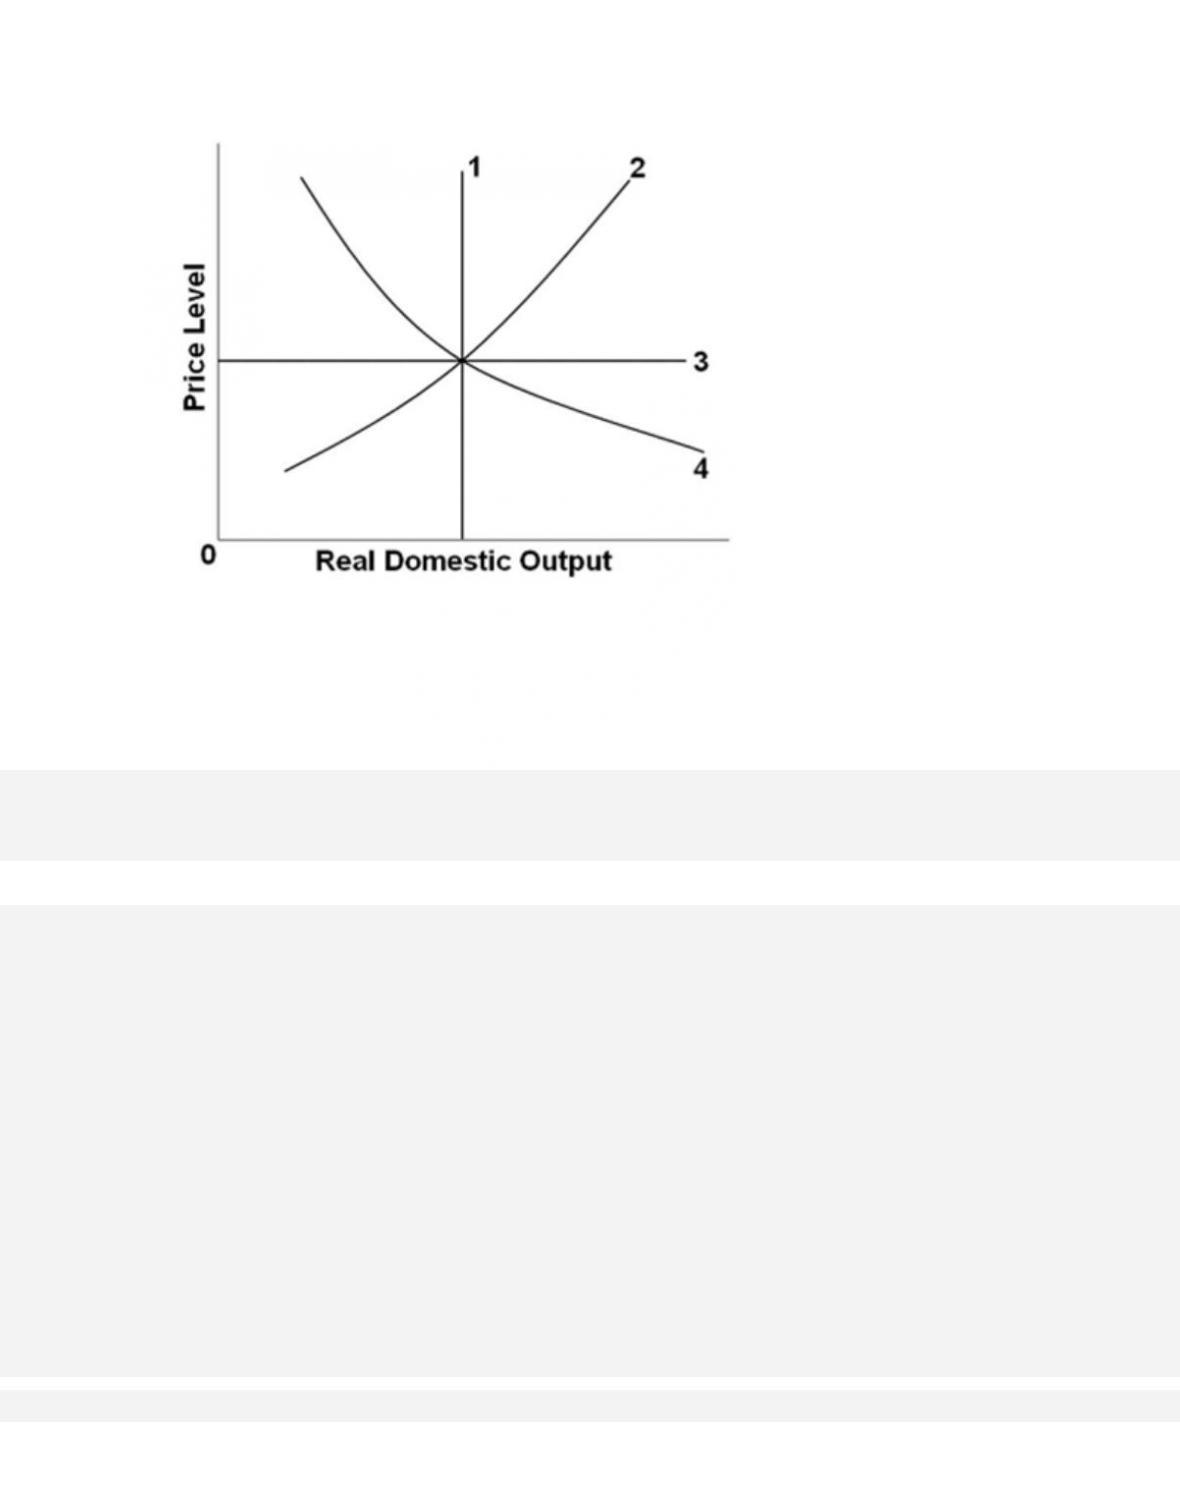
66.
In the diagram, the economy‘s relevant aggregate demand and long-run aggregate supply
curves, are lines
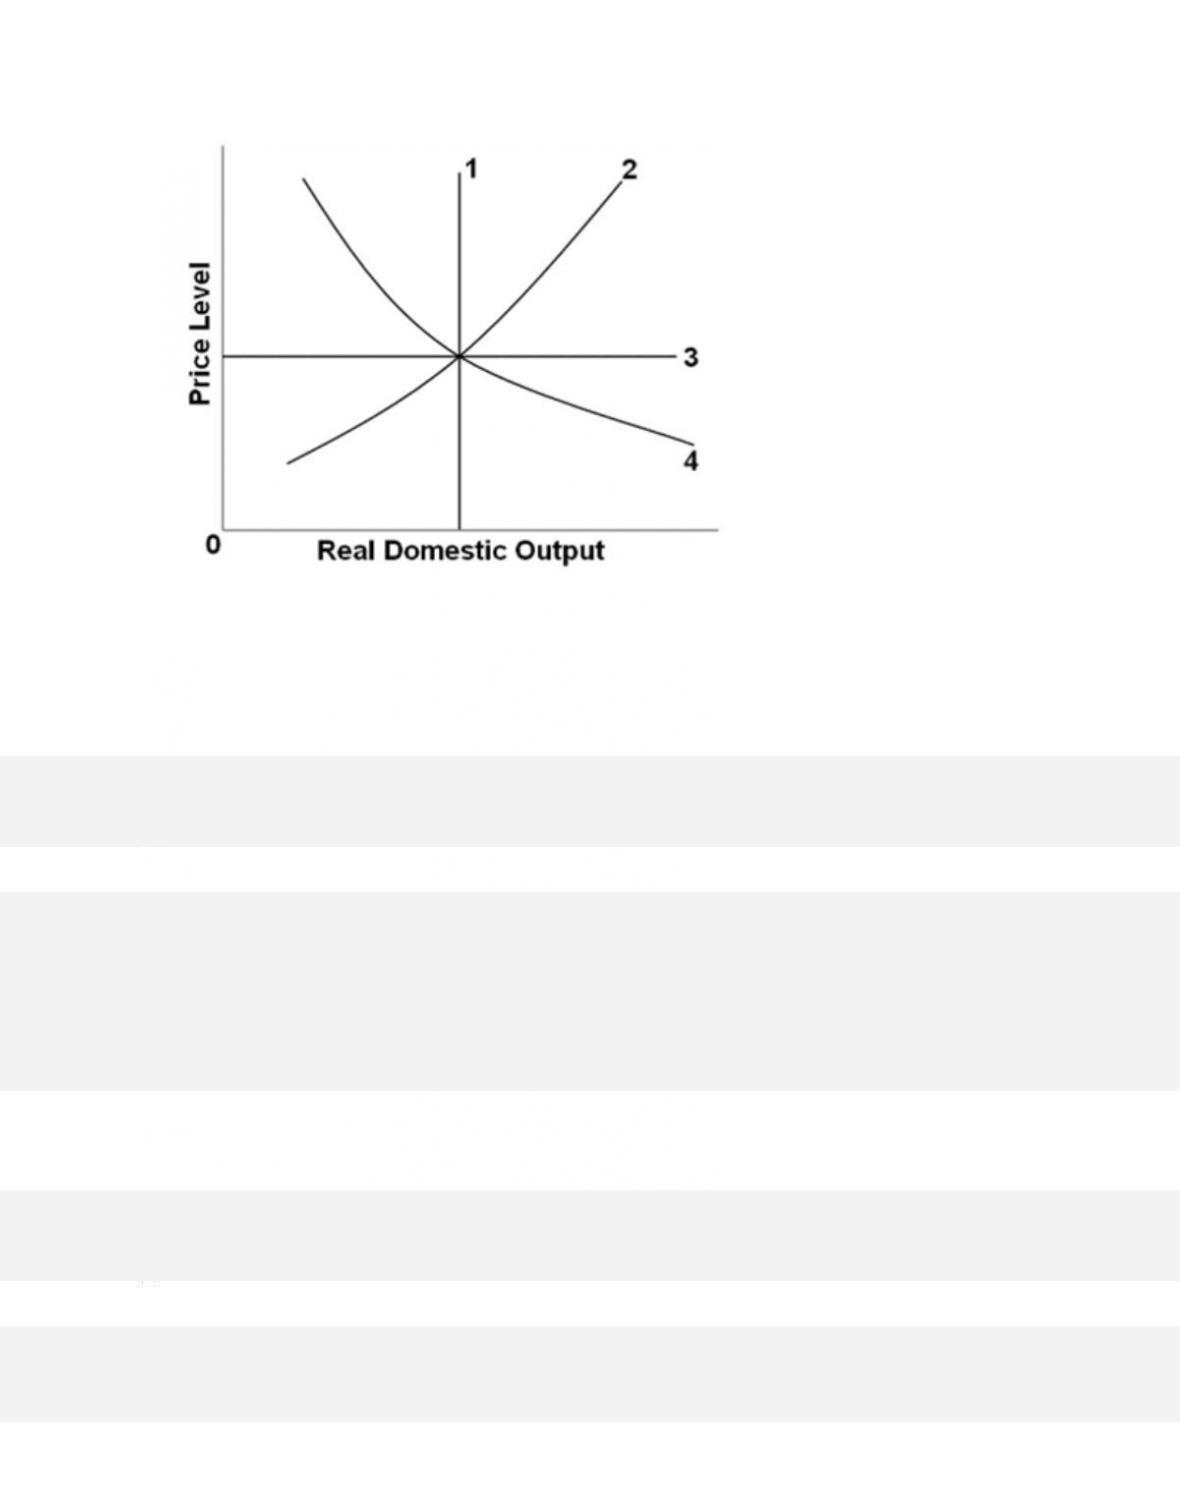
67.
In the diagram, the economy‘s short–run AS curve is line , and its long-run AS curve is
line _.
68. The equilibrium price level and level of real output occur where
32–33
Copyright © 2018 McGraw-Hill Education. All rights reserved. No reproduction or distribution without the prior
written consent of McGraw-Hill Education.
Accessibility: Keyboard Navigation
Blooms: Understand
Di ffi culty: 02 Medium
Learning Objective: 32-05 Discuss how AD and AS determine an economys equilibrium
price level and level of real GDP.
Test Bank: I
To pic: Equilibrium in the AD–AS Model
69.
Amount of Real Output
Demanded
Price Level (Index
Value)
Amount of Real Output
Supplied
$200
300
$500
300
250
450
400
200
400
500
150
300
600
100
200
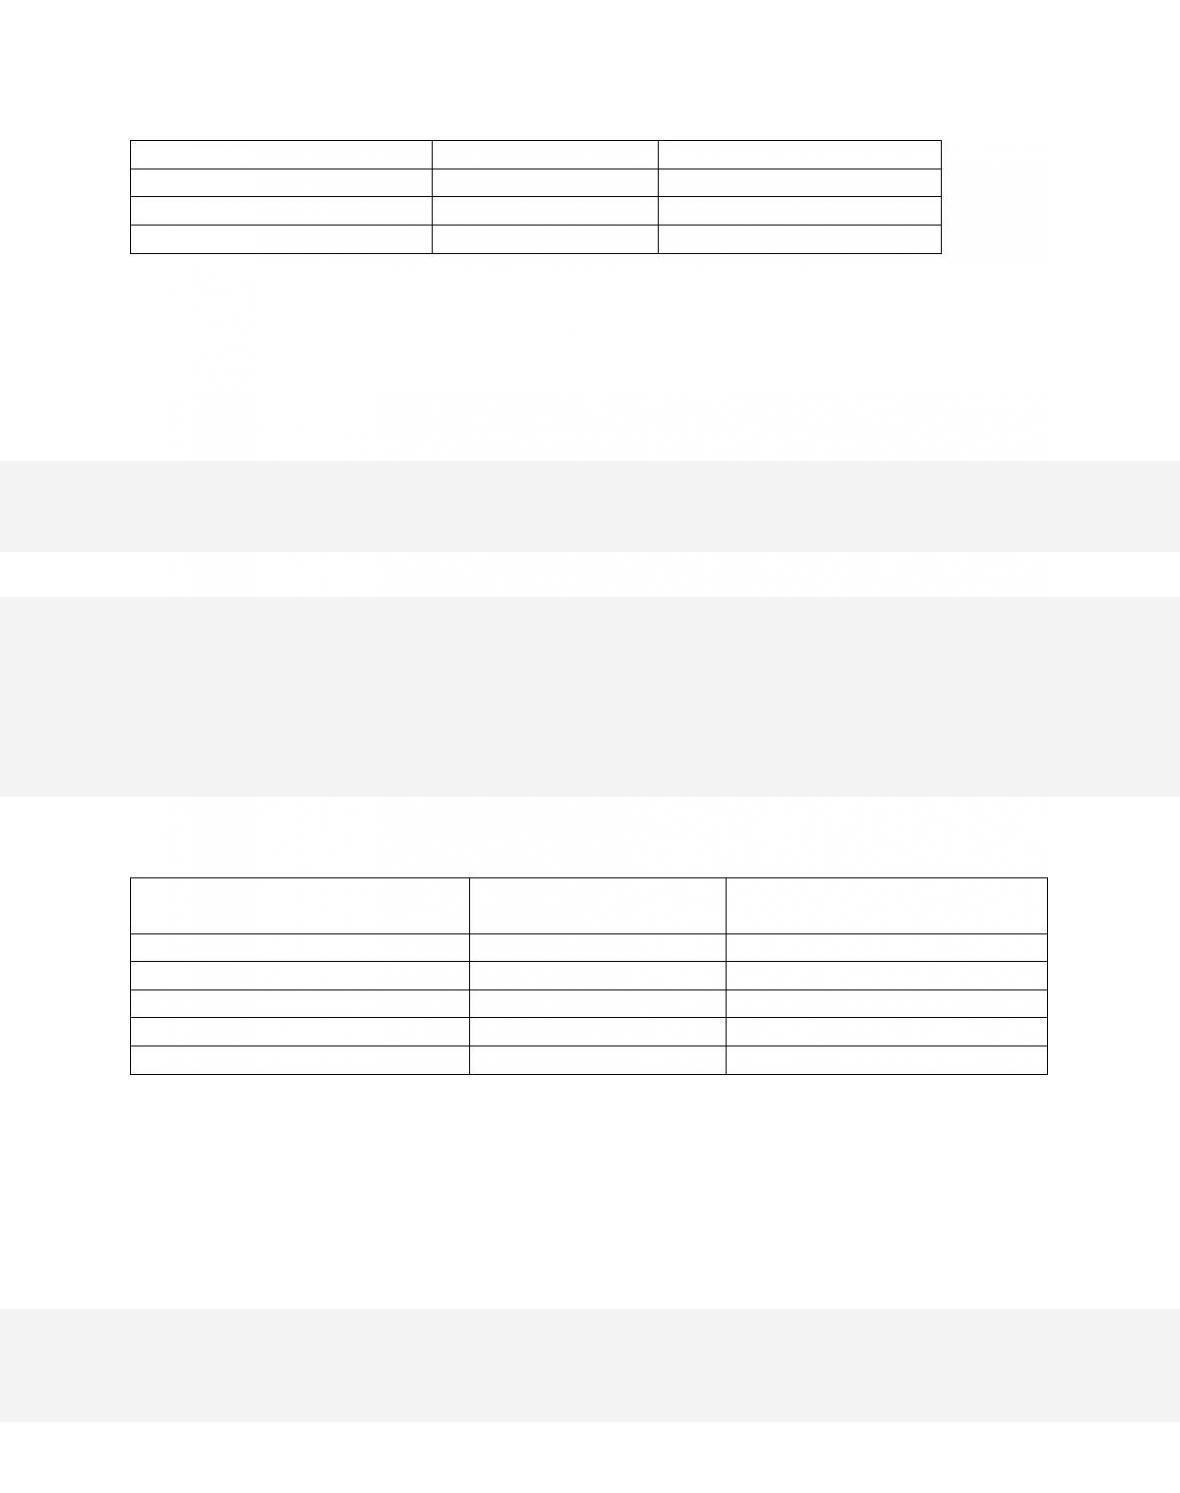
The table gives aggregate demand and supply schedules for a hypothetical economy. The
equilibrium price level will be
70.
Amount of Real Output
Demanded
Price Level (Index
Value)
Amount of Real Output
Supplied
$200
300
$500
300
250
450
400
200
400
500
150
300
600
100
200
The table gives aggregate demand and supply schedules for a hypothetical economy. If the
price level is 250 and producers supply $450 of real output,
71.
Amount of Real Output
Demanded
Price Level (Index
Value)
Amount of Real Output
Supplied
$200
300
$500
300
250
450
400
200
400
500
150
300
600
100
200
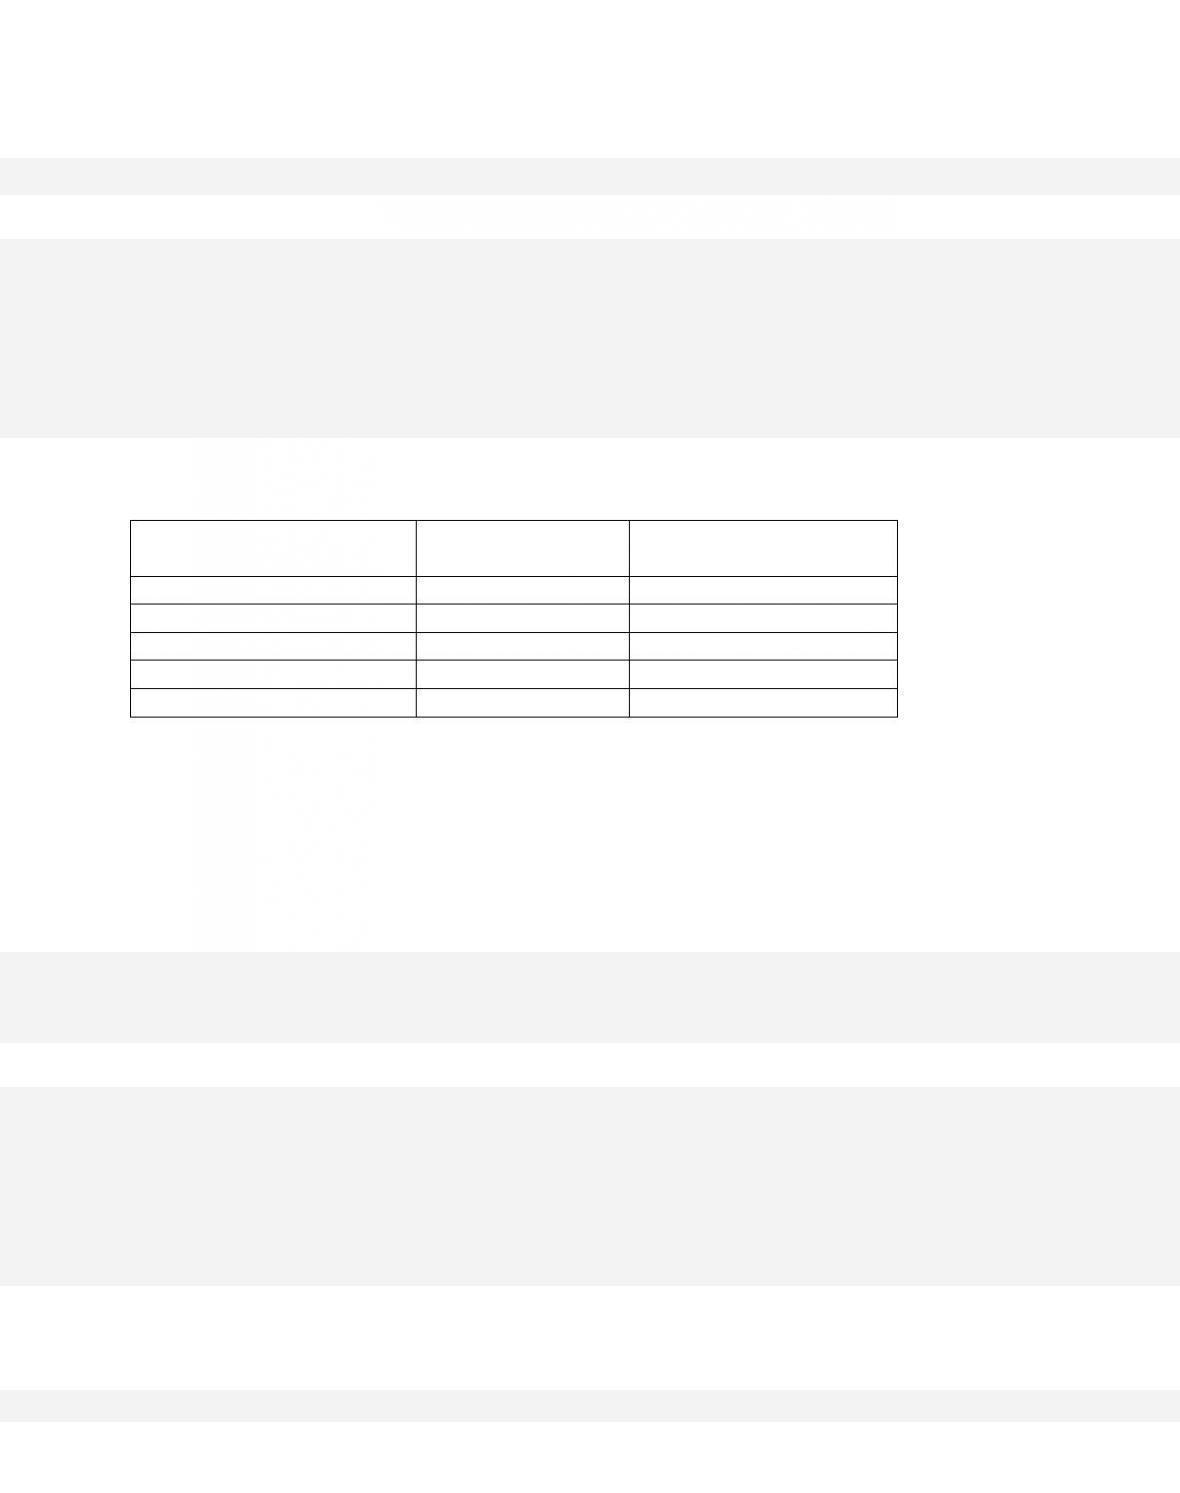
The table gives aggregate demand and supply schedules for a hypothetical economy. If the
amount of real output demanded at each price level falls by $200, the equilibrium price
level and equilibrium level of real domestic output will fall to
32–35
Copyright © 2018 McGraw-Hill Education. All rights reserved. No reproduction or distribution without the prior
written consent of McGraw-Hill Education.
C.
150 and $300, respectively.
D. 150 and $200, respectively.
72.
Amount of Real Output
Demanded
Price Level (Index
Value)
Amount of Real Output
Supplied
$200
300
$500
300
250
450
400
200
400
500
150
300
600
100
200
The table gives aggregate demand and supply schedules for a hypothetical economy. If the
amount of real output demanded at each price level falls by $200, this might have been
caused by
73.
Graphically, demand–pull inflation is shown as a

74.
Graphically, cost-push inflation is shown as a
75.
Graphically, the full-employment, low-inflation, rapid-growth economy of the last half
of the 1990s is depicted by a
32–37
Copyright © 2018 McGraw-Hill Education. All rights reserved. No reproduction or distribution without the prior
written consent of McGraw-Hill Education.
Di ffi culty: 02 Medium
Learning Objective: 32-06 Describe how the AD-AS model explains periods of demand-
pull inflation, cost-push inflation, and recession.
Test Bank: I
To pic: Changes in Equilibrium
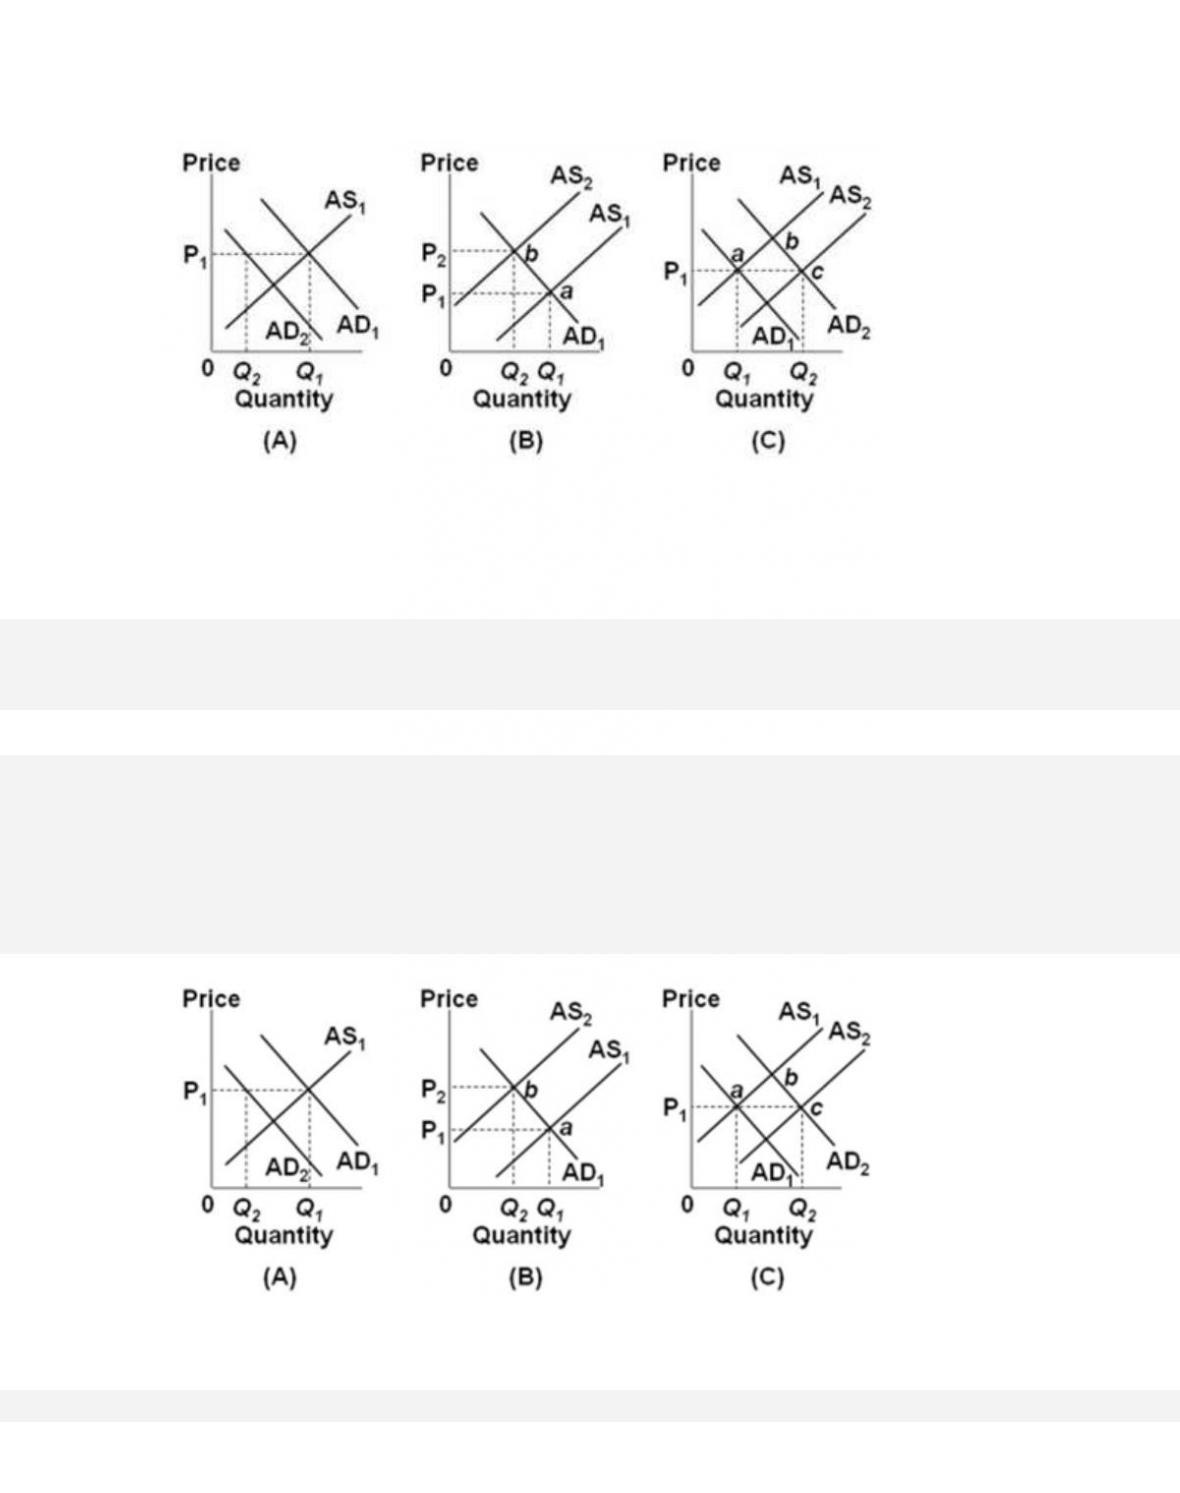
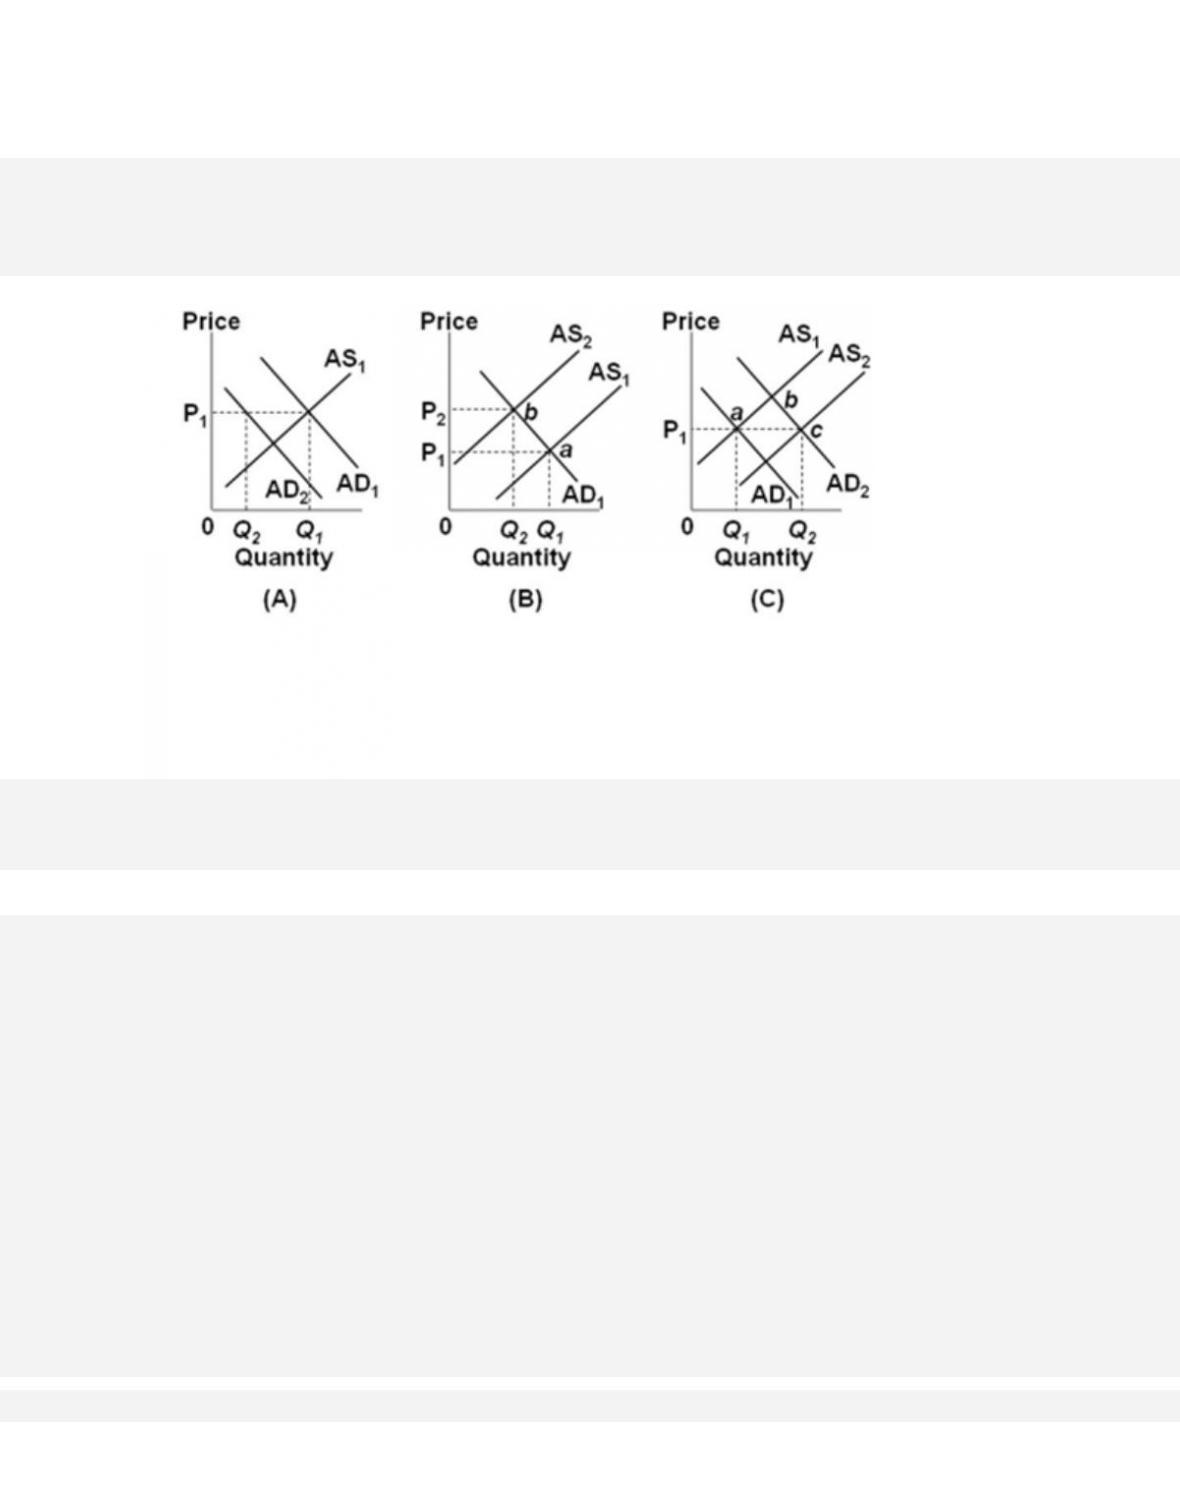
76.
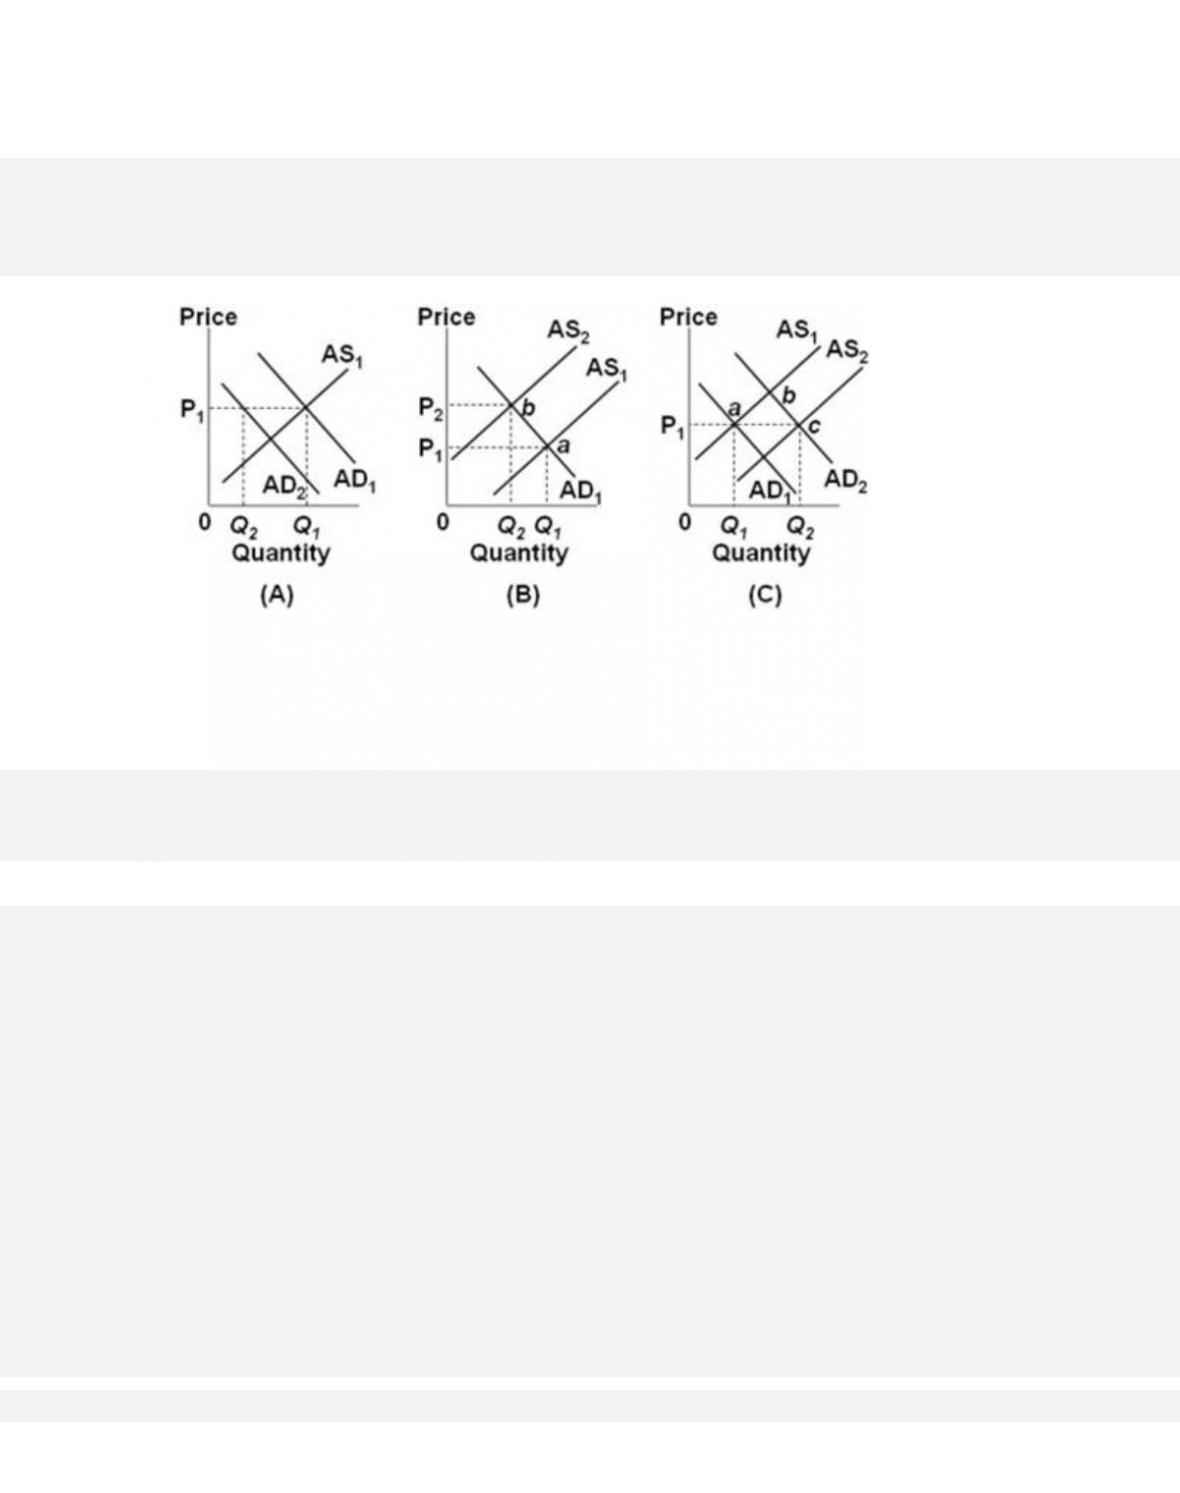
Refer to the diagrams, in which AD1 and AS1 are the “before” curves and AD2 and AS2 are
the “after” curves. A recession is depicted by
32–38
77.
Refer to the diagrams, in which AD1 and AS1 are the “before” curves and AD2 and AS2 are
the “after” curves. Cost-push inflation is depicted by
78.
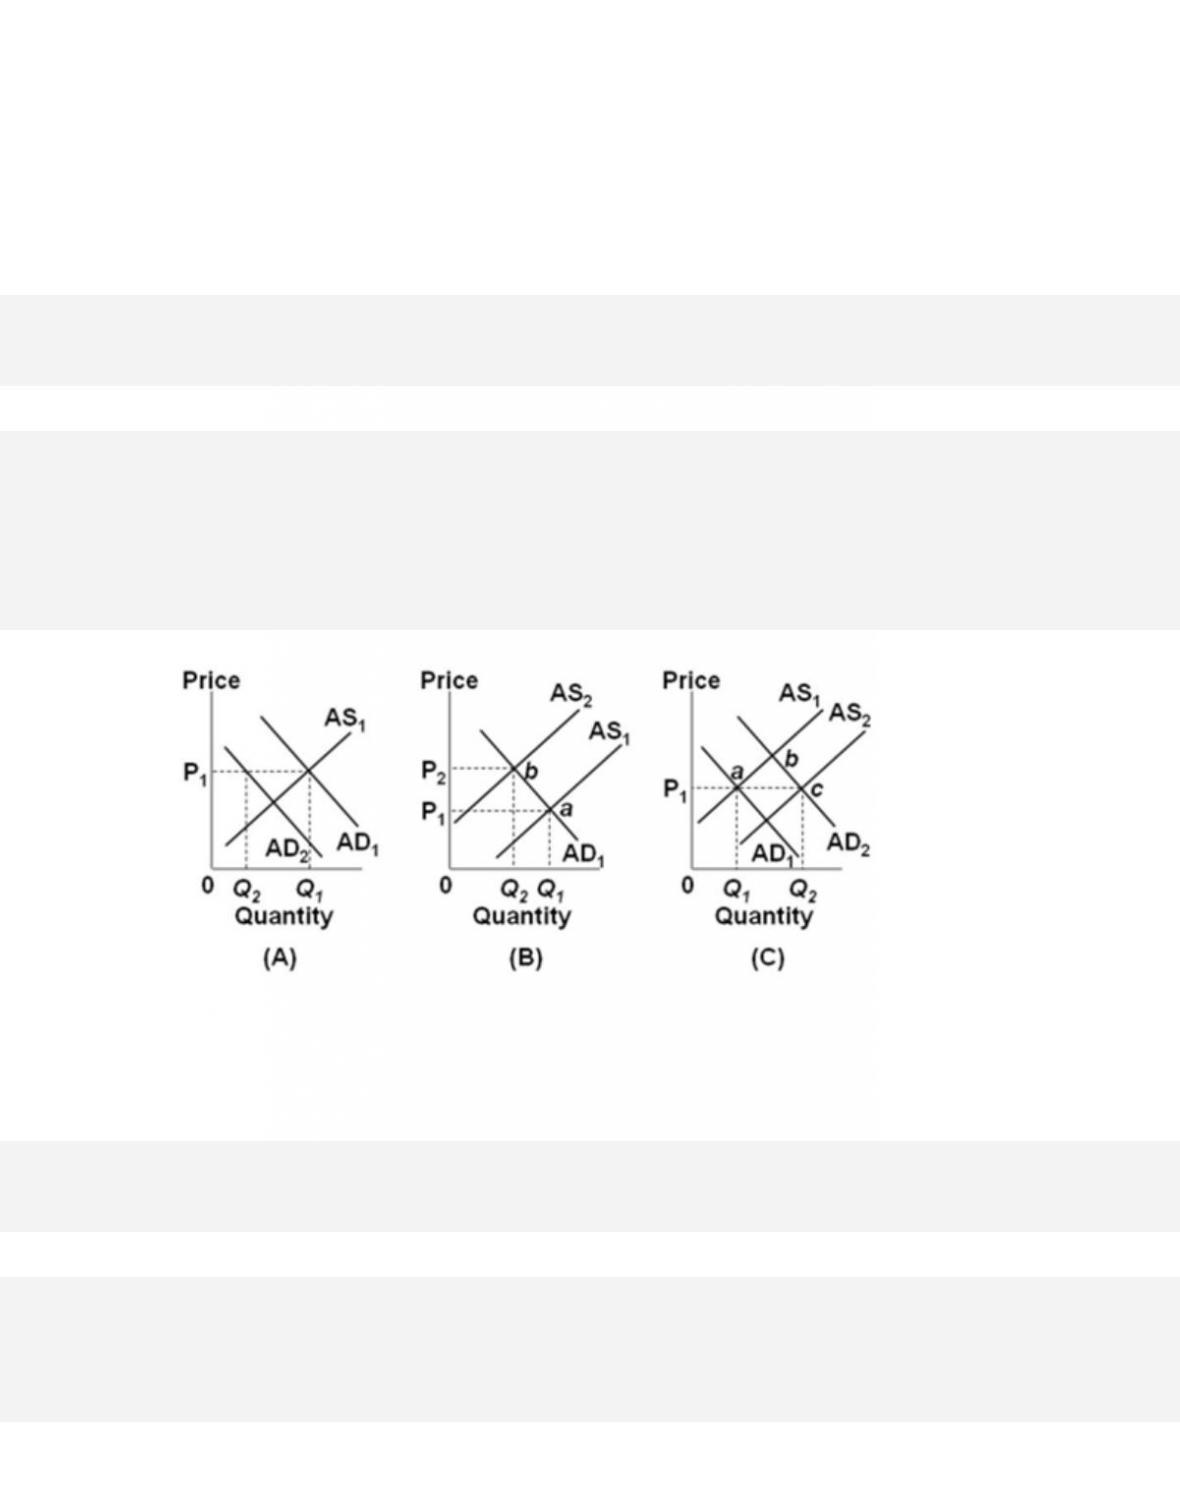
Refer to the diagrams, in which AD1 and AS1 are the “before” curves and AD2 and AS2 are
the “after” curves. Growth, full-employment, and price stability are depicted by
79.
Refer to the diagrams, in which AD1 and AS1 are the “before” curves and AD2 and AS2 are
the “after” curves. Other things equal, an increase in investment spending is depicted by
32–40
Copyright © 2018 McGraw-Hill Education. All rights reserved. No reproduction or distribution without the prior
written consent of McGraw-Hill Education.
Learning Objective: 32-06 Describe how the AD-AS model explains periods of demand-
pull inflation, cost-push inflation, and recession.
Test Bank: I
To pic: Changes in Equilibrium
Type: Graph
80.
Refer to the diagrams, in which AD1 and AS1 are the “before” curves and AD2 and AS2 are
the “after” curves. Other things equal, a decline in productivity is depicted by