Chapter 32 Aggregate Demand and Aggregate Supply Answer Key
Multiple Choice Questions
1.
The aggregate demand curve
2.
The aggregate demand curve is
3.
The interest-rate effect suggests that
32-2
Copyright © 2018 McGraw-Hill Education. All rights reserved. No reproduction or distribution without the prior
written consent of McGraw-Hill Education.
and decrease consumption and investment spending.
C.
an increase in the price level will increase the demand for money, increase interest rates,
and decrease consumption and investment spending.
D. an increase in the price level will decrease the demand for money, reduce interest rates,
and increase consumption and investment spending.
AACSB: Knowledge Application
Accessibility: Keyboard Navigation
Blooms: Remember
Dif f i c u l t y: 01 Easy
Learning Objective: 32-01 Define aggregate demand AD and explain how its downward
slope is the result of the real-balances effect, the interest-rate effect, and the foreign
purchases effect.
Test Bank: I
To pi c : Aggregate Demand
4.
The real-balances effect indicates that
5.
The foreign purchases effect suggests that an increase in the U.S. price level relative to
other countries will
32-3
Copyright © 2018 McGraw-Hill Education. All rights reserved. No reproduction or distribution without the prior
written consent of McGraw-Hill Education.
AACSB: Knowledge Application
Accessibility: Keyboard Navigation
Blooms: Remember
Dif f i c u l t y: 01 Easy
Learning Objective: 32-01 Define aggregate demand AD and explain how its downward
slope is the result of the real-balances effect, the interest-rate effect, and the foreign
purchases effect.
Test Bank: I
To pi c : Aggregate Demand
6.
The foreign purchases effect suggests that a decrease in the U.S. price level relative to
other countries will
7.
The foreign purchases effect
32-4
Copyright © 2018 McGraw-Hill Education. All rights reserved. No reproduction or distribution without the prior
written consent of McGraw-Hill Education.
To pi c : Aggregate Demand
8.
If the price level increases in the United States relative to foreign countries, then
American consumers will purchase more foreign goods and fewer U.S. goods. This
statement
describes
9.
The real-balances, interest-rate, and foreign purchases effects all help explain
10.
Which of the following is incorrect?
32-5
Copyright © 2018 McGraw-Hill Education. All rights reserved. No reproduction or distribution without the prior
written consent of McGraw-Hill Education.
C.
When the price level increases, real balances increase and businesses and households
find themselves wealthier and therefore increase their spending.
D. Given aggregate demand, an increase in aggregate supply increases real output and,
assuming downward-flexible prices, reduces the price level.
AACSB: Knowledge Application
Accessibility: Keyboard Navigation
Blooms: Remember
Dif f i c u l t y: 01 Easy
Learning Objective: 32-01 Define aggregate demand AD and explain how its downward
slope is the result of the real-balances effect, the interest-rate effect, and the foreign
purchases effect.
Test Bank: I
To pi c : Aggregate Demand
11.
The factors that affect the amounts that consumers, businesses, government, and
foreigners wish to purchase at each price level are the
12.
The determinants of aggregate demand
32-6
Copyright © 2018 McGraw-Hill Education. All rights reserved. No reproduction or distribution without the prior
written consent of McGraw-Hill Education.
To pi c : Changes in Aggregate Demand
13.
Other things equal, if the national incomes of the major trading partners of the United
States were to rise, the U.S.
14.
Which one of the following would not shift the aggregate demand curve?
15.
Other things equal, a decrease in the real interest rate will
32-7
Copyright © 2018 McGraw-Hill Education. All rights reserved. No reproduction or distribution without the prior
written consent of McGraw-Hill Education.
Learning Objective: 32-02 Explain the factors that cause changes shifts in AD.
Test Bank: I
To pi c : Changes in Aggregate Demand
16.
A decline in investment will shift the AD curve to the
17.
An increase in net exports will shift the AD curve to the
18.
If investment increases by $10 billion and the economy’s MPC is 0.8, the aggregate
demand curve will shift
32-8
Copyright © 2018 McGraw-Hill Education. All rights reserved. No reproduction or distribution without the prior
written consent of McGraw-Hill Education.
Blooms: Understand
Di ffi culty: 02 Medium
Learning Objective: 32-02 Explain the factors that cause changes shifts in AD.
Test Bank: I
To pi c : Changes in Aggregate Demand
19.
If investment decreases by $20 billion and the economy’s MPC is 0.5, the aggregate
demand curve will shift
20.
An economy’s aggregate demand curve shifts leftward or rightward by more than
changes in initial spending because of the
21.
Which of the following would most likely shift the aggregate demand curve to the right?
32-9
Copyright © 2018 McGraw-Hill Education. All rights reserved. No reproduction or distribution without the prior
written consent of McGraw-Hill Education.
AACSB: Knowledge Application
Accessibility: Keyboard Navigation
Blooms: Understand
Di ffi culty: 02 Medium
Learning Objective: 32-02 Explain the factors that cause changes shifts in AD.
Test Bank: I
To pi c : Changes in Aggregate Demand
22.
Which of the following would most likely reduce aggregate demand (shift the AD curve
to the left)?
23.
Suppose that technological advancements stimulate $20 billion in additional investment
spending. If the MPC = 0.6, how much will the change in investment increase aggregate
demand?
24.
In an effort to avoid recession, the government implements a tax rebate program,
effectively cutting taxes for households. We would expect this to
25.
The immediate-short-run aggregate supply curve represents circumstances where
26.
The immediate-short-run aggregate supply curve is
32–11
Copyright © 2018 McGraw-Hill Education. All rights reserved. No reproduction or distribution without the prior
written consent of McGraw-Hill Education.
To pi c : Aggregate Supply
27.
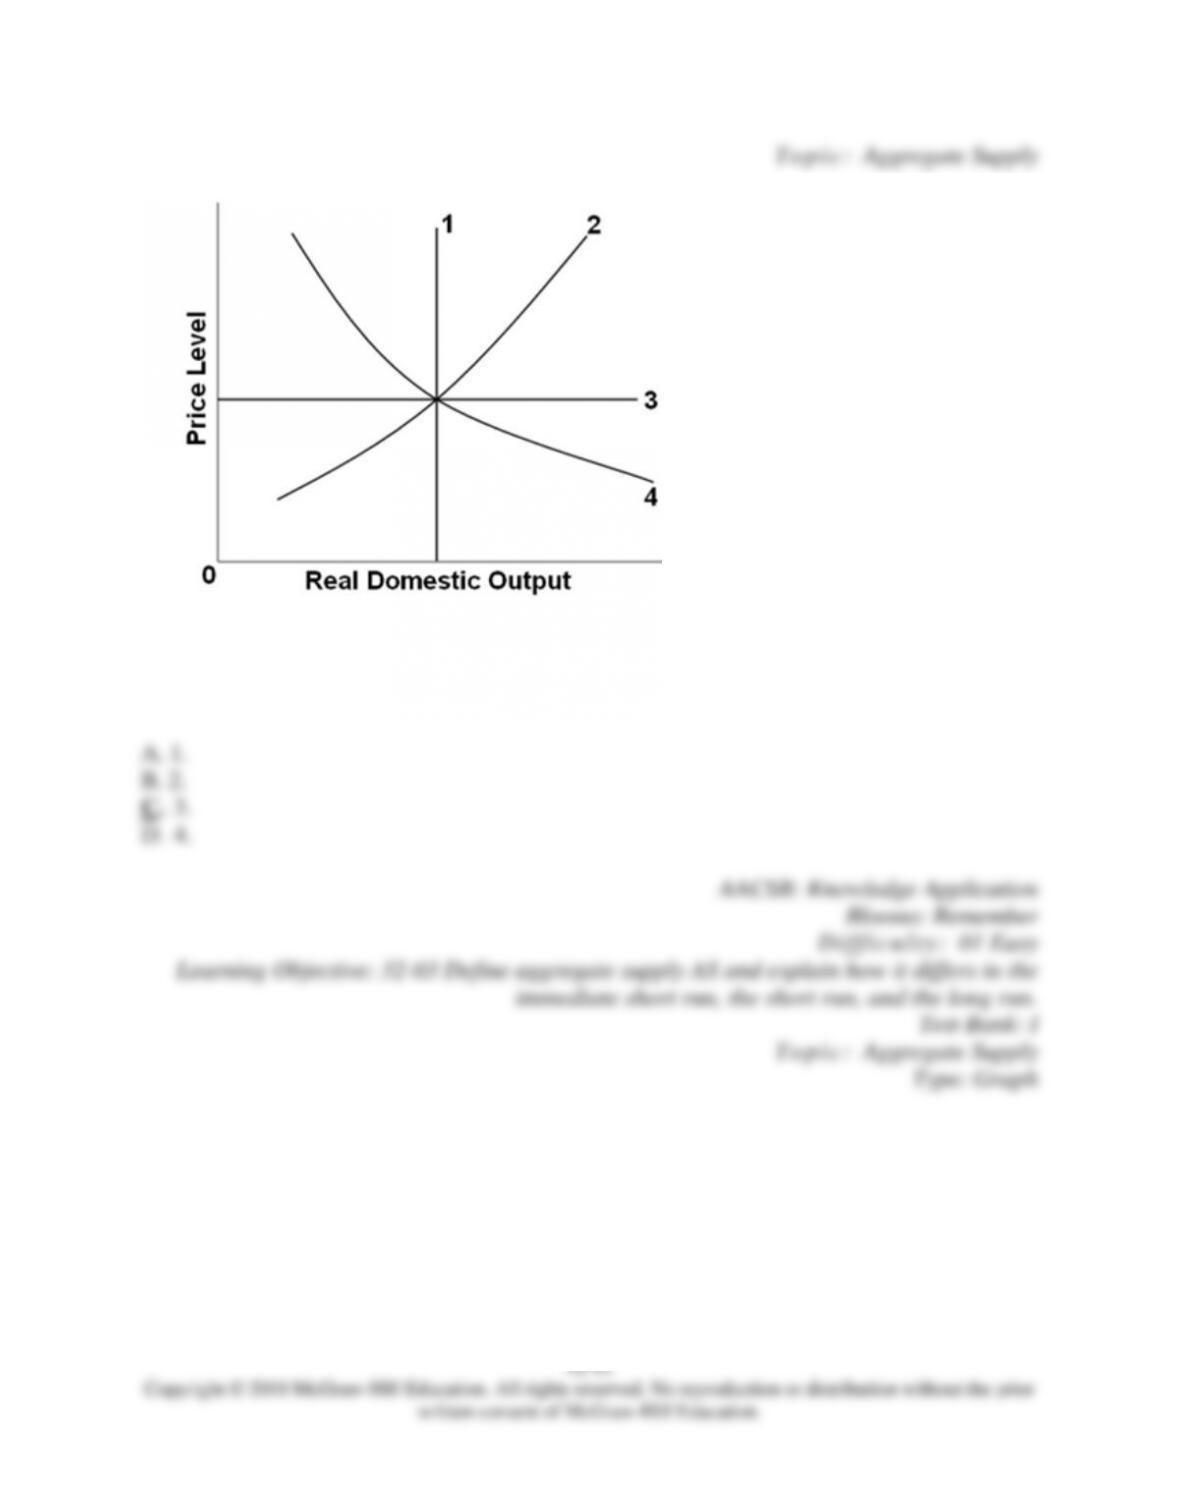
In the diagram, the economy‘s immediate-short-run aggregate supply curve is shown by line
28.
In the diagram, the economy‘s relevant aggregate demand and immediate-short-run aggregate
supply curves, respectively, are lines
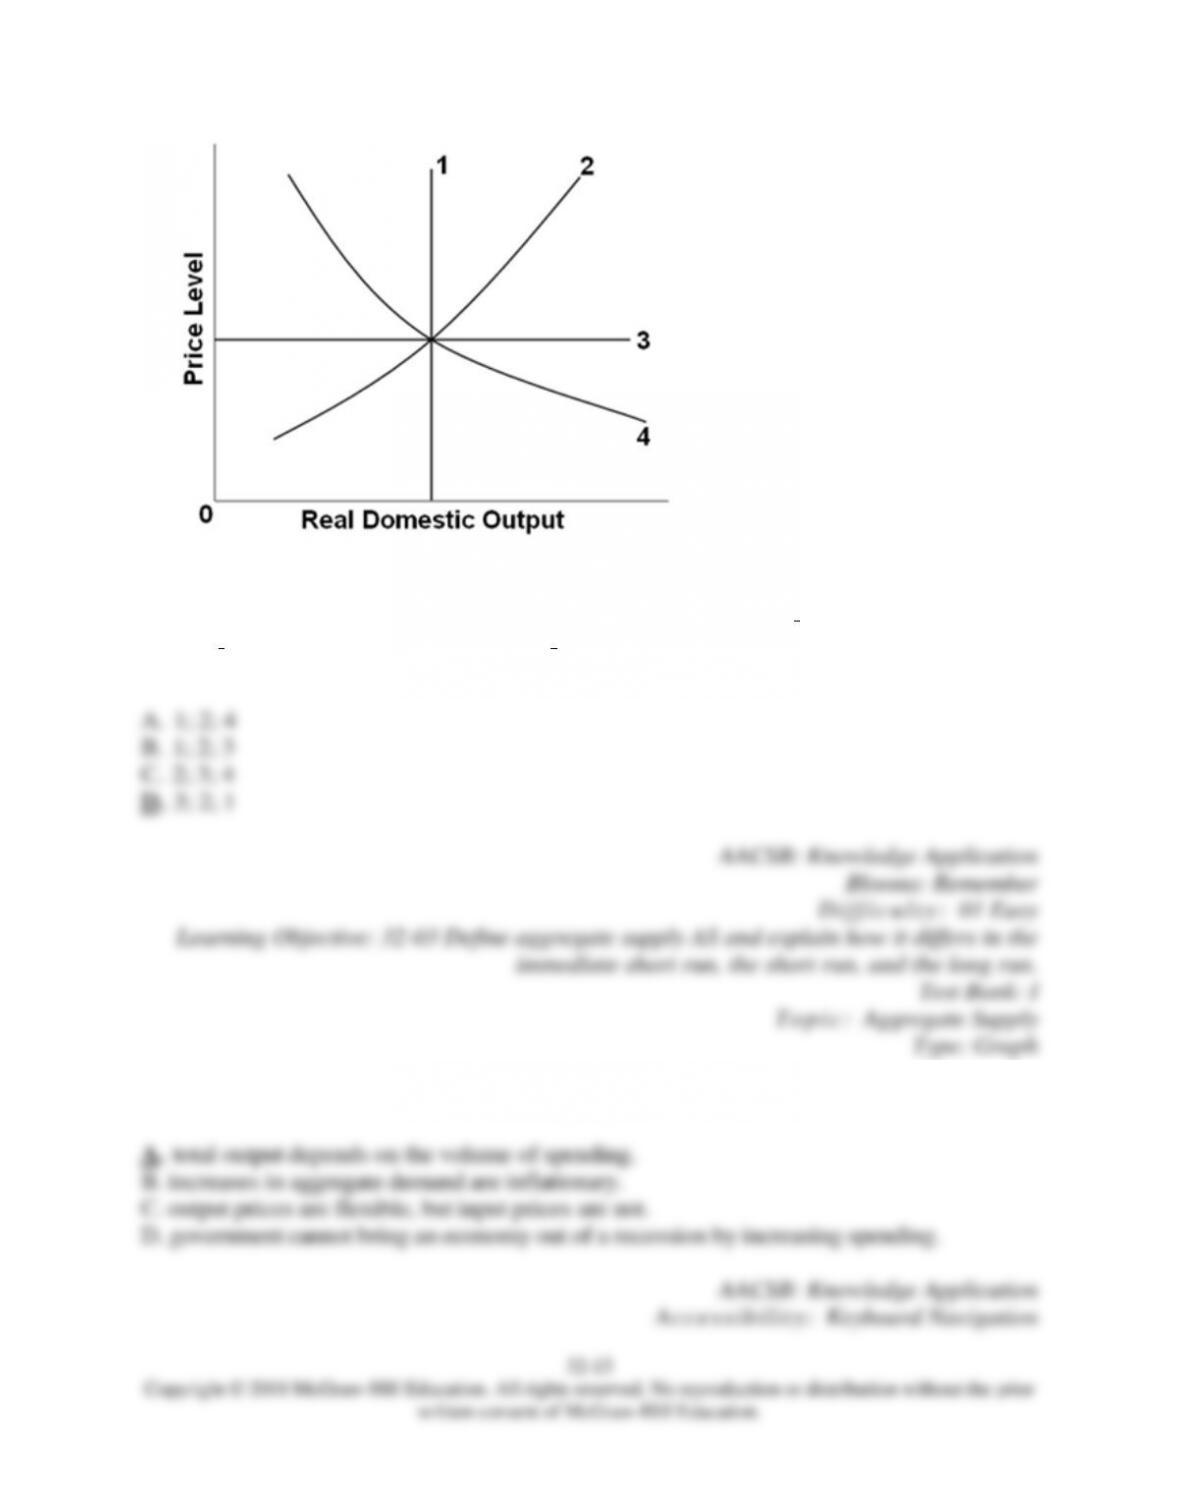
29.
In the diagram, the economy’s immediate-short-run AS curve is line _, its short-run AS
curve is , and its long-run AS curve is line .
30.
The shape of the immediate-short-run aggregate supply curve implies that
32–14
Copyright © 2018 McGraw-Hill Education. All rights reserved. No reproduction or distribution without the prior
written consent of McGraw-Hill Education.
Blooms: Remember
Dif f i c u l t y: 01 Easy
Learning Objective: 32-03 Define aggregate supply AS and explain how it differs in the
immediate short run, the short run, and the long run.
Test Bank: I
To pi c : Aggregate Supply
31.
What percentage of the average U.S. firm‘s costs is accounted for by wages and salaries?
32.
The aggregate supply curve
33.
The aggregate supply curve (short run)
32–15
Copyright © 2018 McGraw-Hill Education. All rights reserved. No reproduction or distribution without the prior
written consent of McGraw-Hill Education.
C.
slopes upward and to the right.
D. graphs as a horizontal line.
AACSB: Knowledge Application
Accessibility: Keyboard Navigation
Blooms: Remember
Dif f i c u l t y: 01 Easy
Learning Objective: 32-03 Define aggregate supply AS and explain how it differs in the
immediate short run, the short run, and the long run.
Test Bank: I
To pi c : Aggregate Supply
34.
The aggregate supply curve (short run)
35.
The aggregate supply curve (short run) is upsloping because
32–16
Copyright © 2018 McGraw-Hill Education. All rights reserved. No reproduction or distribution without the prior
written consent of McGraw-Hill Education.
To pi c : Aggregate Supply
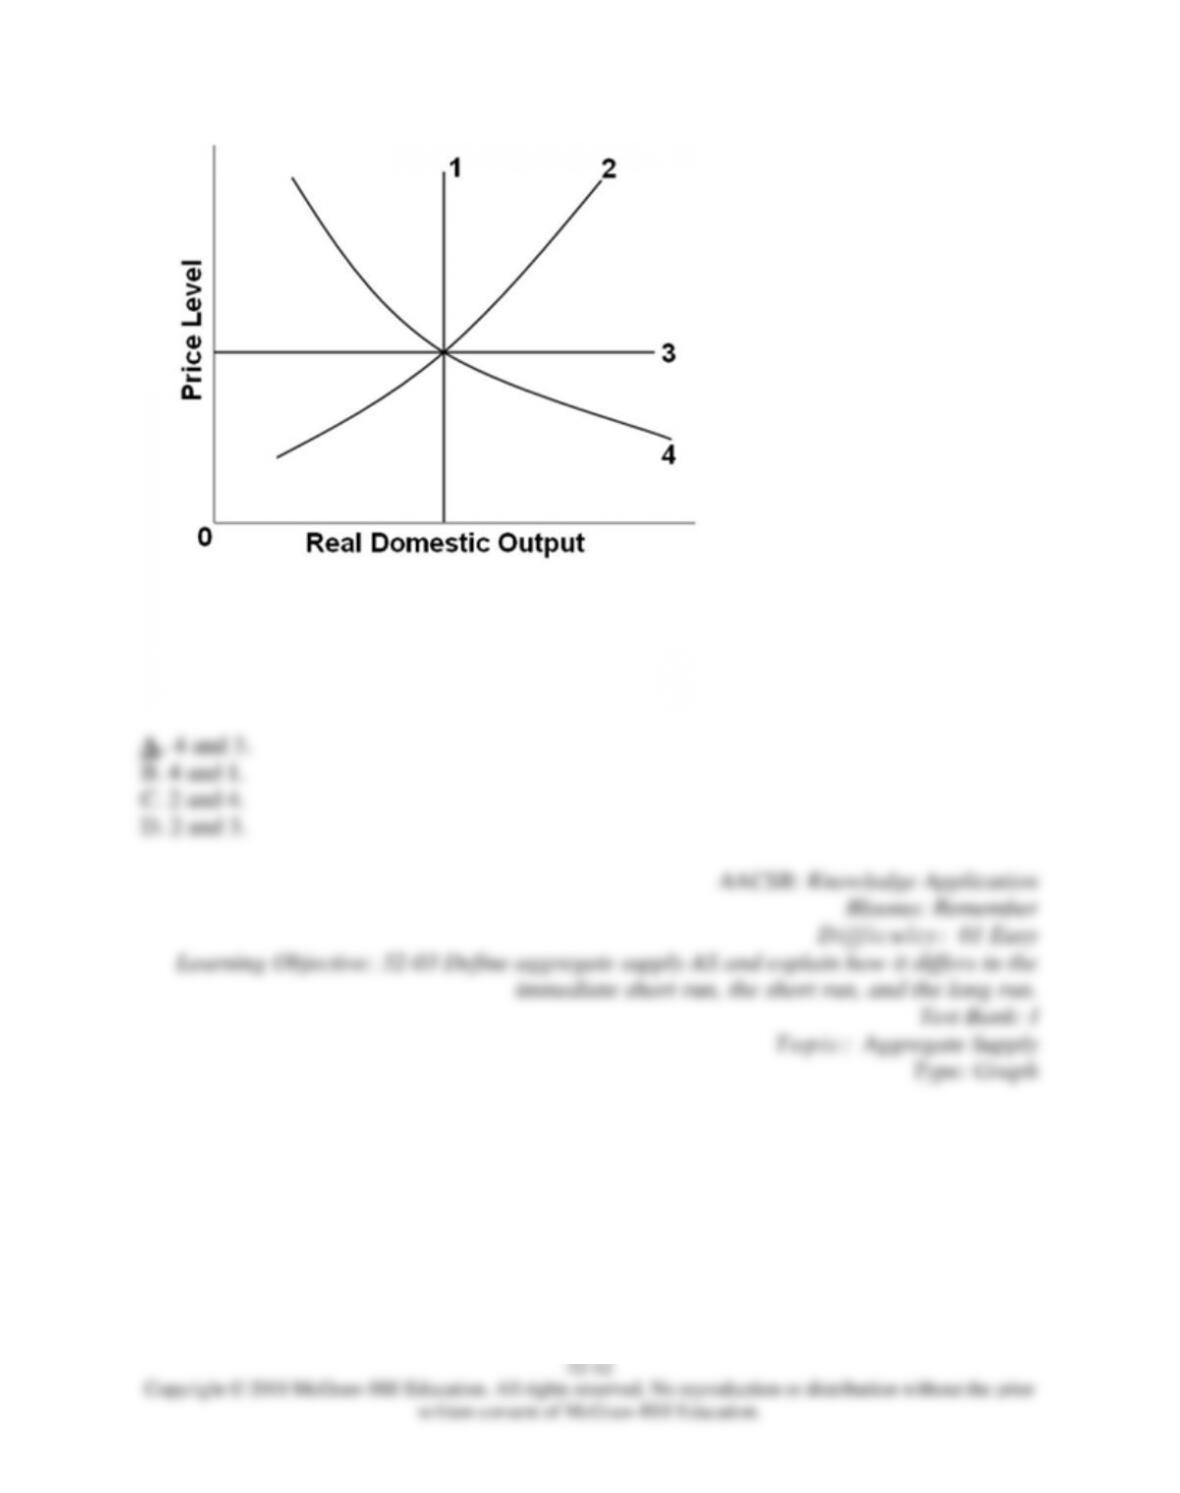
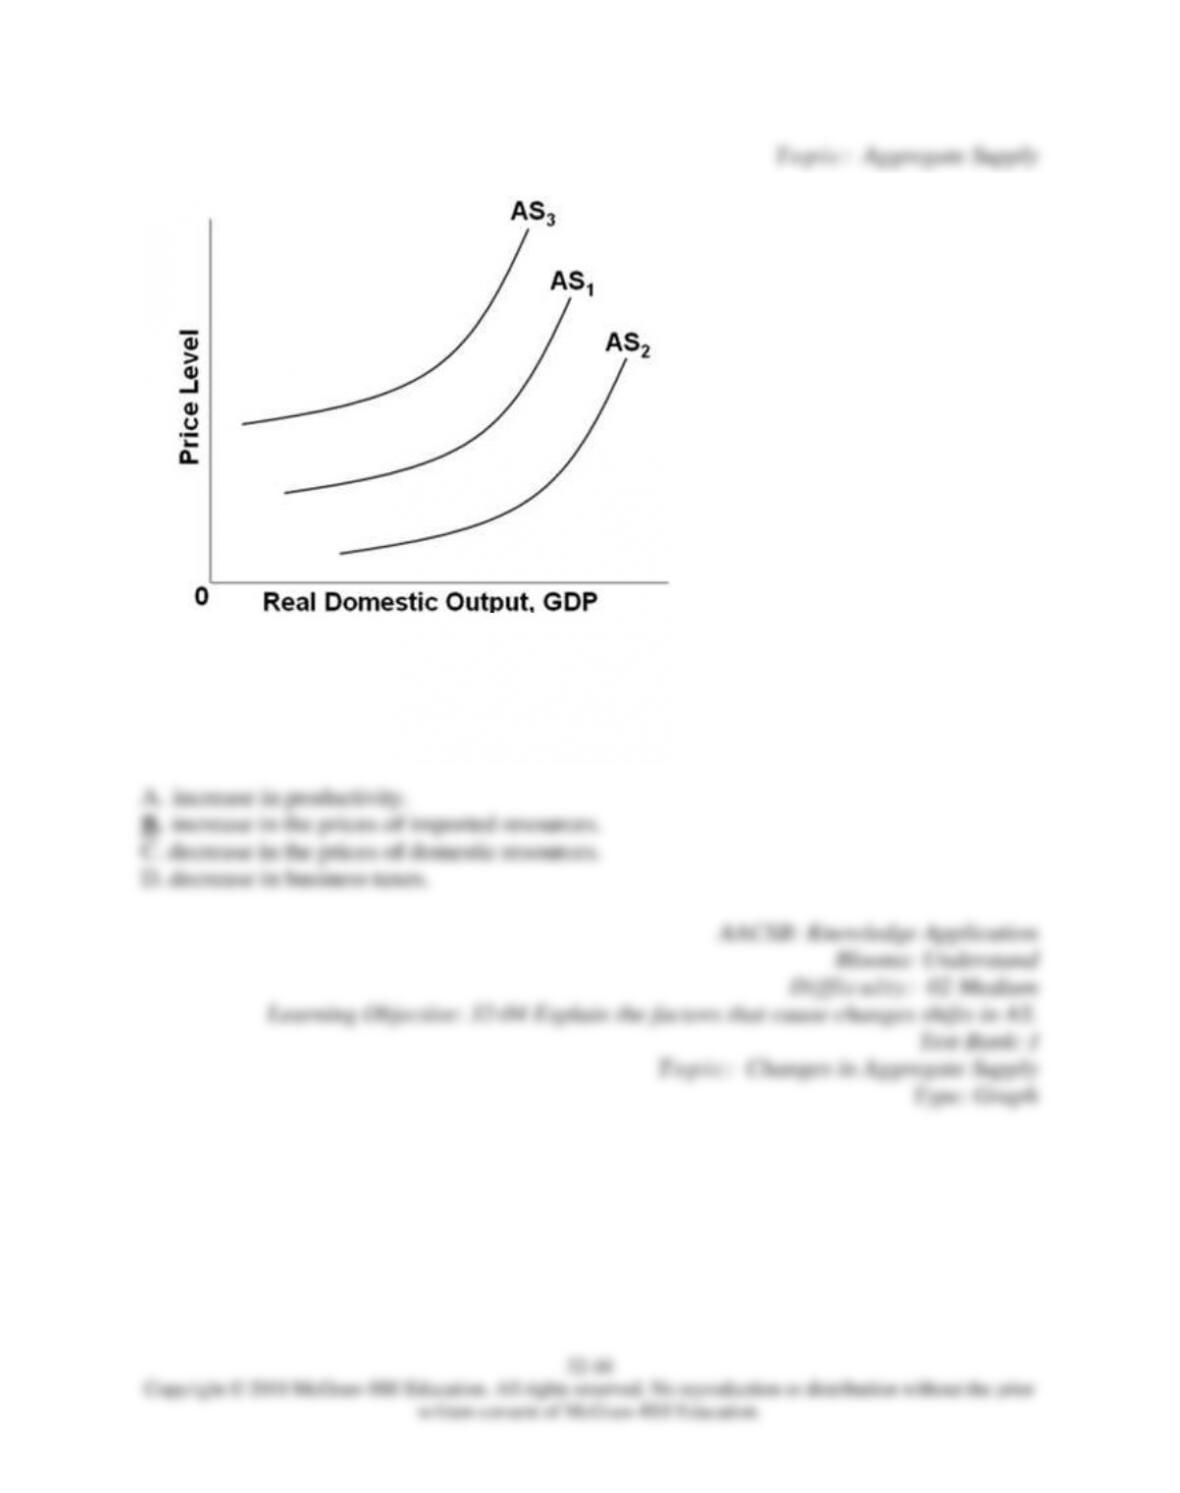
36.
In the diagram, a shift from AS1 to AS3 might be caused by a(n)
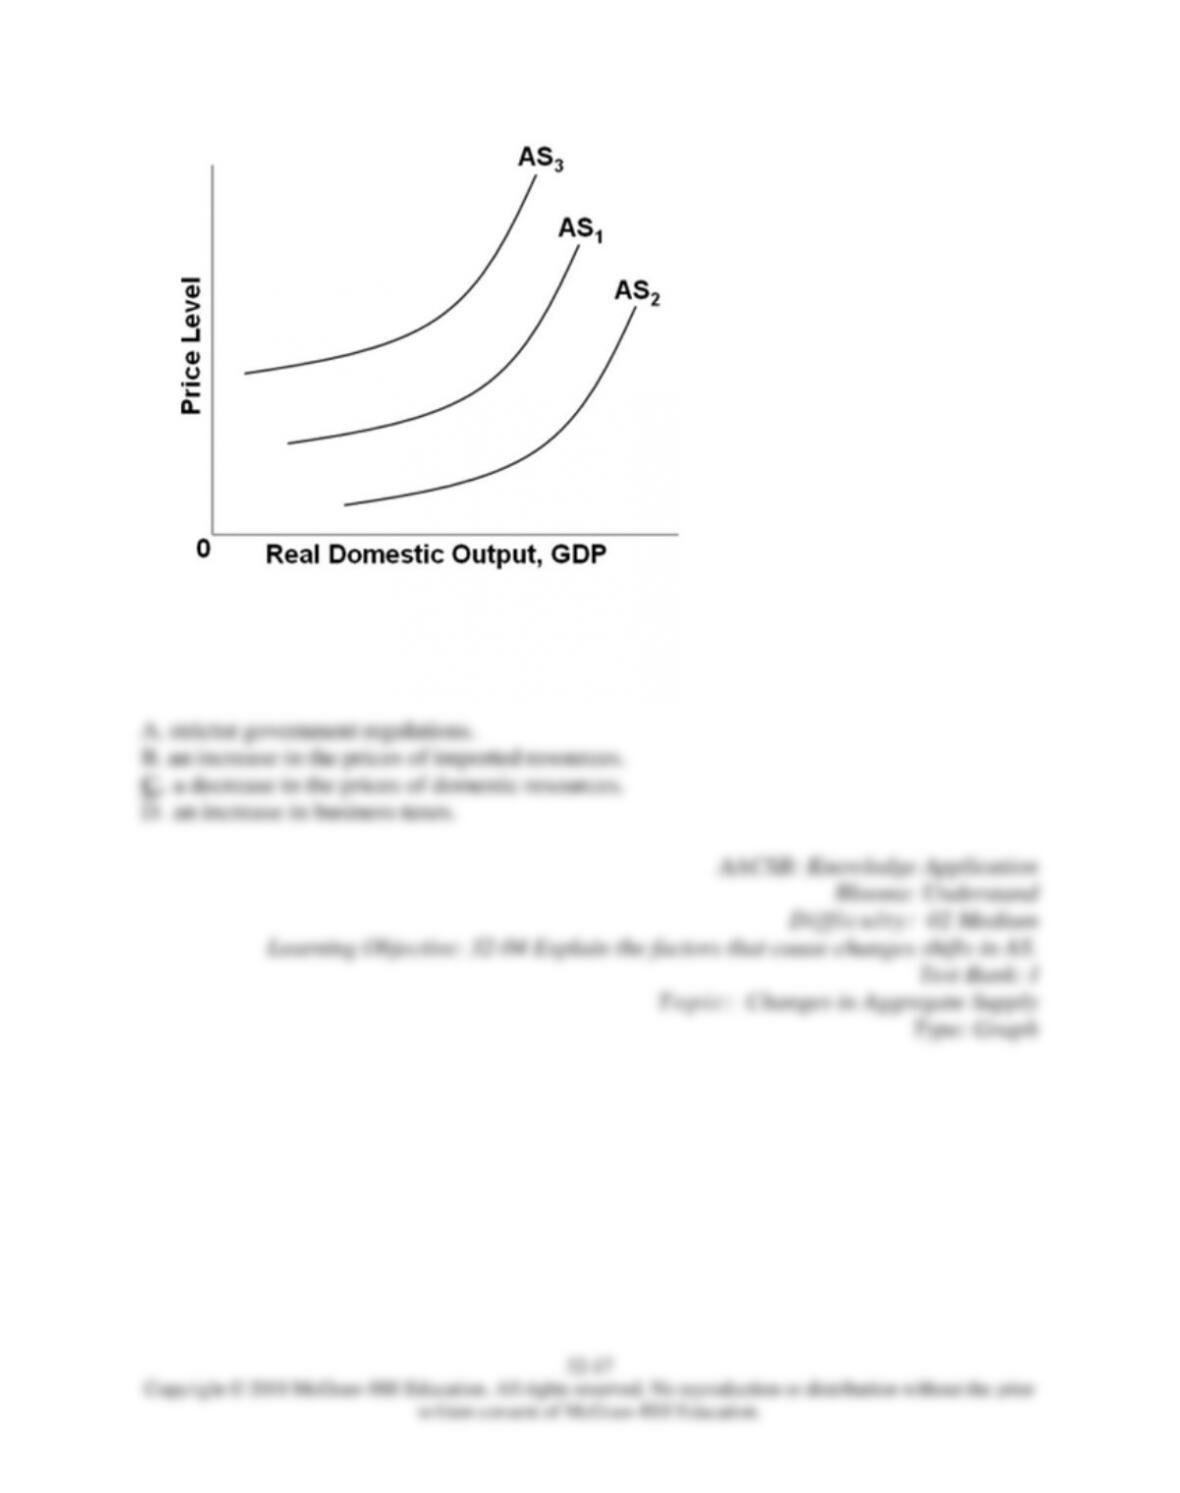
37.
In the diagram, a shift from AS1 to AS2 might be caused by
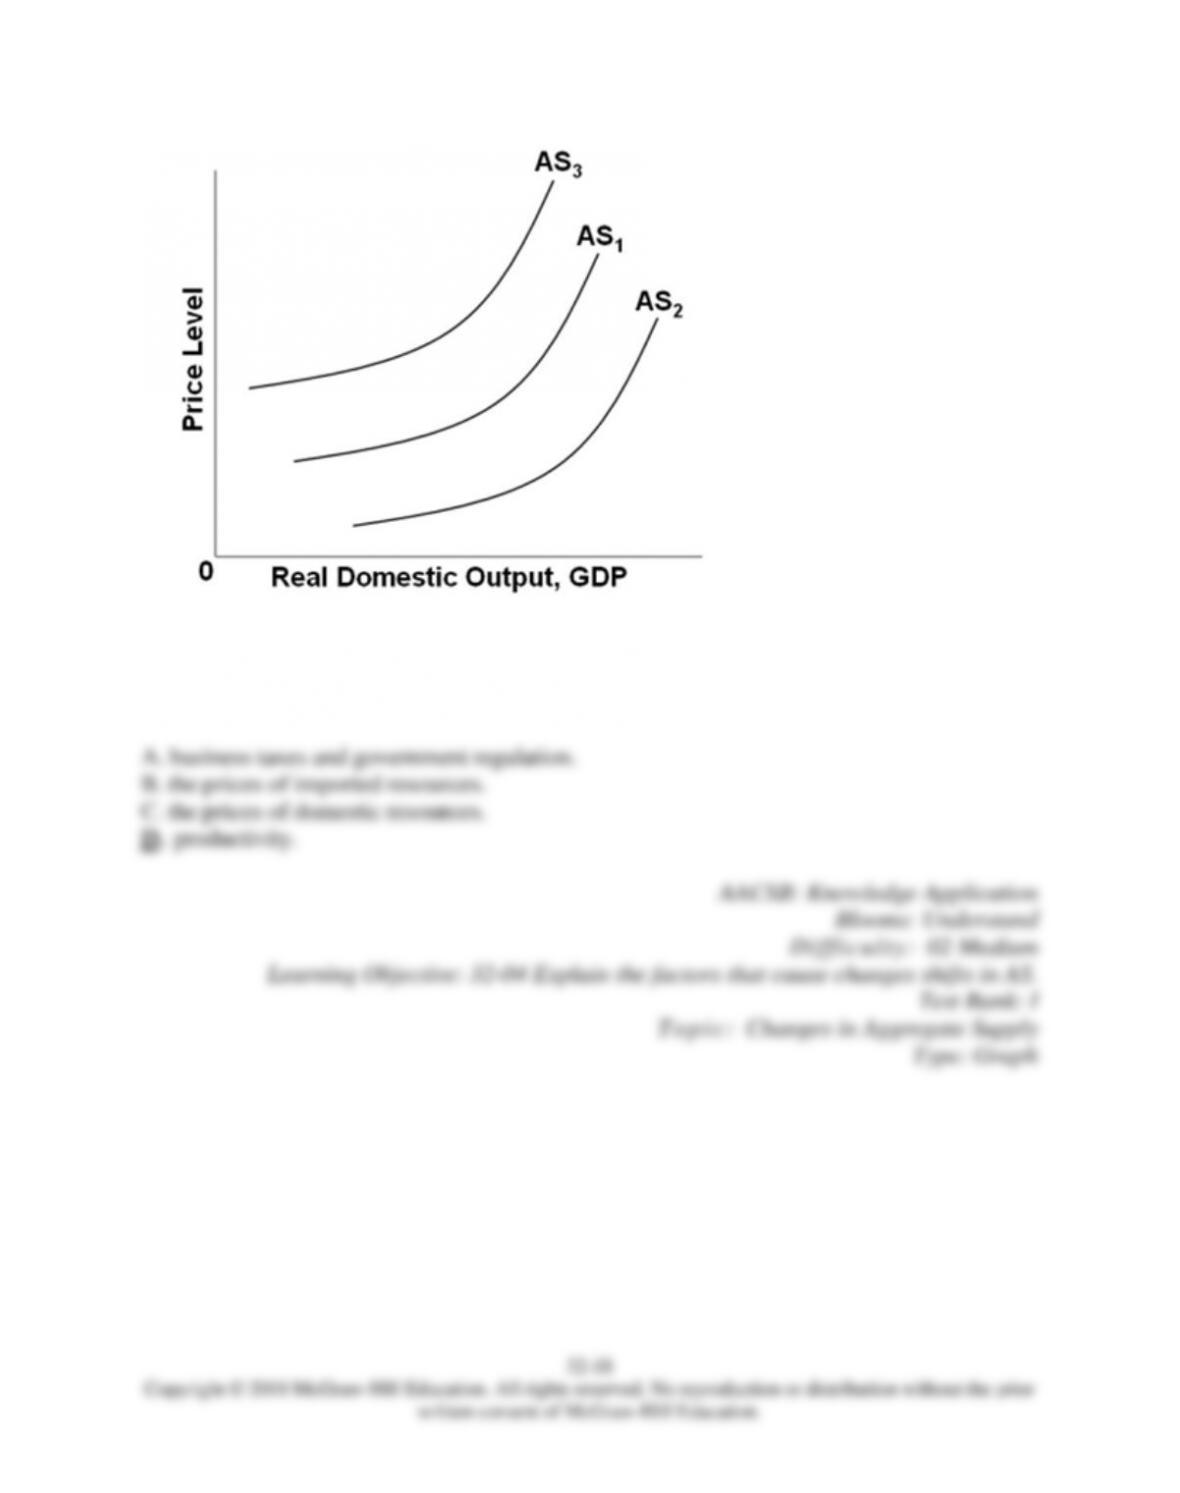
38.
In the diagram, a shift from AS3 to AS2 might be caused by an increase in
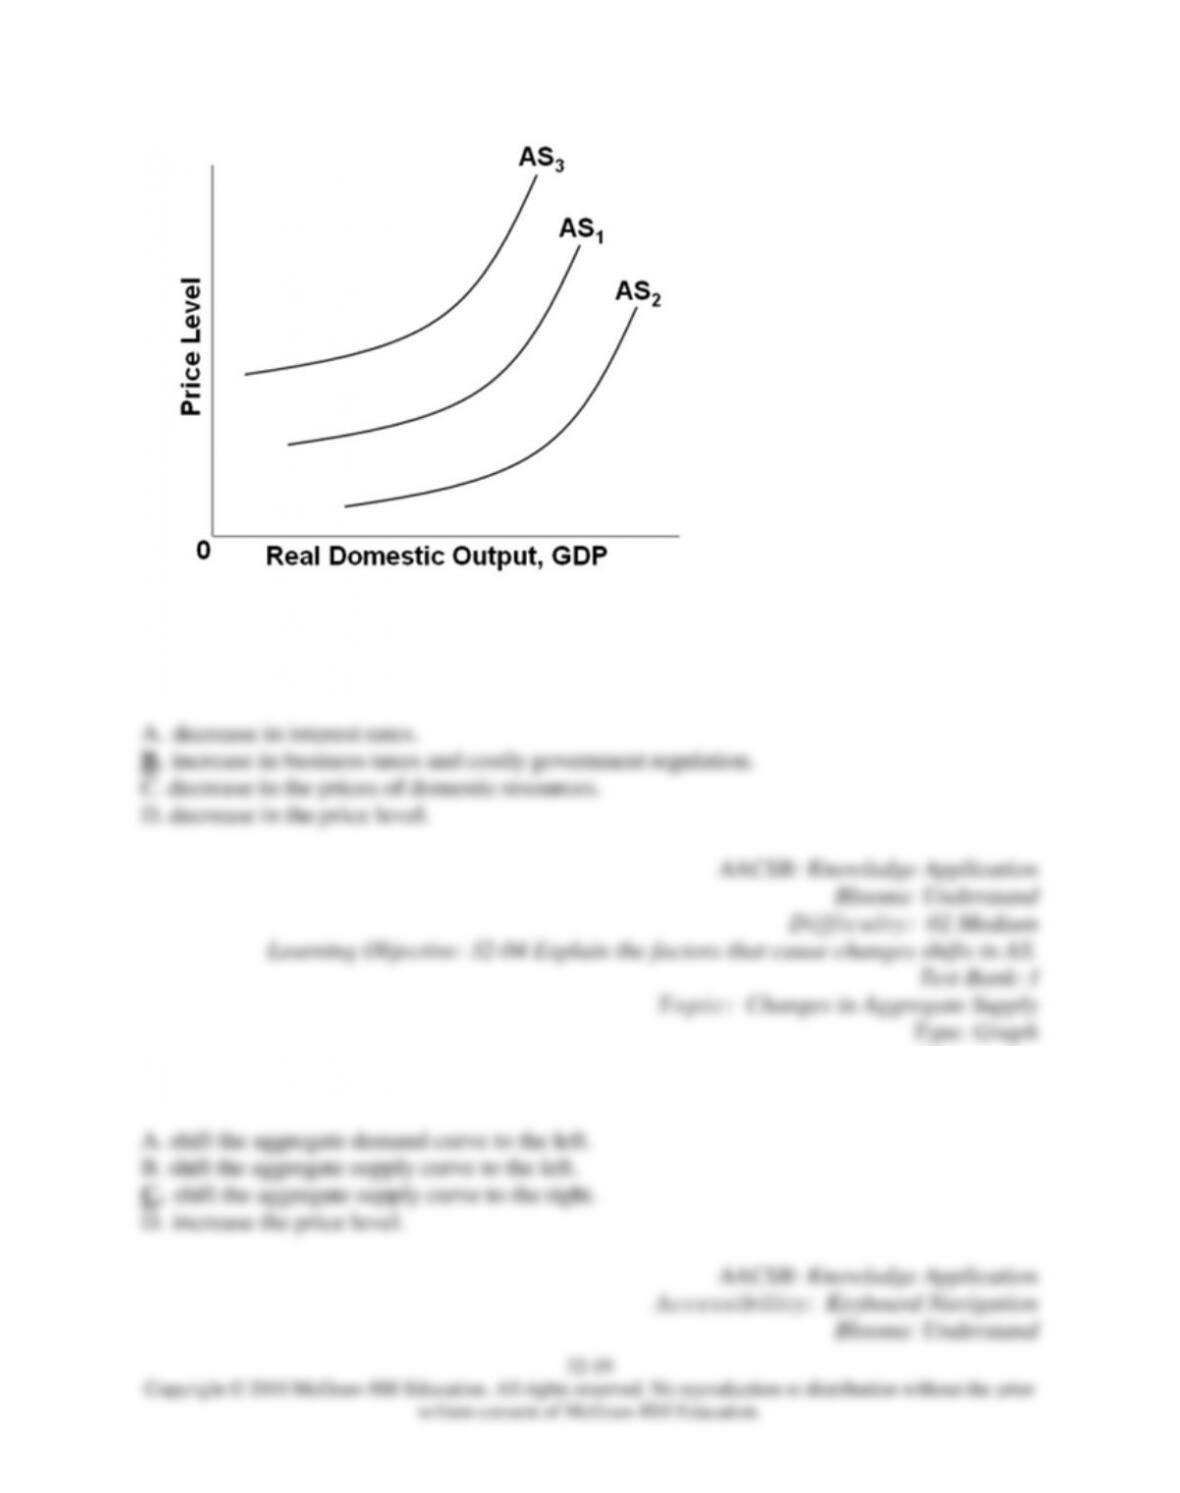
39.
In the diagram, a shift from AS2 to AS3 might be caused by a(n)
40.
Other things equal, an improvement in productivity will
32–20
Copyright © 2018 McGraw-Hill Education. All rights reserved. No reproduction or distribution without the prior
written consent of McGraw-Hill Education.
Di ffi culty: 02 Medium
Learning Objective: 32-04 Explain the factors that cause changes shifts in AS.
Test Bank: I
To pi c : Changes in Aggregate Supply
41.
A rightward shift in the aggregate supply curve is best explained by an increase in
42.
Suppose that real domestic output in an economy is 20 units, the quantity of inputs is 10,
and the price of each input is $4. The level of productivity is
43.
Suppose that real domestic output in an economy is 20 units, the quantity of inputs is 10,
and the price of each input is $4. The per-unit cost of production in the economy described
is