31-161
Copyright © 2018 McGraw-Hill Education. All rights reserved. No reproduction or distribution without the prior
written consent of McGraw-Hill Education.
expenditures and taxes into the aggregate expenditures model.
Test Bank: II
Top i c :
Adding the Public Sector
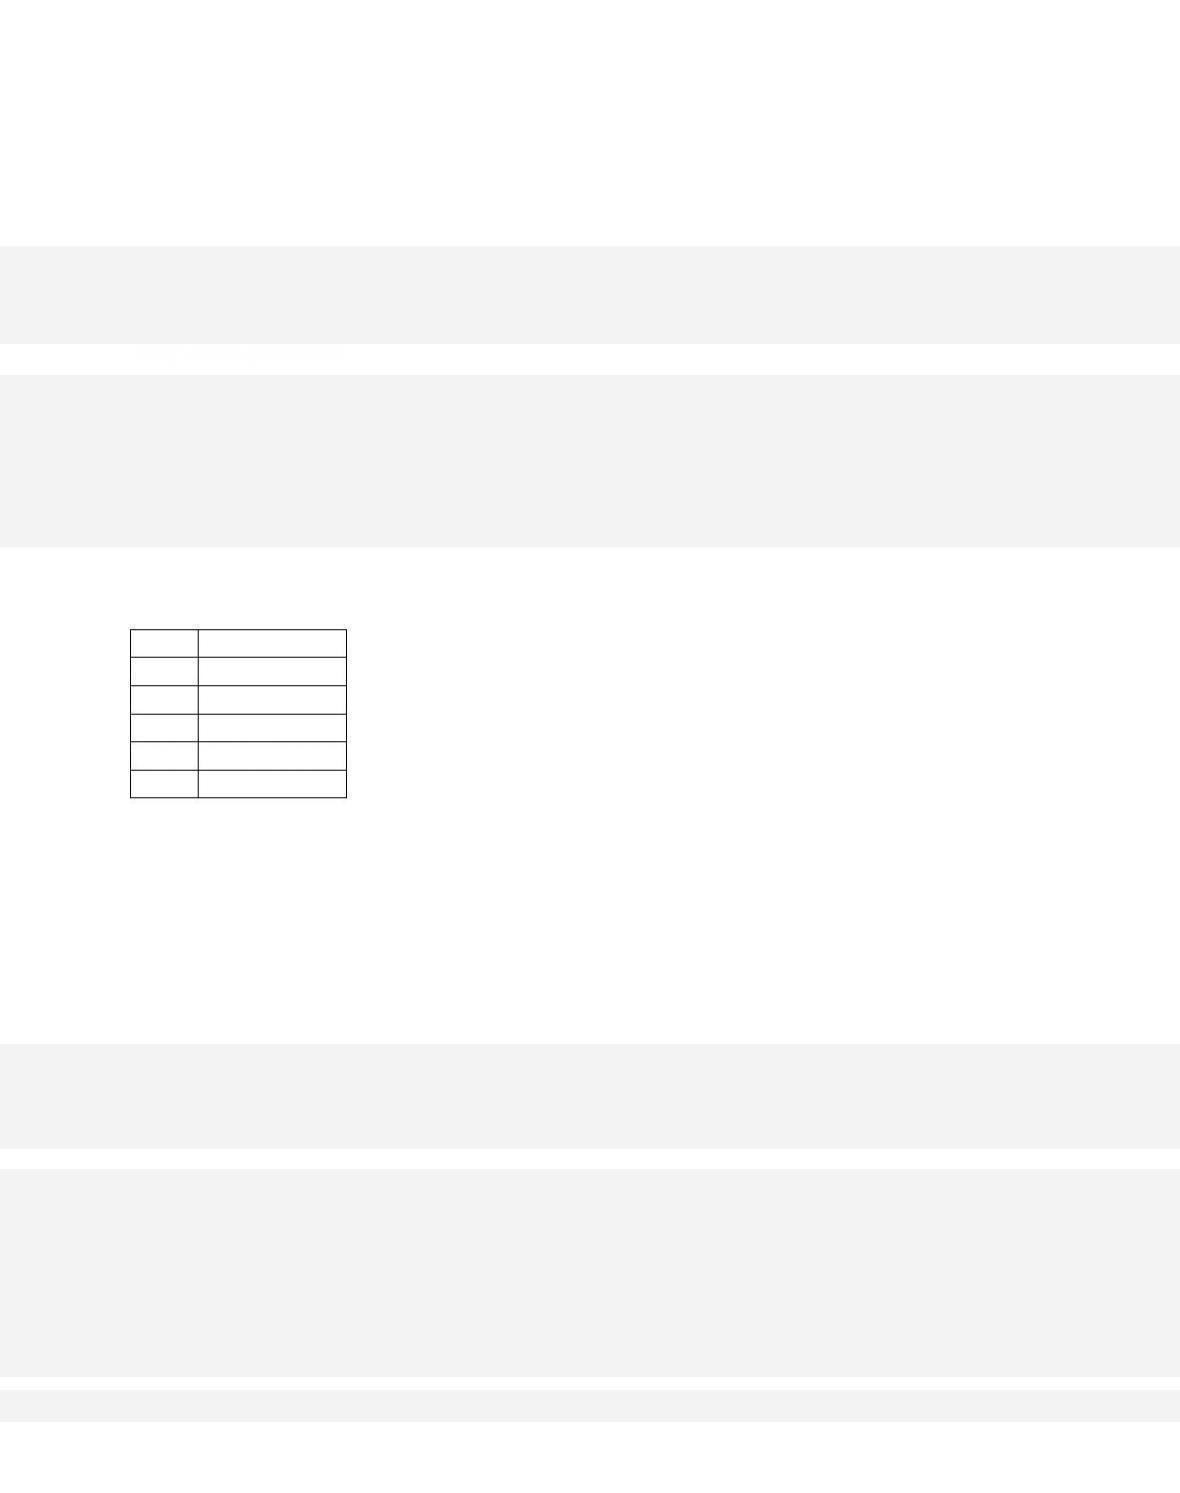
308.
GDP
Consumption
$440
$450
490
490
540
530
590
570
640
610
Refer to the accompanying consumption schedule in an economy. All figures are in billions of
dollars. Given the level of investment at $34 billion, zero net exports, and a lump-sum tax of
$30 billion, the addition of government expenditures of $20 billion at each level of GDP will
result in an equilibrium GDP of
A.
$490 billion.
309.
GDP
Consumption
$240
$244
250
250
260
256
270
262
280
268
290
274
300
280
31-162
310
286
320
292
All figures in the accompanying table are in billions of dollars. Gross investment is $8 billion,
net exports are $4 billion, and government collects a lump-sum tax of $30 billion and spends
$30 billion. Assume all taxes are personal taxes and that government spending does not entail
shifts in the consumption and investment schedules. The equilibrium GDP will be
A.
$280 billion.
310.
In the graph, it is assumed that investment, net exports, and government expenditures
A.
are all increasing.
31-163
Copyright © 2018 McGraw-Hill Education. All rights reserved. No reproduction or distribution without the prior
written consent of McGraw-Hill Education.
B.
vary directly with GDP.
C.
vary inversely with GDP.
D. are independent of GDP.
311.
Refer to the graph. If this economy was an open economy without a government sector, the
level of GDP would be
A.
$100 billion.
31-164
312.
Refer to the graph. The size of the multiplier associated with changes in government spending
in this economy is
A. 2.00.
313.
GDP
Consumption
$600
$580
640
610
680
640
720
670
760
700
The table shows a consumption schedule. All figures are in billions of dollars. If planned
investment was $20 billion, government purchases of goods and services were $20 billion, and
taxes and net exports were zero, then the equilibrium level of GDP would be
A.
$600 billion.
314.
GDP
Consumption
$600
$580
640
610
680
640
720
670
760
700
The table shows a consumption schedule. All figures are in billions of dollars. If lump-sum
taxes were $20 billion, planned investment $45 billion, net exports zero, and government
purchases $20 billion, then equilibrium GDP would be
A.
$640 billion.
31-166
315.
Real GDP
Consumption
$600
$590
610
598
620
606
630
614
640
622
650
630
660
638
The table shows the consumption schedule for a hypothetical economy. All figures are in
billions of dollars. If planned investments were fixed at $16, taxes were zero, government
purchases of goods and services were zero, and net exports were zero, then equilibrium real
GDP would be $630 initially. If government purchases were then raised from $0 to $4, other
things constant, then the equilibrium real GDP would become
A. $660.
316.
Real GDP
Consumption
$600
$590
610
598
620
606
630
614
640
622
650
630
31-167
660
638
The table shows the consumption schedule for a hypothetical economy. All figures are in
billions of dollars. If planned investments were fixed at $16, taxes were zero, government
purchases of goods and services were zero, and net exports were zero, then equilibrium real
GDP would be $630 initially. If government purchases were then raised from $0 to $10, and
lump-sum taxes also increased from $0 to $10, other things constant, then the
equilibrium real GDP would become
A. $660.
317.
In the aggregate expenditures model, we note that an increase in government purchases,
G, and an increase in lump-sum taxes, T, of the same amount will have
A.
the same magnitudes of impact on equilibrium GDP, though in opposite directions.
318.
Injections into the income-expenditure stream include

31-168
Copyright © 2018 McGraw-Hill Education. All rights reserved. No reproduction or distribution without the prior
written consent of McGraw-Hill Education.
A.
transfer payments and imports.
B. government purchases and exports.
C. taxes and imports.
D. taxes and transfer payments.
319.
Leakages from the income-expenditure stream are
A.
consumption, saving, and transfer payments.
320.
In which of the following situations for an open mixed economy will the level of GDP
contract?
A.
when Ca + S + M exceeds Ig + X + T
31-169
Copyright © 2018 McGraw-Hill Education. All rights reserved. No reproduction or distribution without the prior
written consent of McGraw-Hill Education.
Test Bank: II
Top i c :
Adding the Public Sector
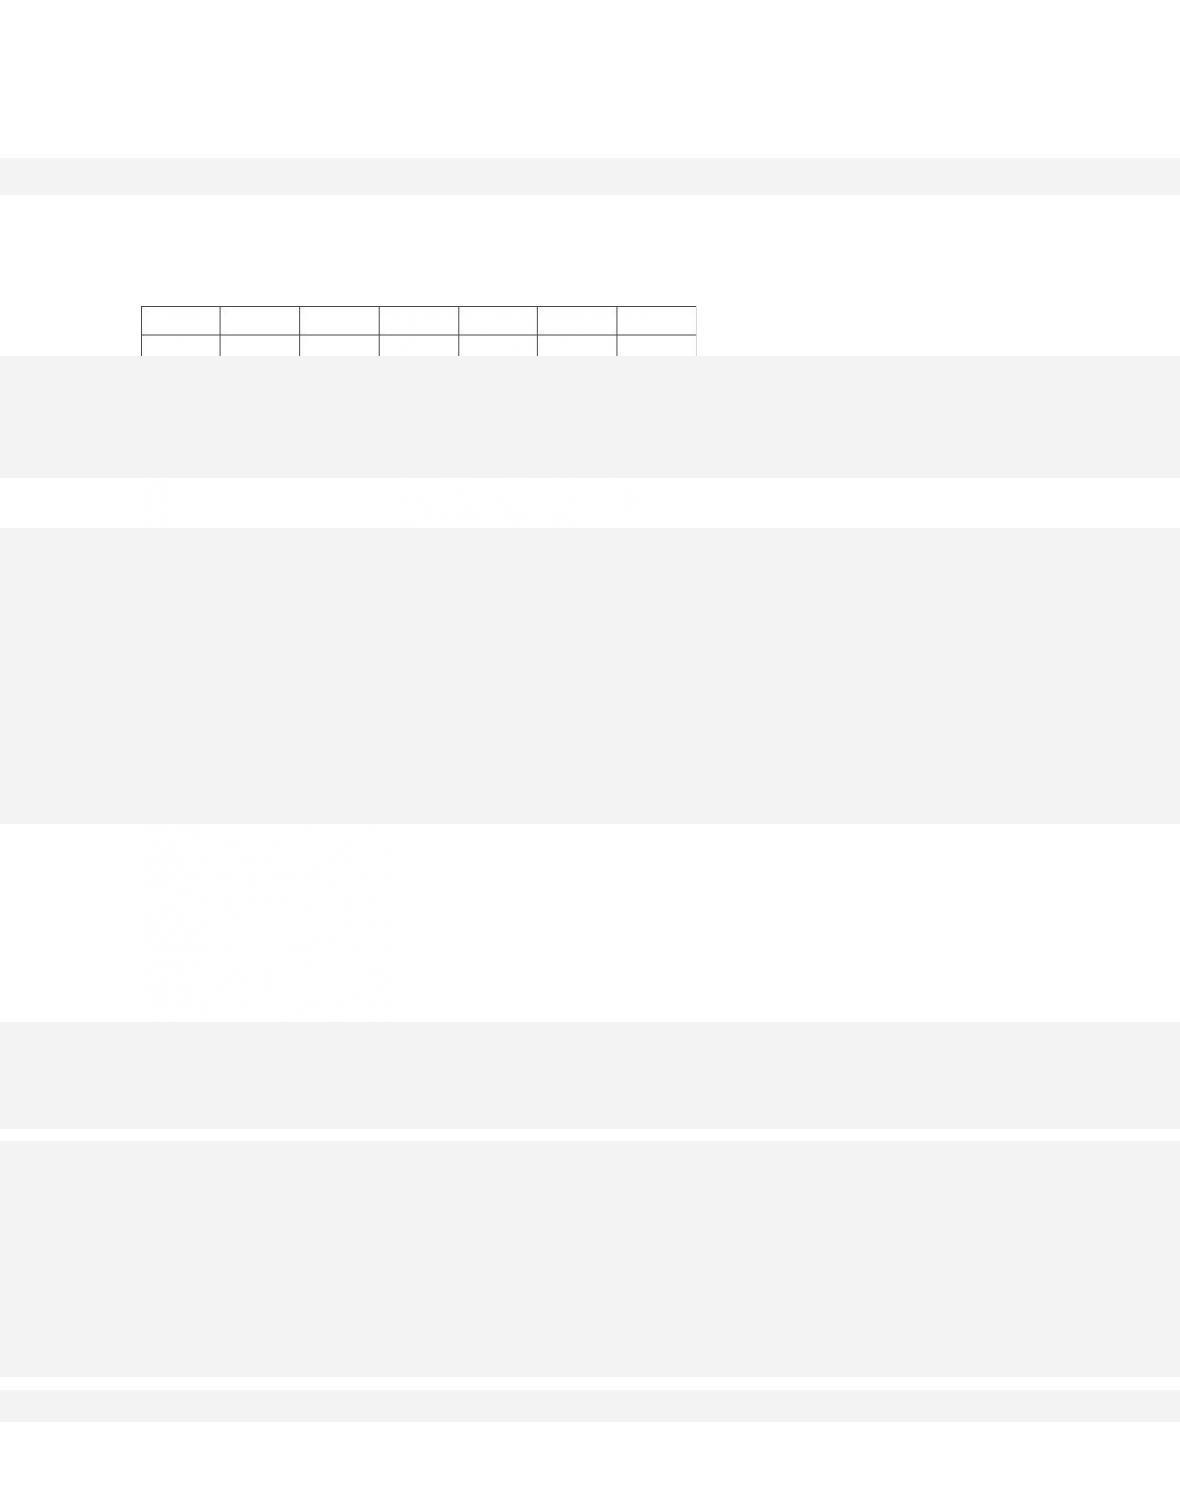
321. The accompanying data show levels of planned variables for an economy. Ig =
Investment; Sa = Saving after taxes; G = Government spending; T = Taxation; X = Exports; M
= Imports. What is the equilibrium level of domestic output?
Ig
Sa
G
T
X
M
A)
22
29
43
35
46
40
B)
24
34
45
39
48
44
C)
26
38
48
42
50
47
D)
28
42
51
47
53
51
A. choice A
322. A constitutional amendment is passed that requires the government to have an annually
balanced budget in the sense that changes in spending should be matched by equivalent
changes in taxes. Should the government desire to increase GDP by $25 billion and meet the
provisions of the law, it
A.
cannot possibly reach its objective without breaking the law.
323. If a government raises its expenditures by $50 billion and at the same time levies a lump–
sum tax of $50 billion, the net effect on the economy will be to
A.
increase GDP by less than $50 billion.
324. A personal tax cut of $50 billion will affect income differently than an increase in
government spending by $50 billion because
A.
the increase in government spending will produce a political business cycle.
325. If the marginal propensity to consume is 0.80 and both taxes and government purchases
increase by $50 billion, GDP will
D. decrease by $10 billion.
31-171
Copyright © 2018 McGraw-Hill Education. All rights reserved. No reproduction or distribution without the prior
written consent of McGraw-Hill Education.
Accessibility:
Keyboard Navigation
Blooms: Understand
Di f f i c u lt y :
02 Medium
Learning Objective: 31-07 Explain how economists integrate the public sector government
expenditures and taxes into the aggregate expenditures model.
Test Bank: II
Top i c :
Adding the Public Sector
326. Suppose the GDP is in equilibrium at full employment and the MPC is 0.80. If
government wants to increase its purchase of goods and services by $16 billion without
changing equilibrium GDP, taxes should be
D. reduced by $20 billion.
327. The effect of a decline in taxes on the level of income will differ somewhat from an
increase in government expenditures of the same amount because
A.
tax declines tend to be more expansionary

328. Assuming that MPC is 0.75, equal increases in government spending and tax collections
by $10 billion will
A.
leave the equilibrium GDP unchanged.
329. In the aggregate expenditures model, the equilibrium GDP is
A.
assumed to be equal to the potential GDP level.
330. In a recessionary expenditure gap, the equilibrium level of real GDP is
A.
less than planned aggregate expenditures.

31-173
Copyright © 2018 McGraw-Hill Education. All rights reserved. No reproduction or distribution without the prior
written consent of McGraw-Hill Education.
Difficult y:
03 Hard
Learning Objective: 31-08 Differentiate between equilibrium GDP and full-employment GDP
and identify and describe the nature and causes of recessionary expenditure gaps and
inflationary expenditure gaps.
Test Bank: II
Top i c :
Equilibrium versus Full-Employment GDP
331. The amount by which an aggregate expenditures schedule must shift upward to achieve
the full-employment GDP is a(n)
D. negative net export gap.
332. In an inflationary expenditure gap, the equilibrium level of real GDP is
A.
greater than planned investment.
333. An economy characterized by high unemployment is likely to be

A.
experiencing a high rate of economic growth.
334. If the MPC in an economy is 0.8, government could close a recessionary expenditure gap
of $100 billion by cutting taxes by
A.
$80 billion.
335. Assume that the marginal propensity to consume in an economy is 0.75. If the economy’s
full-employment real GDP is $900 billion and its equilibrium real GDP is $800 billion, there is
a recessionary expenditure gap of
D. $400 billion.

31-175
Copyright © 2018 McGraw-Hill Education. All rights reserved. No reproduction or distribution without the prior
written consent of McGraw-Hill Education.
Blooms: Analyze
Difficult y:
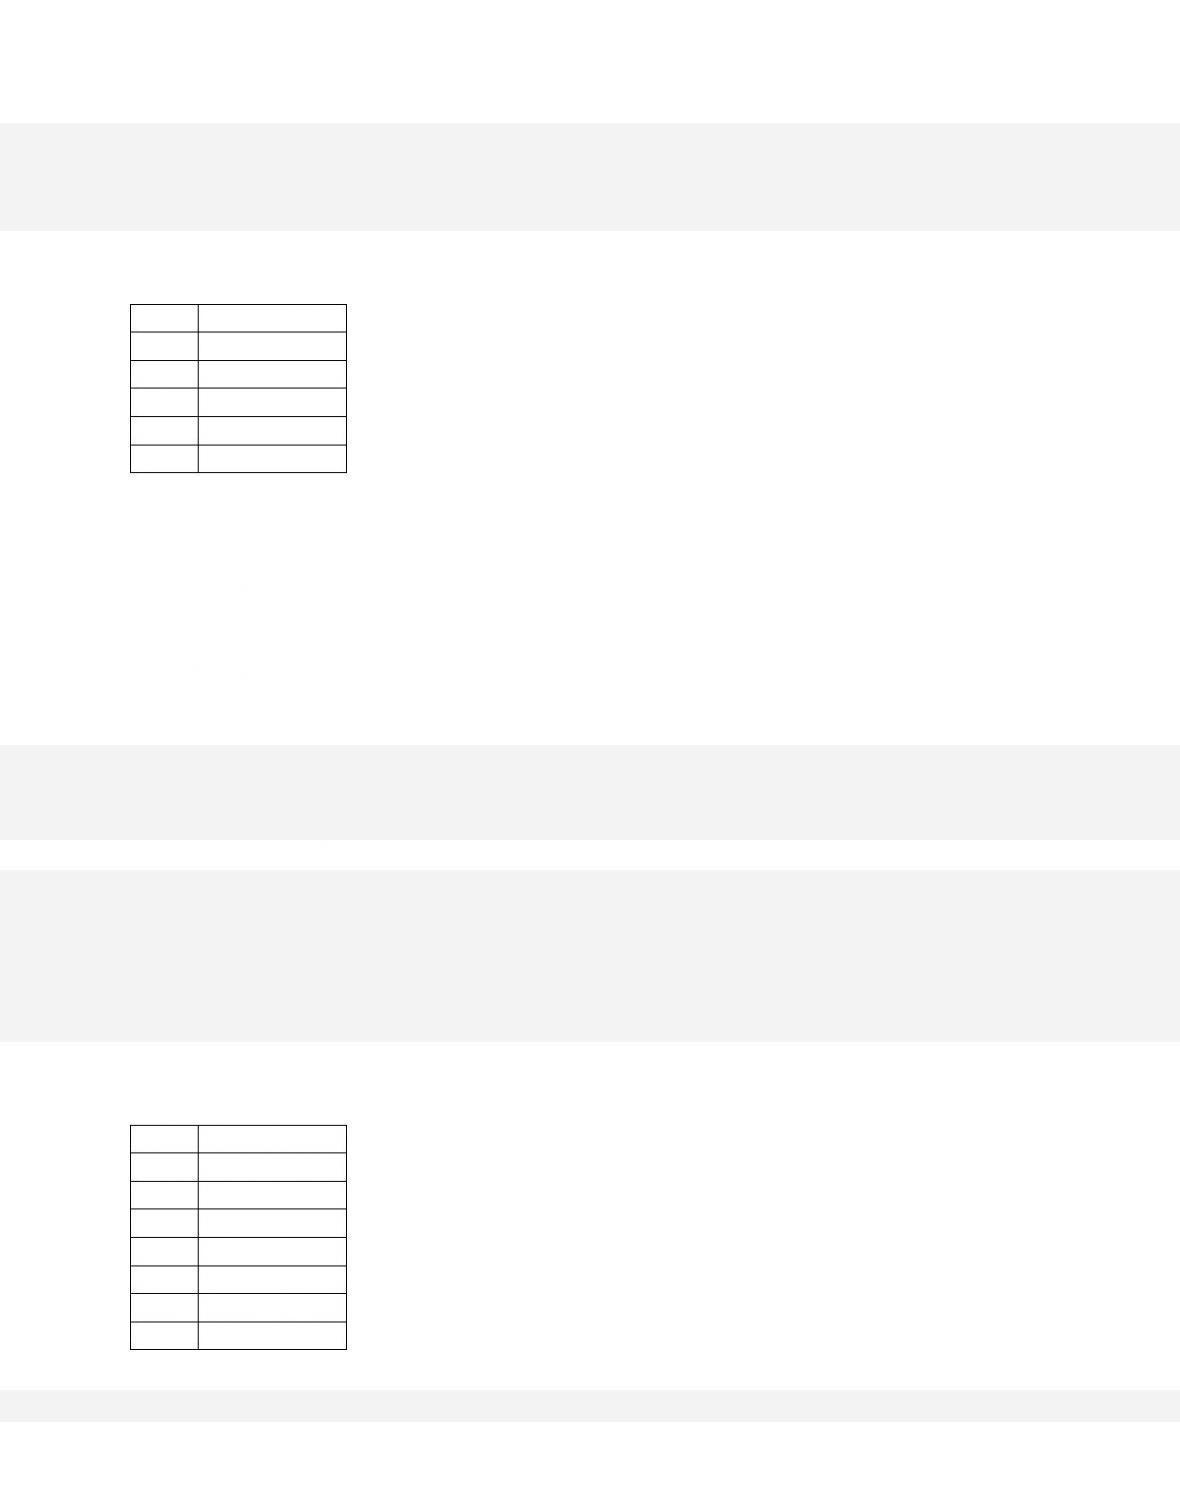
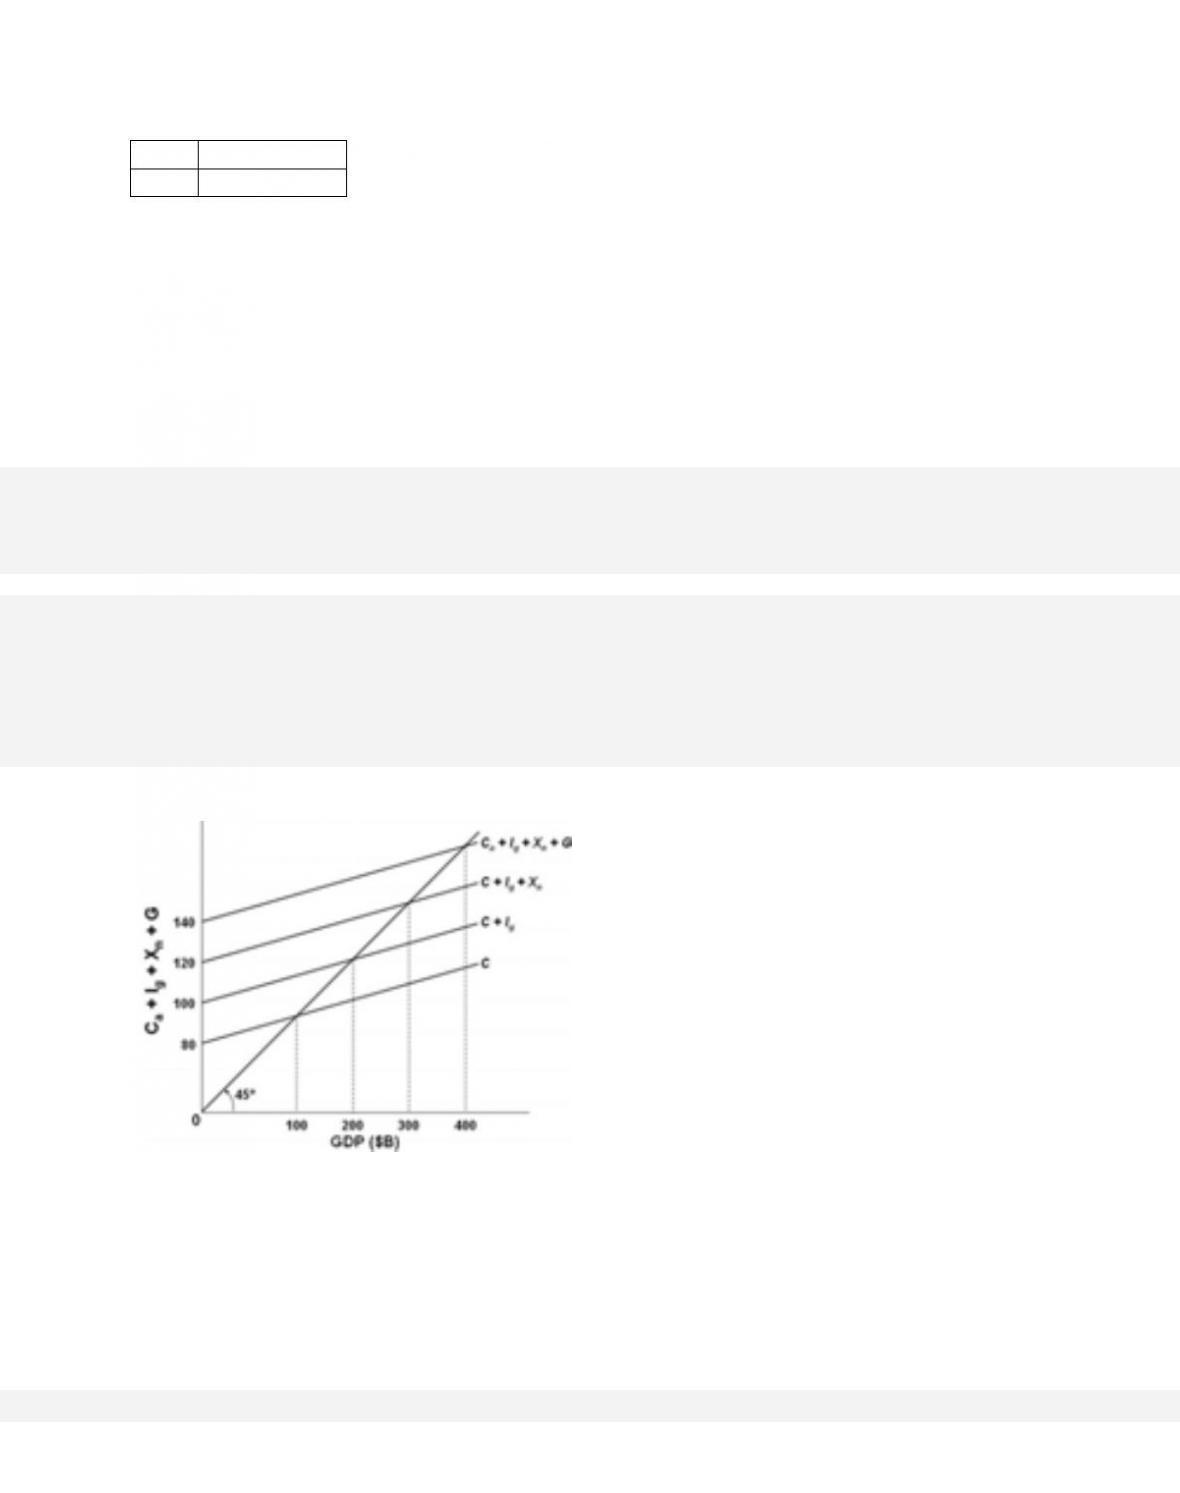
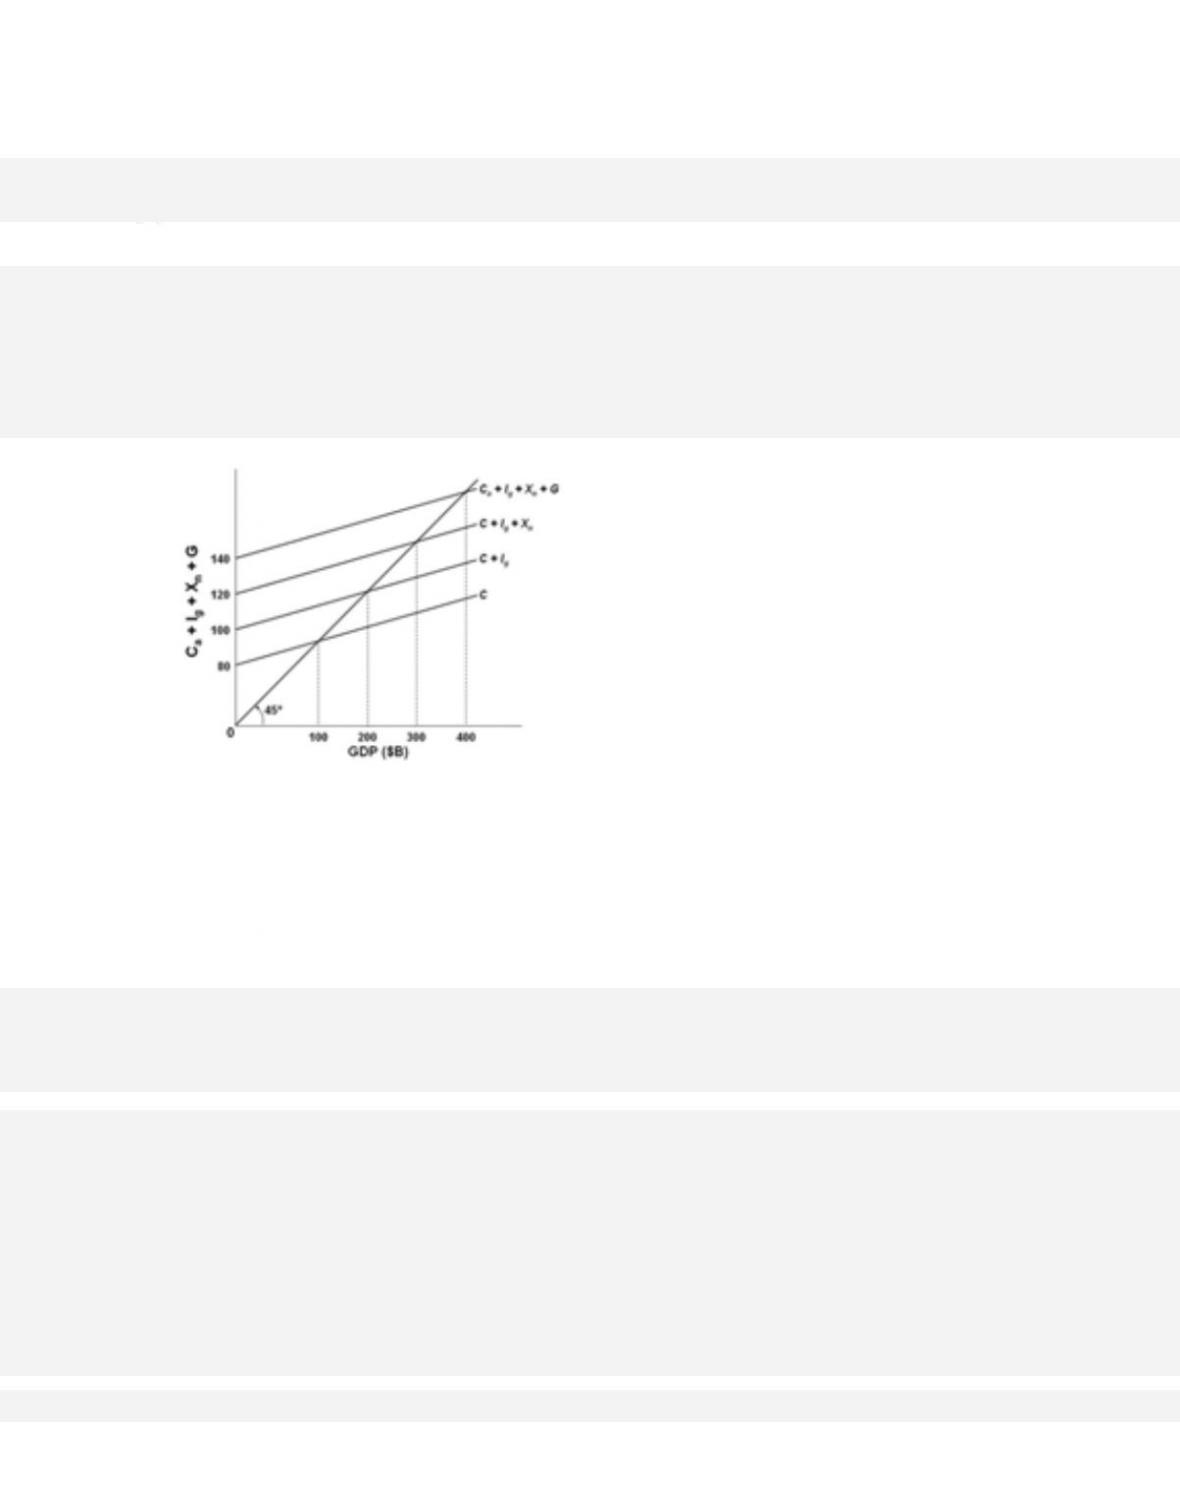
03 Hard
Learning Objective: 31-08 Differentiate between equilibrium GDP and full-employment GDP
and identify and describe the nature and causes of recessionary expenditure gaps and
inflationary expenditure gaps.
Test Bank: II
Top i c :
Equilibrium versus Full-Employment GDP
336. Assume that the marginal propensity to consume in an economy is 0.9. If the economy’s
full-employment real GDP is $500 billion and its equilibrium real GDP is $550 billion, there is
an inflationary expenditure gap of
D. $500 billion.
337. To close an inflationary expenditure gap of $20 billion in an economy with a marginal
propensity to consume of 0.8, it would be necessary to
D. increase the aggregate expenditures schedule by $4 billion.
31-176
338. The amount by which aggregate expenditures exceed those associated with the full-
employment level of domestic output can best be described as
A.
a recessionary expenditure gap.
339. If the MPC is 0.80, all taxes are lump-sum taxes, and the equilibrium GDP is $25 billion
below the full-employment GDP, then the size of the recessionary expenditure gap is
A.
$2 billion.
340. If the economy has a recessionary expenditure gap of $15 billion and the MPS is 0.3, then
the equilibrium level of GDP is
A.
$16 billion below the full-employment level.