
31–81
A. $600.
147. Ca = 25 + 0.75 (Y – T)
Ig = 50
Xn = 10
G = 70
T = 30
(Advanced analysis) The accompanying equations are for a mixed open economy. The letters
Y, Ca, Ig, Xn, G, and T stand for GDP, consumption, gross investment, net exports, government
purchases, and net taxes, respectively. Figures are in billions of dollars. The multiplier for this
economy is
D. 2.33.

31–82
Copyright © 2018 McGraw-Hill Education. All rights reserved. No reproduction or distribution without the prior
written consent of McGraw-Hill Education.
expenditures and taxes into the aggregate expenditures model.
Test Bank: I
To pi c:
Adding the Public Sector
148. Ca = 25 + 0.75 (Y – T)
Ig = 50
Xn = 10
G = 70
T = 30
(Advanced analysis) The accompanying equations are for a mixed open economy. The letters
Y, Ca, Ig, Xn, G, and T stand for GDP, consumption, gross investment, net exports, government
purchases, and net taxes, respectively. Figures are in billions of dollars. If government desired
to raise the equilibrium GDP to $650, it could
A.
raise G by $45 and reduce T by $10.
149. Ca = 25 + 0.75 (Y – T)
Ig = 50
Xn = 10
G = 70

31–83
T = 30
(Advanced analysis) The accompanying equations are for a mixed open economy. The letters
Y, Ca, Ig, Xn, G, and T stand for GDP, consumption, gross investment, net exports, government
purchases, and net taxes, respectively. Figures are in billions of dollars. If the economy’s tax
schedule was T = 0.2Y rather than T = T0 = 30, the equilibrium GDP would be
D. $412.
150. Which of the following would increase GDP by the greatest amount?
A.
a $20 billion reduction in taxes
151. Which of the following would reduce GDP by the greatest amount?
A.
a $20 billion increase in taxes

31–84
Copyright © 2018 McGraw-Hill Education. All rights reserved. No reproduction or distribution without the prior
written consent of McGraw-Hill Education.
C.
$20 billion decreases in both government spending and taxes
D. a $20 billion decrease in government spending
152. What do investment and government expenditures have in common?
C. Neither is subject to the multiplier effect.
D. Both represent a decline in indebtedness.
153. Taxes represent
D. a leakage of purchasing power, like government spending.
31–85
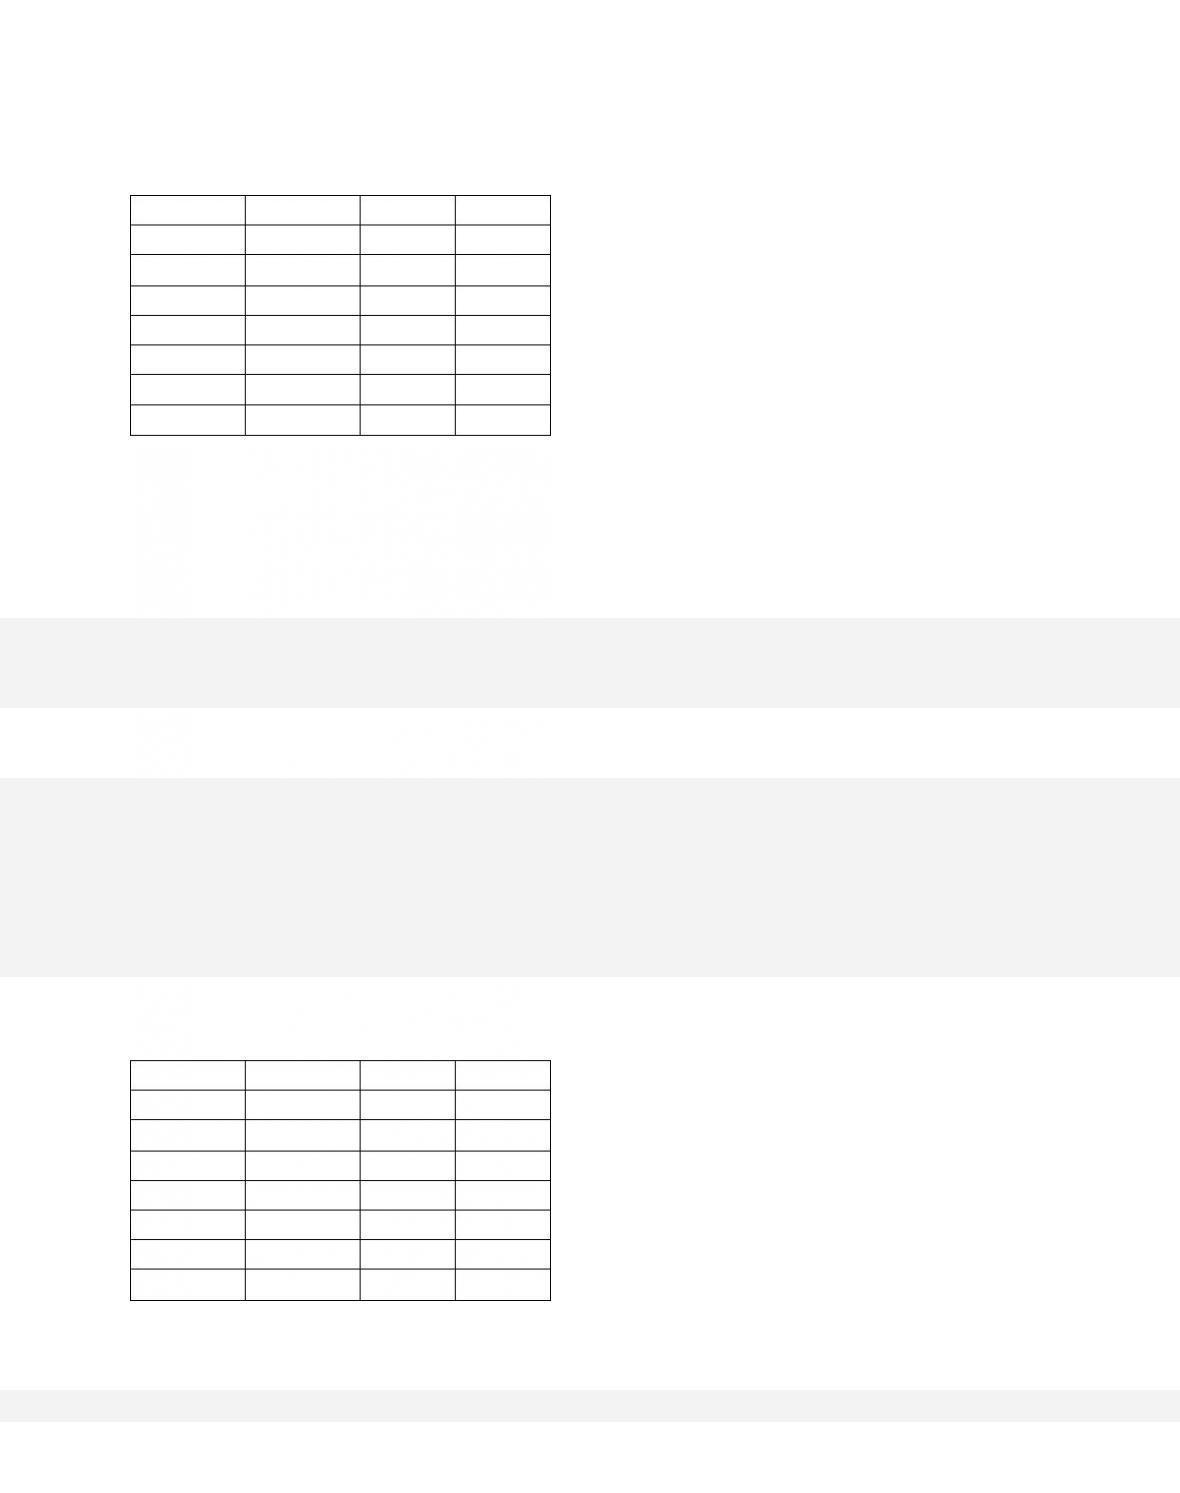
154.
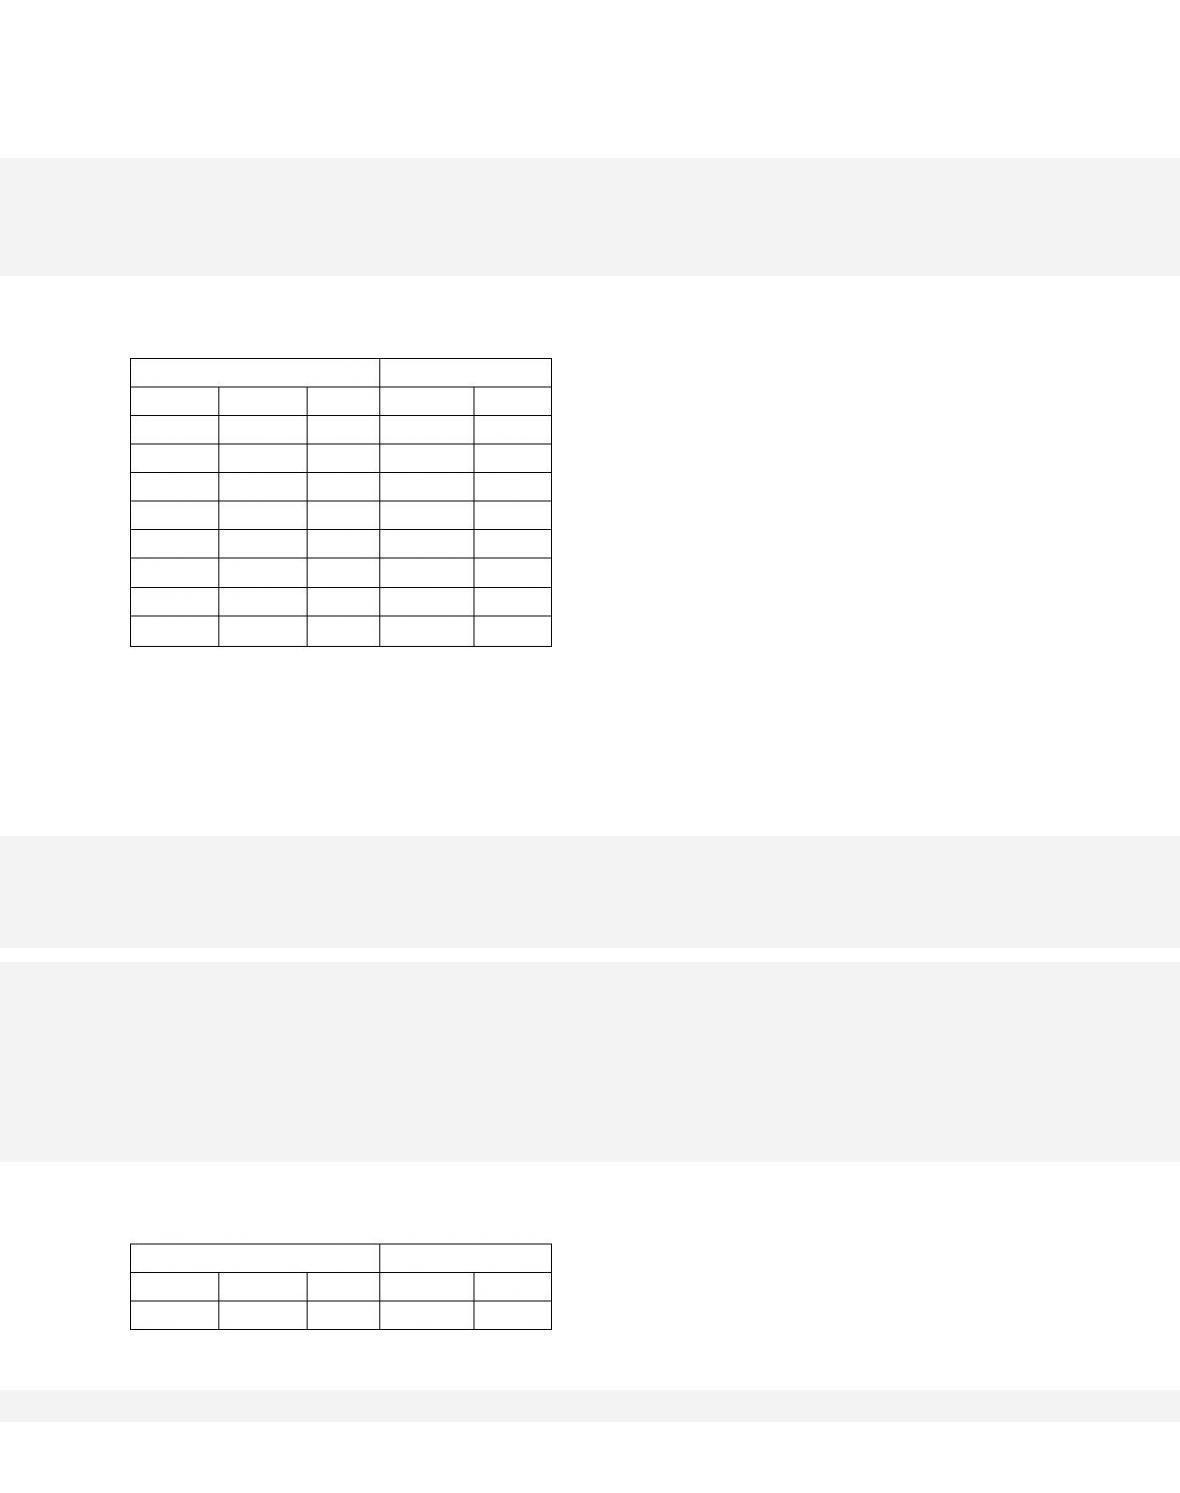
GDP
C
S
Ig
$100
$100
$0
$80
200
160
40
80
300
220
80
80
400
280
120
80
500
340
160
80
600
400
200
80
700
460
240
80
Refer to the accompanying information for a closed economy. If both government spending and
taxes are zero, the equilibrium level of GDP is
D. $500.
155.
GDP
C
S
Ig
$100
$100
$0
$80
200
160
40
80
300
220
80
80
400
280
120
80
500
340
160
80
600
400
200
80
700
460
240
80
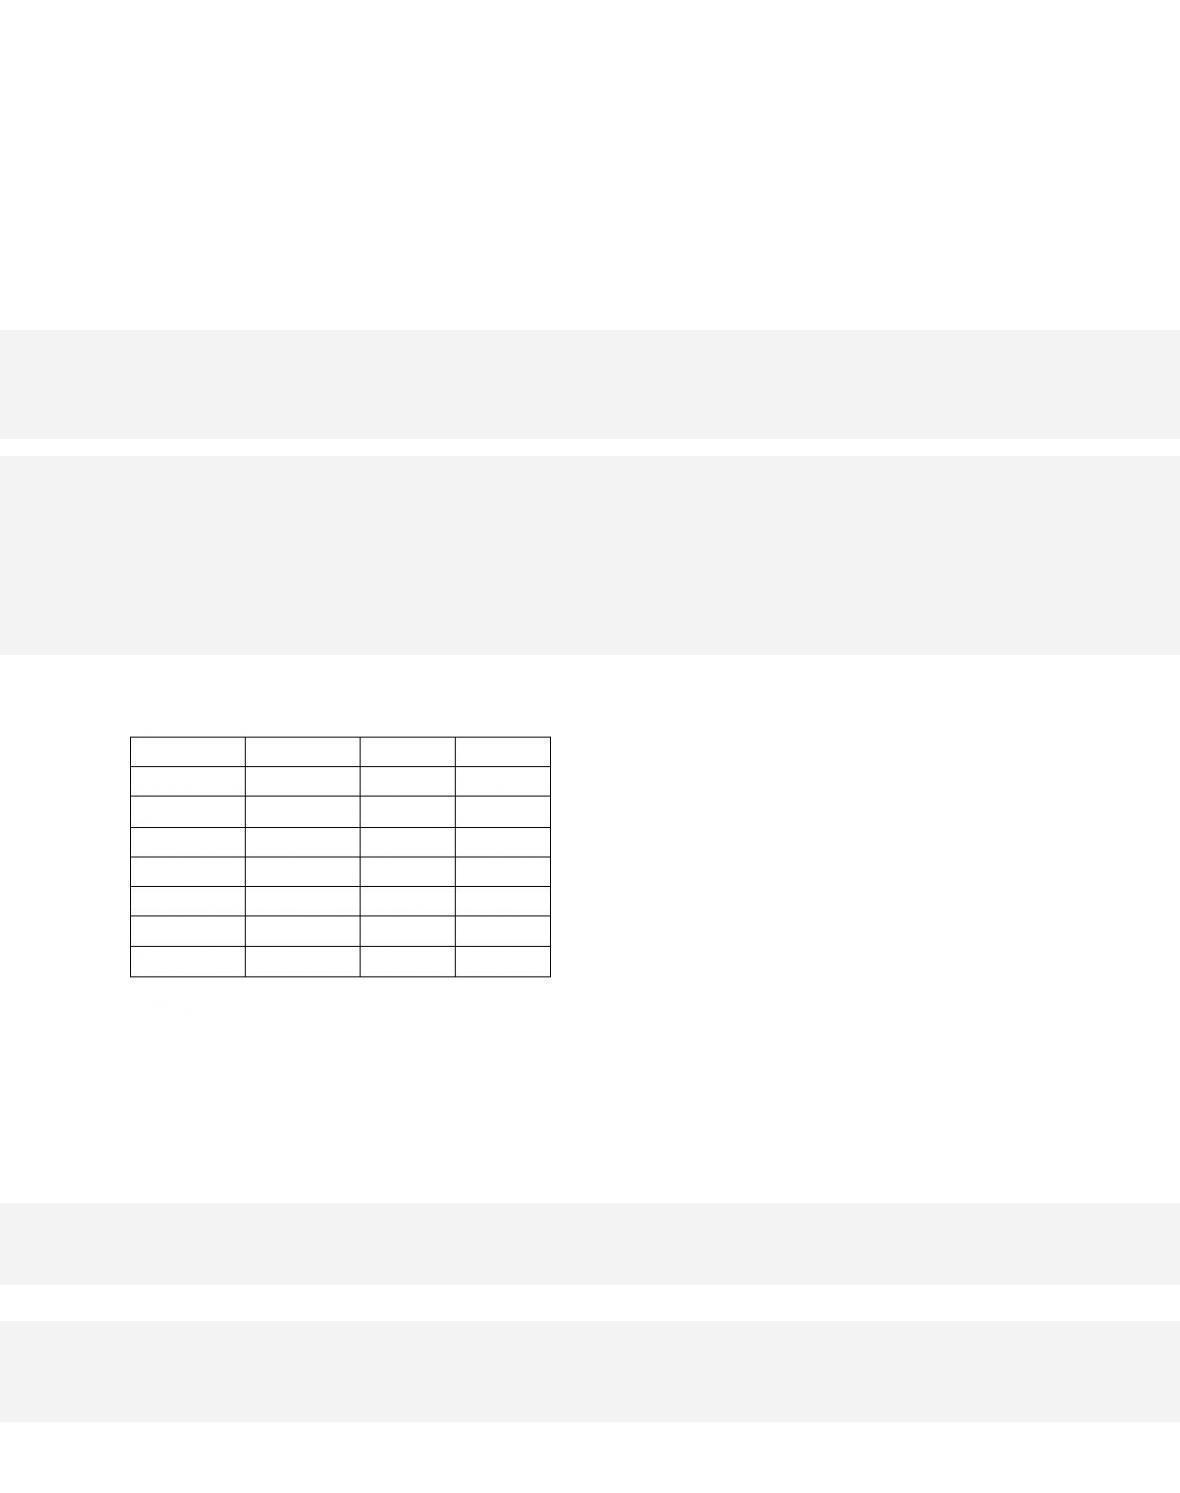
Refer to the accompanying information for a closed economy. If government now spends $80
billion at each level of GDP and taxes remain at zero, the equilibrium GDP
A.
will rise to $700.
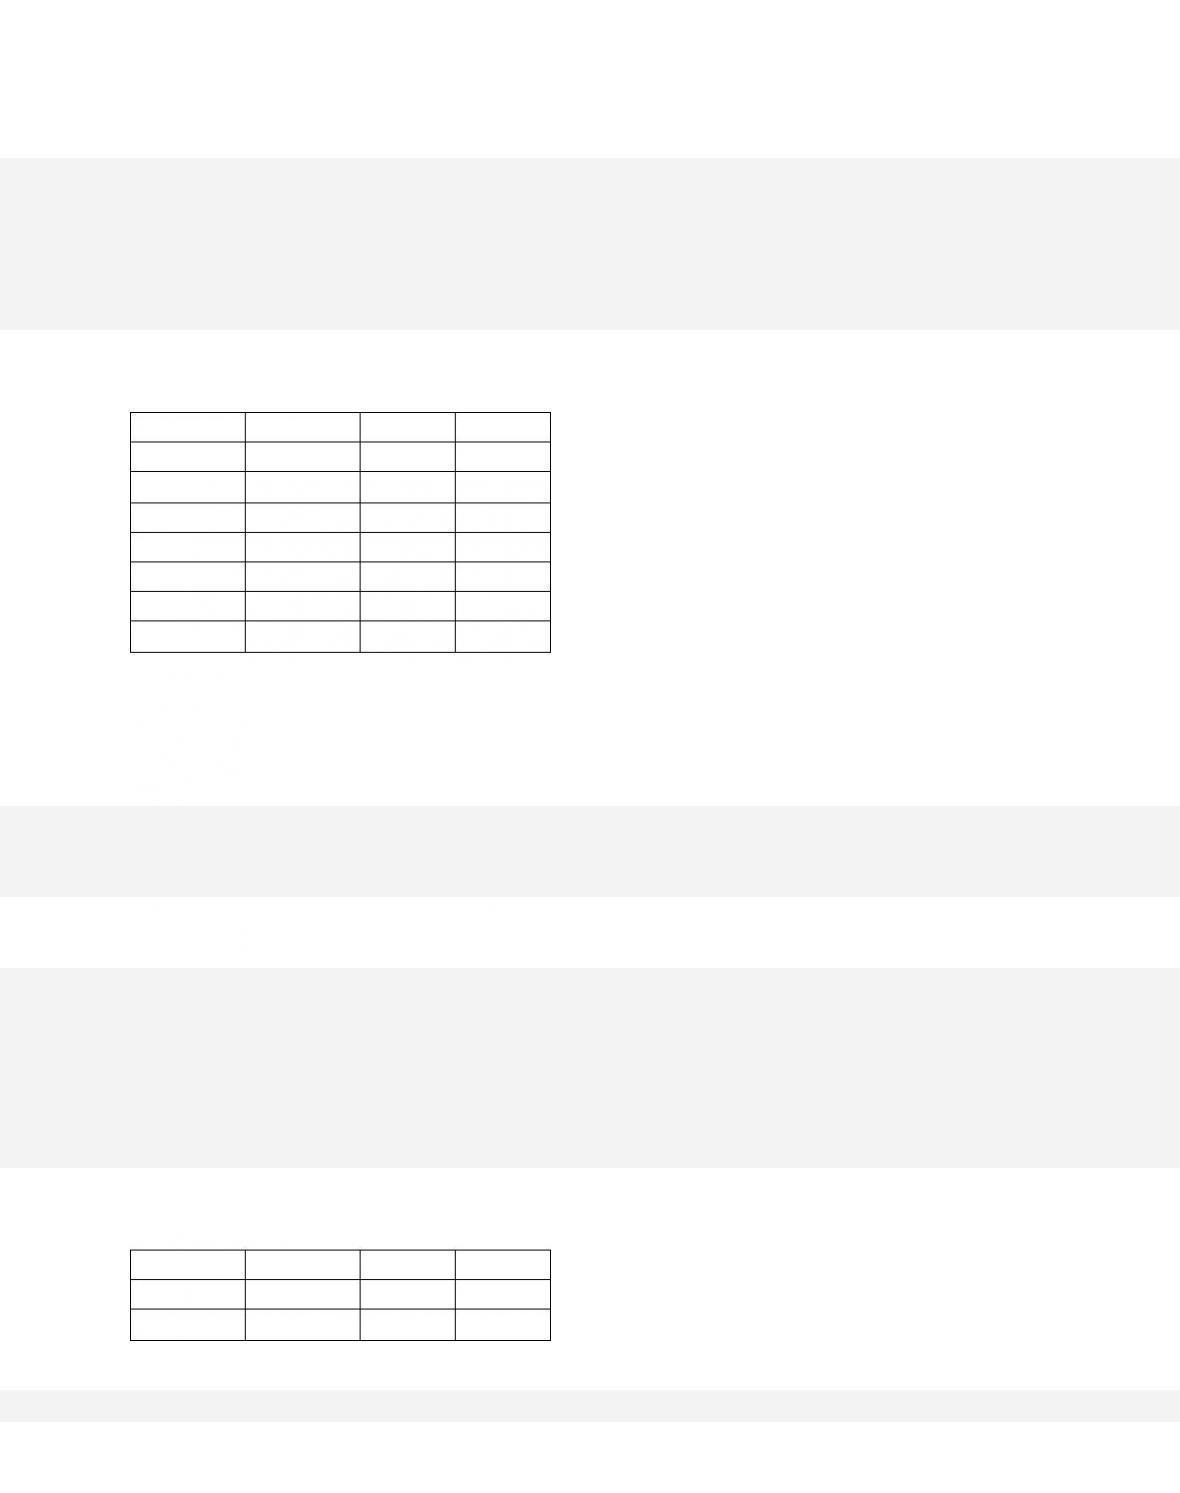
156.
GDP
C
S
Ig
$100
$100
$0
$80
200
160
40
80
300
220
80
80
400
280
120
80
500
340
160
80
600
400
200
80
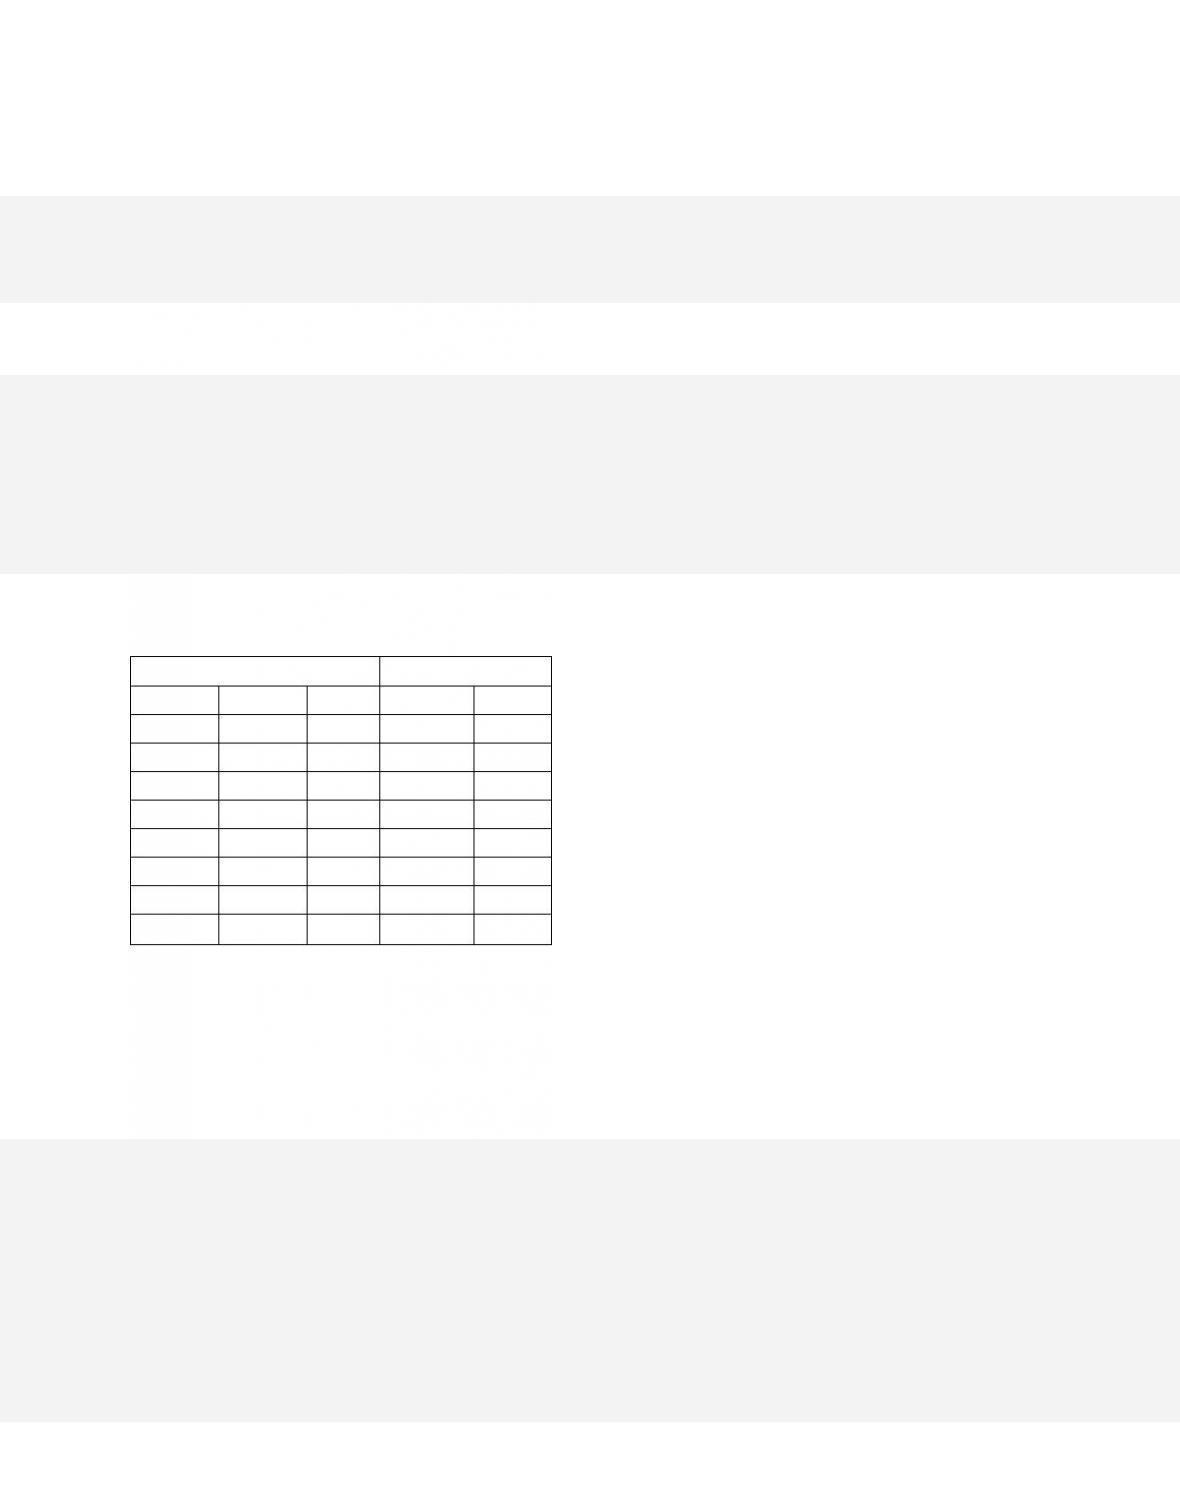
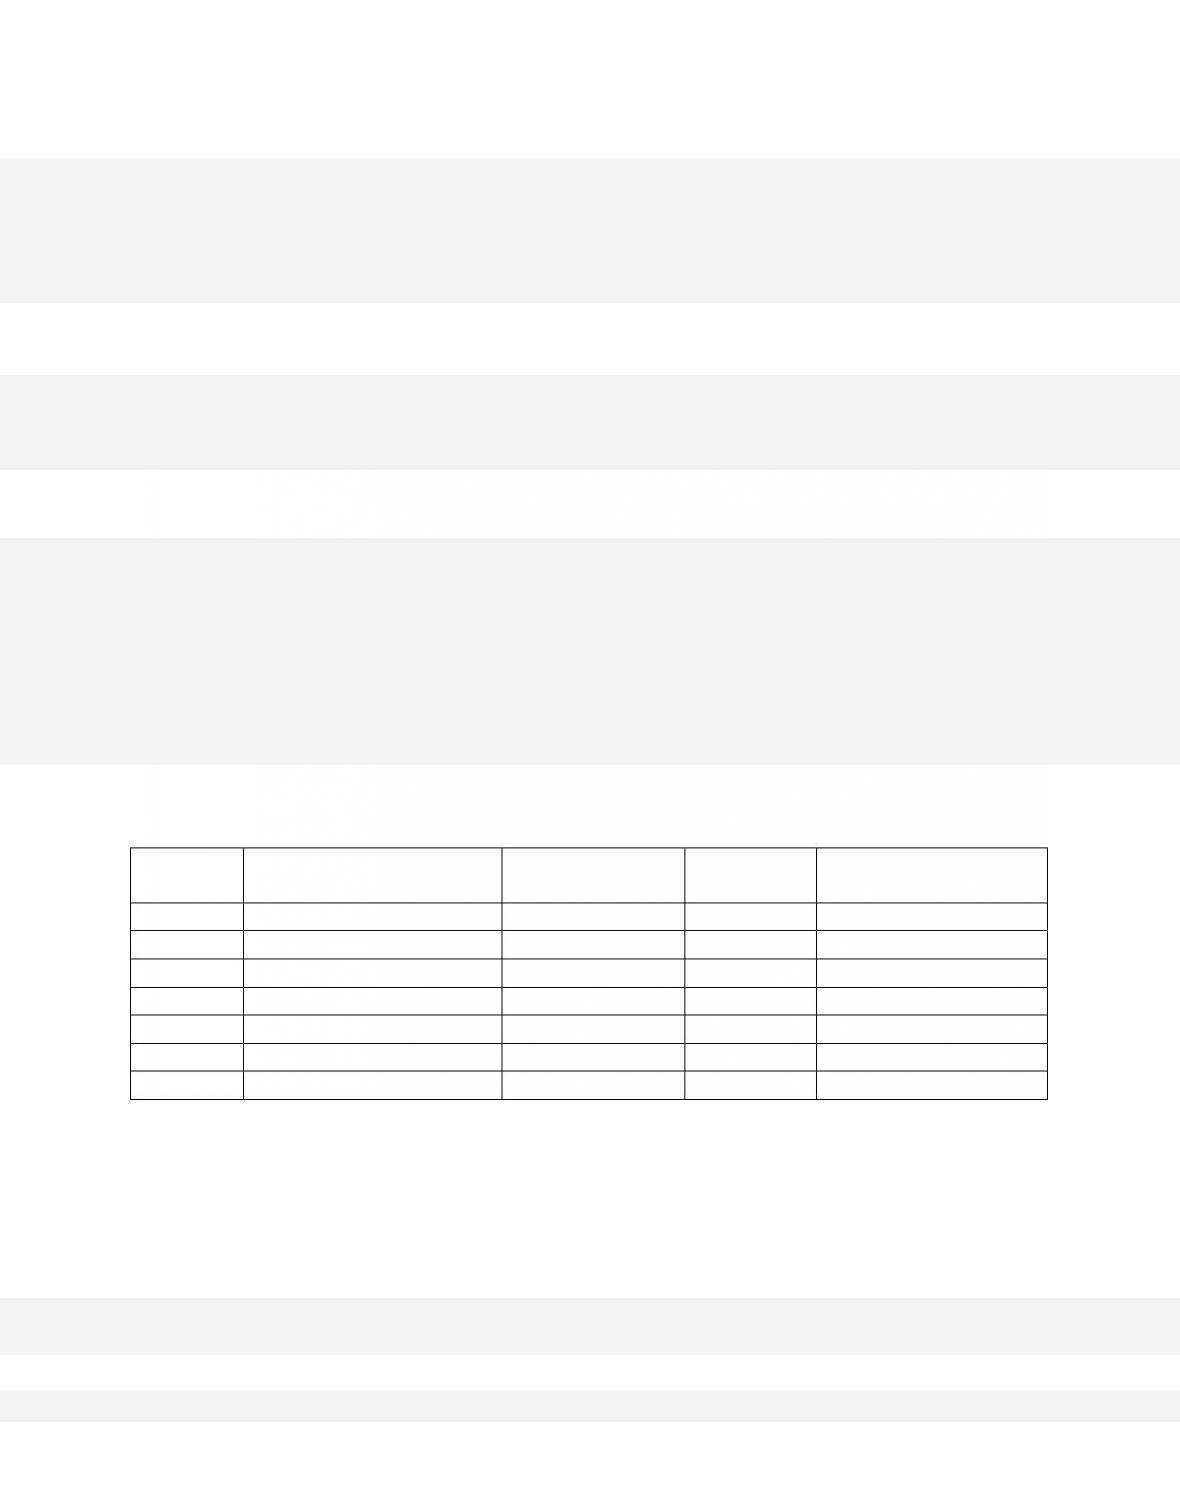
700
460
240
80
Refer to the accompanying information for a closed economy. The introduction of $80 billion
of government spending would
A.
lower the multiplier from 2.5 to 2.0.
31–87
Copyright © 2018 McGraw-Hill Education. All rights reserved. No reproduction or distribution without the prior
written consent of McGraw-Hill Education.
Blooms: Understand
Di ff i cu l ty :
02 Medium
Learning Objective: 31-07 Explain how economists integrate the public sector government
expenditures and taxes into the aggregate expenditures model.
Test Bank: I
To pi c:
Adding the Public Sector
Type: Table
157.
GDP
C
S
Ig
$100
$100
$0
$80
200
160
40
80
300
220
80
80
400
280
120
80
500
340
160
80
600
400
200
80
700
460
240
80
Refer to the accompanying information for a closed economy. If government spends $80
billion at each level of GDP, and imposes a lump-sum tax of $100
D. the equilibrium GDP cannot be determined.
158.
GDP
C
S
Ig
$100
$100
$0
$80
200
160
40
80

31–88
300
220
80
80
400
280
120
80
500
340
160
80
600
400
200
80
700
460
240
80
Refer to the accompanying information for a closed economy. The addition of a $100 billion
lump-sum tax
A.
reduces the MPC and increases the multiplier.
159.
In moving from a private closed to a mixed closed economy in the aggregate expenditures
model, taxes
A.
must be added to gross investment.
160.
Suppose government finds it can increase the equilibrium real GDP $45 billion by
increasing government purchases by $18 billion. On the basis of this information, we can say
that the
D. multiplier is 3.
161.
Before Taxes
After Taxes
GDP
C
S
Ca
Sa
$500
$480
$20
$474
$16
510
486
24
480
20
520
492
28
486
24
530
498
32
492
28
540
504
36
498
32
550
510
40
504
36
560
516
44
510
40
570
522
48
516
44
Refer to the accompanying table. The tax in the economy is a
A.
10 percent proportional tax.
31–90
Copyright © 2018 McGraw-Hill Education. All rights reserved. No reproduction or distribution without the prior
written consent of McGraw-Hill Education.
Learning Objective: 31-07 Explain how economists integrate the public sector government
expenditures and taxes into the aggregate expenditures model.
Test Bank: I
To pi c:
Adding the Public Sector
Type: Table
162.
Before Taxes
After Taxes
GDP
C
S
Ca
Sa
$500
$480
$20
$474
$16
510
486
24
480
20
520
492
28
486
24
530
498
32
492
28
540
504
36
498
32
550
510
40
504
36
560
516
44
510
40
570
522
48
516
44
Refer to the accompanying table. The MPC and MPS in the economy
A. are 0.4 and 0.6, respectively.
163.
Before Taxes
After Taxes
GDP
C
S
Ca
Sa
$500
$480
$20
$474
$16

510
486
24
480
20
520
492
28
486
24
530
498
32
492
28
540
504
36
498
32
550
510
40
504
36
560
516
44
510
40
570
522
48
516
44
Refer to the accompanying table. If an additional lump-sum tax of $20 were imposed, we
would expect
D. equilibrium GDP to rise by $24.
164. In a mixed open economy, changes in which of the following all affect the equilibrium
GDP in the same direction?
A.
Ca, Ig, Sa, and M

165. In the aggregate expenditures model, a reduction in taxes may
D. reduce consumption.
166. In the aggregate expenditures model, an increase in government spending may
A.
decrease real GDP.
167. If a $20 billion increase in government expenditures increases equilibrium GDP by $50
billion, then

31–93
Copyright © 2018 McGraw-Hill Education. All rights reserved. No reproduction or distribution without the prior
written consent of McGraw-Hill Education.
Di ff i cu l ty :
02 Medium
Learning Objective: 31-07 Explain how economists integrate the public sector government
expenditures and taxes into the aggregate expenditures model.
Test Bank: I
To pi c:
Adding the Public Sector
168. If a $10 billion decrease in lump-sum taxes increases equilibrium GDP by $40 billion,
then
A.
the multiplier is 4.
169. A lump-sum tax means that
A.
the tax only applies to one time period.
170. In an aggregate expenditures diagram, a lump-sum tax (T) will
A.
not affect the C + Ig + Xn line.

31–94
Copyright © 2018 McGraw-Hill Education. All rights reserved. No reproduction or distribution without the prior
written consent of McGraw-Hill Education.
D. shift the C + Ig + Xn line downward by an amount equal to T × MPC.
171. The effect of imposing a lump-sum tax is to
A.
reduce the absolute levels of consumption and saving at each level of GDP and to reduce the
size of the multiplier.
172. Suppose that unintended increases in inventories are occurring in a mixed closed
economy. We can surmise that
A.
Ig + T > Sa + G.

31–95
Copyright © 2018 McGraw-Hill Education. All rights reserved. No reproduction or distribution without the prior
written consent of McGraw-Hill Education.
expenditures and taxes into the aggregate expenditures model.
Test Bank: I
To pi c:
Adding the Public Sector
173. If a lump-sum tax of $40 billion is imposed and the MPC is 0.6, the saving schedule will
shift
A.
downward by $24 billion.
174. If the MPC in an economy is 0.75, a $1 billion increase in taxes will ultimately reduce
consumption by
A.
$1 billion.
175. If the MPC in an economy is 0.9, a $1 billion increase in government spending will
ultimately increase consumption by
A.
$1 billion.

31–96
Copyright © 2018 McGraw-Hill Education. All rights reserved. No reproduction or distribution without the prior
written consent of McGraw-Hill Education.
D. $9 billion.
176. If the marginal propensity to save in a closed economy is 0.25 and a lump-sum tax is
imposed, the slope of the economy’s aggregate expenditures schedule will be
A. 0.25.
177. If the marginal propensity to consume in an economy is 0.8, net exports are zero, and
government spending is $33 billion at each level of real GDP, the slope of the economy’s
aggregate expenditures schedule will be
D. 0.125.

31–97
Copyright © 2018 McGraw-Hill Education. All rights reserved. No reproduction or distribution without the prior
written consent of McGraw-Hill Education.
To pi c:
Adding the Public Sector
178. If MPC = 0.5, a simultaneous increase in both taxes and government spending of $20 will
A.
decrease GDP by $20.
179. If government increases its purchases by $15 billion and the MPC is 2/3, then we would
expect the equilibrium GDP to
A.
increase by $30 billion.
180. If government increases its tax revenues by $15 billion and the MPC is 2/3, then we can
expect the equilibrium GDP to
D. decrease by $55 billion.

31–98
Copyright © 2018 McGraw-Hill Education. All rights reserved. No reproduction or distribution without the prior
written consent of McGraw-Hill Education.
Accessibility:
Keyboard Navigation
Blooms: Understand
Di ff i cu l ty :
02 Medium
Learning Objective: 31-07 Explain how economists integrate the public sector government
expenditures and taxes into the aggregate expenditures model.
Test Bank: I
To pi c:
Adding the Public Sector
181. The multiplier effect demonstrates that
A.
equal increases in government spending and taxes do not change the equilibrium GDP.
182. In an aggregate expenditures diagram, equal increases in government spending and in
lump-sum taxes will
A.
shift the aggregate expenditures line downward.
183. Equal increases in government purchases and taxes will
A.
increase the equilibrium GDP, and the size of that increase varies directly with the size of

the MPC.
184. Assume in a closed economy that the equilibrium level of income is $380 and the MPS is
0.25. Now suppose government collects taxes of $50 and spends the entire amount. As a result,
A.
the equilibrium level of real income and the price level will both remain unchanged.
185. An inflationary expenditure gap is the amount by which
A.
equilibrium GDP falls short of the full-employment GDP.
31-100
Copyright © 2018 McGraw-Hill Education. All rights reserved. No reproduction or distribution without the prior
written consent of McGraw-Hill Education.
Difficul ty:
03 Hard
Learning Objective: 31-08 Differentiate between equilibrium GDP and full-employment GDP
and identify and describe the nature and causes of recessionary expenditure gaps and
inflationary expenditure gaps.
Test Bank: I
To pi c:
Equilibrium versus Full-Employment GDP
186. A recessionary expenditure gap is
D. the amount by which aggregate expenditures exceed the full-employment level of GDP.
187.
Real
GDP
Consumption (after
taxes)
Gross
Investment
Net
Exports
Government
Purchases
$0
-$20
$10
$+5
$15
10
0
10
+5
15
40
20
10
+5
15
70
40
10
+5
15
100
60
10
+5
15
130
80
10
+5
15
160
100
10
+5
15
Refer to the table. The economy shown is a
A.
private economy.