
Chapter 31 The Aggregate Expenditures Model Answer Key
Multiple Choice Questions
1. John Maynard Keynes created the aggregate expenditures model based primarily on what
historical event?
A. bank panic of 1907
2. The aggregate expenditures model is built upon which of the following assumptions?
D. Government spending policy has no ability to affect the level of output.
3. A private closed economy includes
A.
households, businesses, and government, but not international trade.
31-2
Copyright © 2018 McGraw-Hill Education. All rights reserved. No reproduction or distribution without the prior
written consent of McGraw-Hill Education.
D. households only.
AACSB: Knowledge Application
Accessibility:
Keyboard Navigation
Blooms: Understand
Di ff i cu l ty :
02 Medium
Learning Objective: 31-01 Explain how sticky prices relate to the aggregate expenditures
model.
Test Bank: I
To pi c:
Assumptions and Simplifications
4. In the United States from 1929 to 1933, real GDP and the unemployment rate _.
D. declined by 40 percent; rose to 50 percent
5. In the aggregate expenditures model, it is assumed that investment
A.
automatically changes in response to changes in real GDP.
6. All else equal, a large decline in the real interest rate will shift the
A.
investment demand curve leftward.
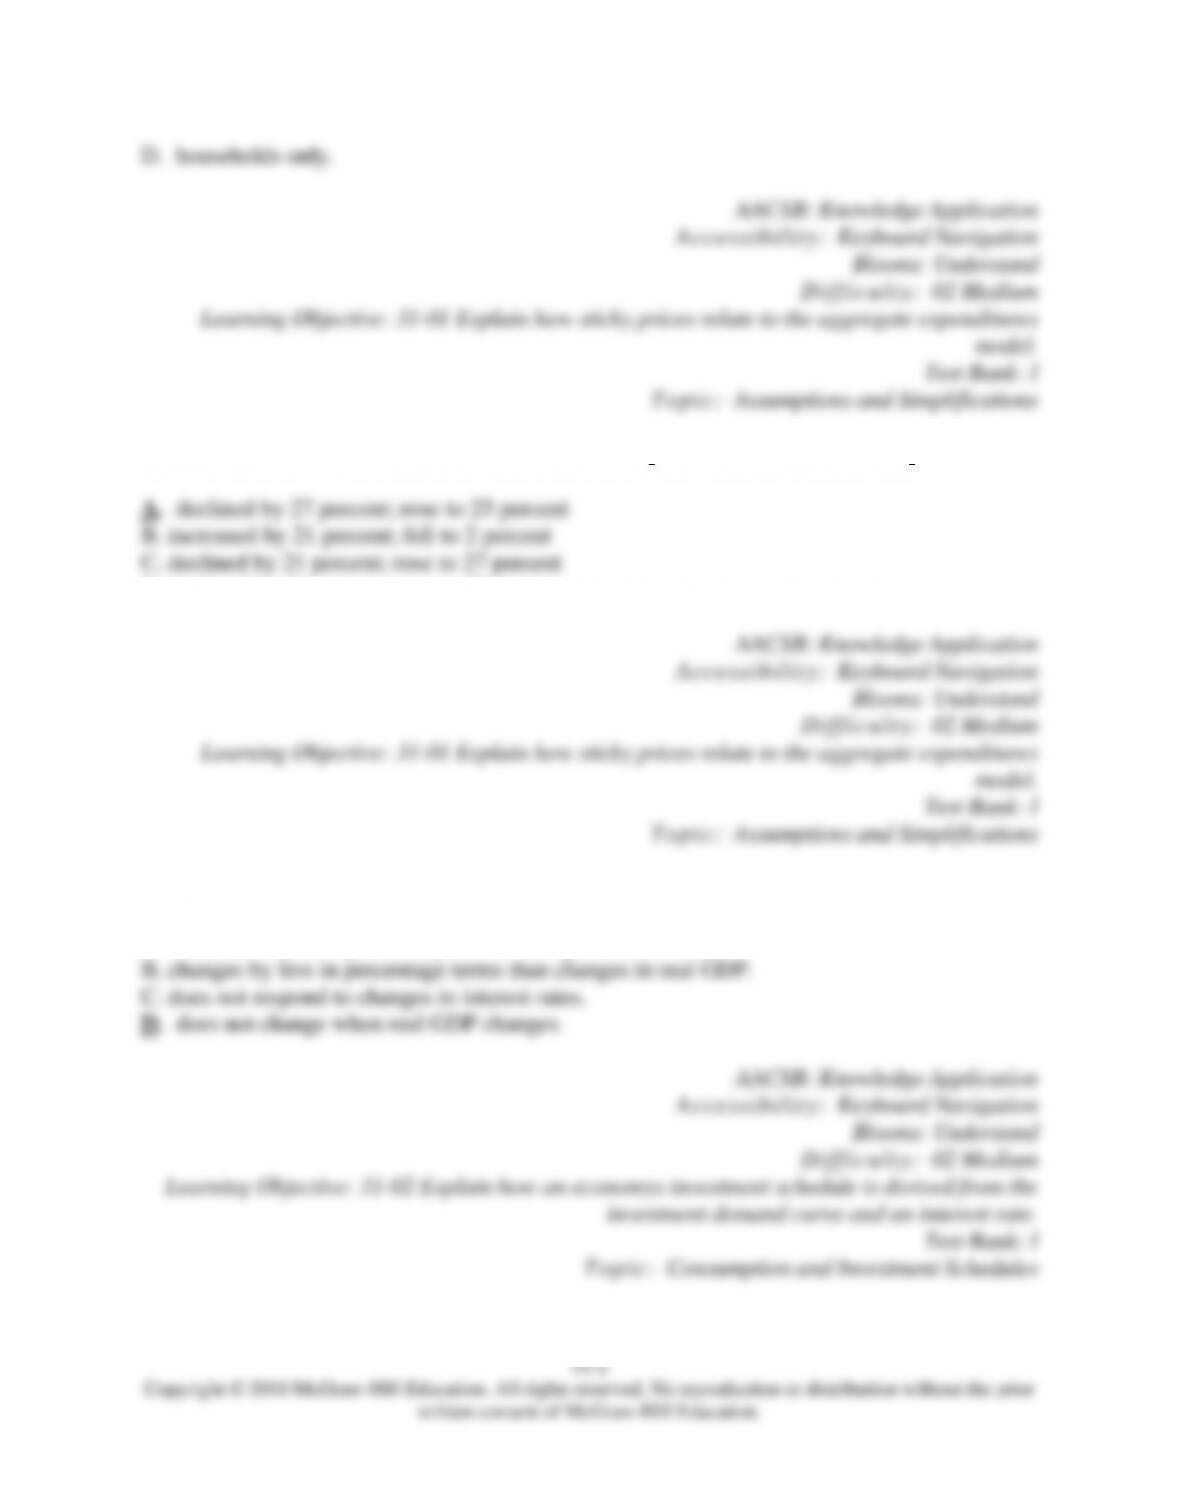
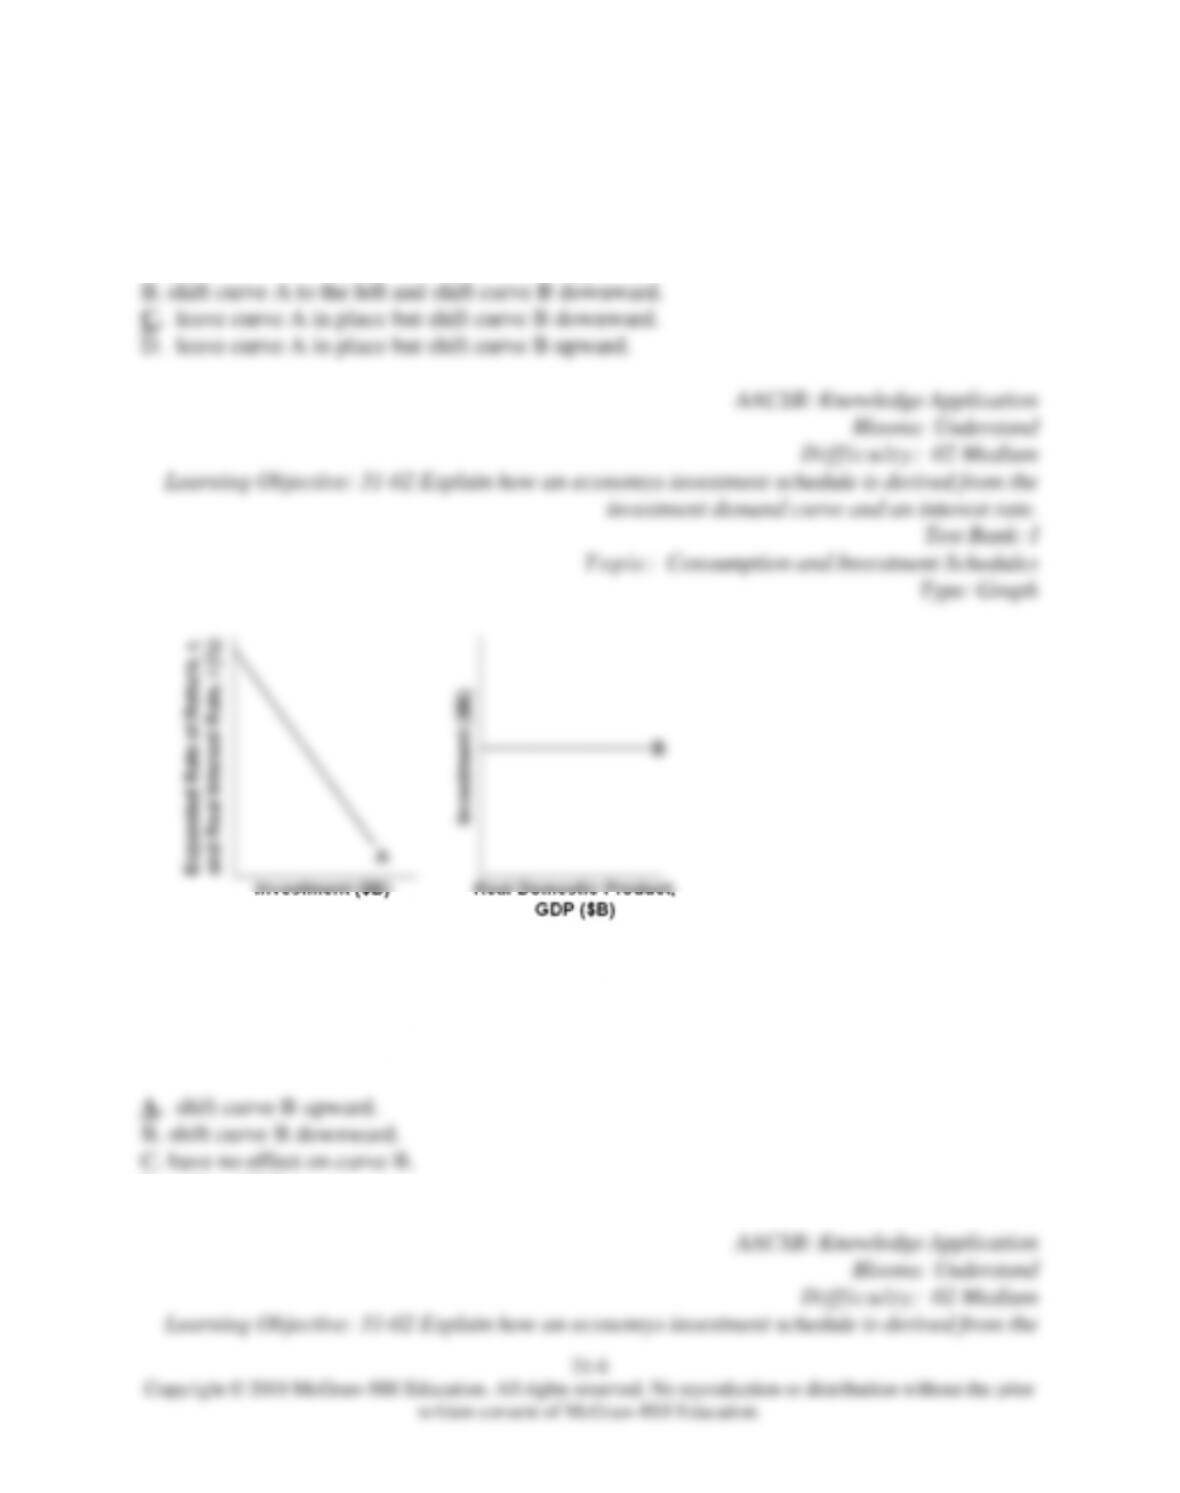
Refer to the diagrams. Curve A
A.
is an investment schedule, and curve B is a consumption of fixed capital schedule.
31-4
Copyright © 2018 McGraw-Hill Education. All rights reserved. No reproduction or distribution without the prior
written consent of McGraw-Hill Education.
Learning Objective: 31-02 Explain how an economys investment schedule is derived from the
investment demand curve and an interest rate.
Test Bank: I
To pi c:
Consumption and Investment Schedules
Type: Graph
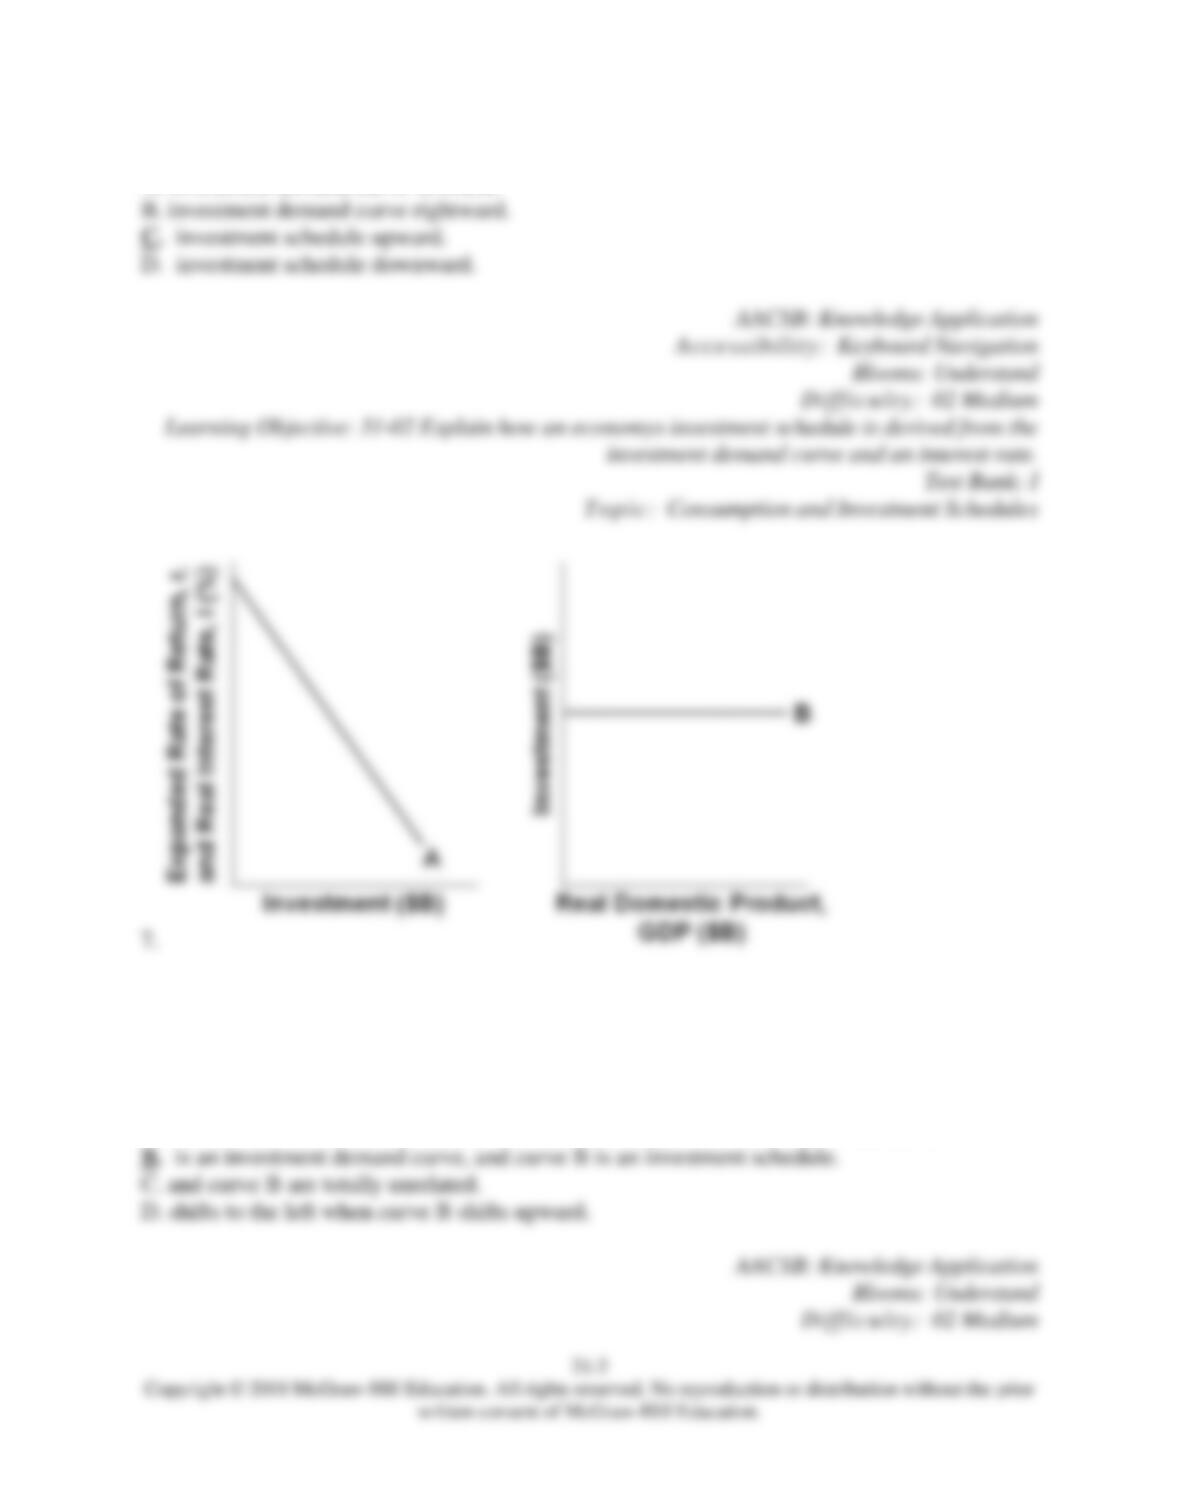
8.
Refer to the diagrams. Other things equal, curve B will shift upward when
A.
the level of GDP increases.
31-5
9.
Refer to the diagrams. Other things equal, an interest rate decrease will
A.
shift curve A to the right and shift curve B upward.
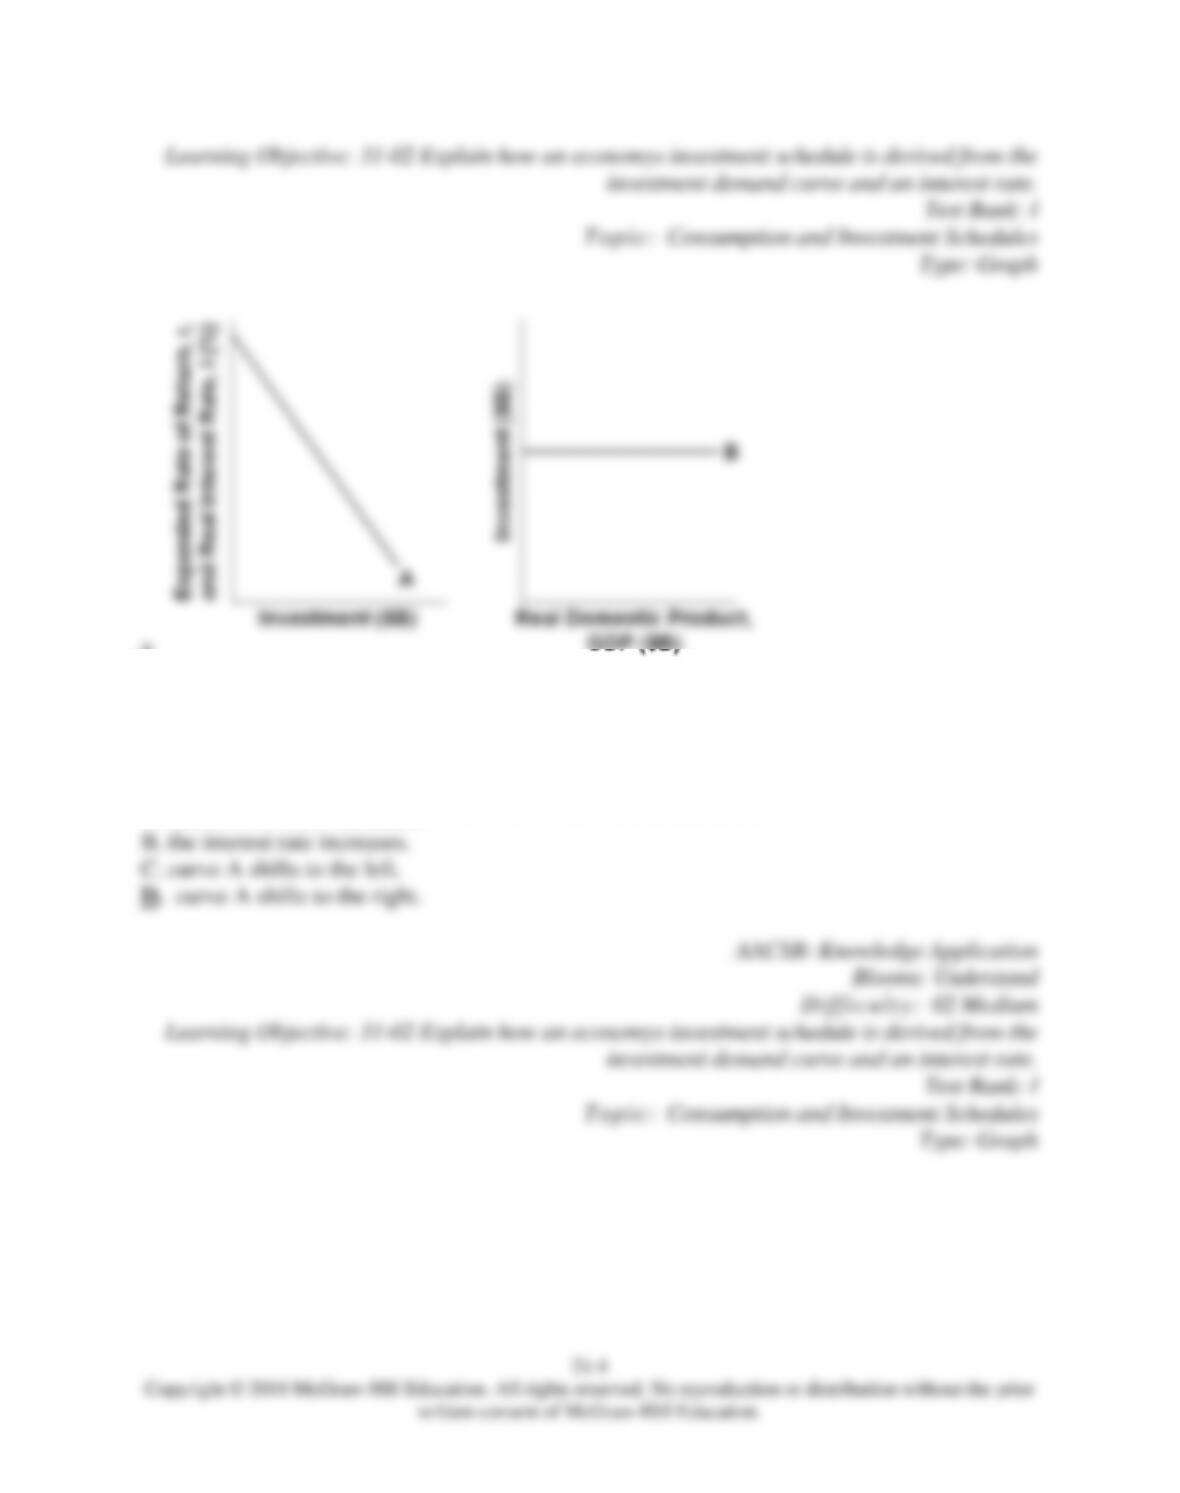
10.
Refer to the diagrams. Other things equal, an interest rate increase will
A.
shift curve A to the right and shift curve B upward.
11.
Refer to the diagrams. Other things equal, an interest rate reduction coupled with a rightward
shift in curve A will
D. reduce GDP.
31-7
Copyright © 2018 McGraw-Hill Education. All rights reserved. No reproduction or distribution without the prior
written consent of McGraw-Hill Education.
investment demand curve and an interest rate.
Test Bank: I
To pi c:
Consumption and Investment Schedules
Type: Graph
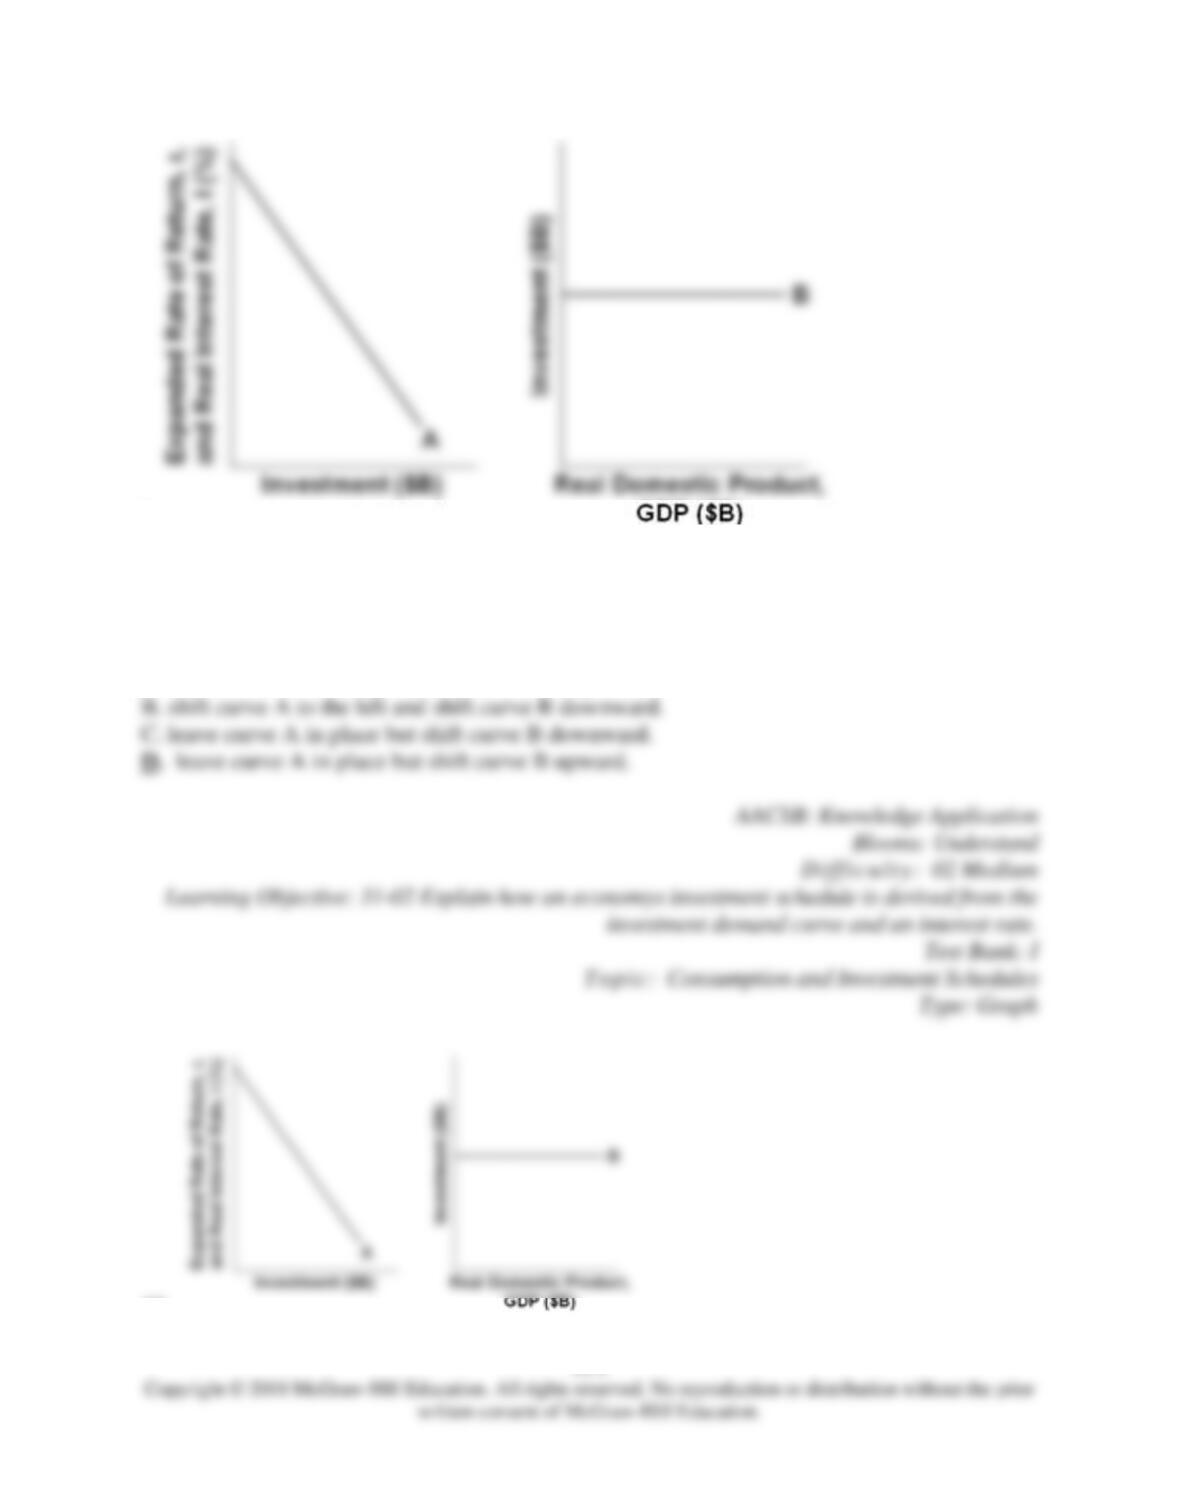
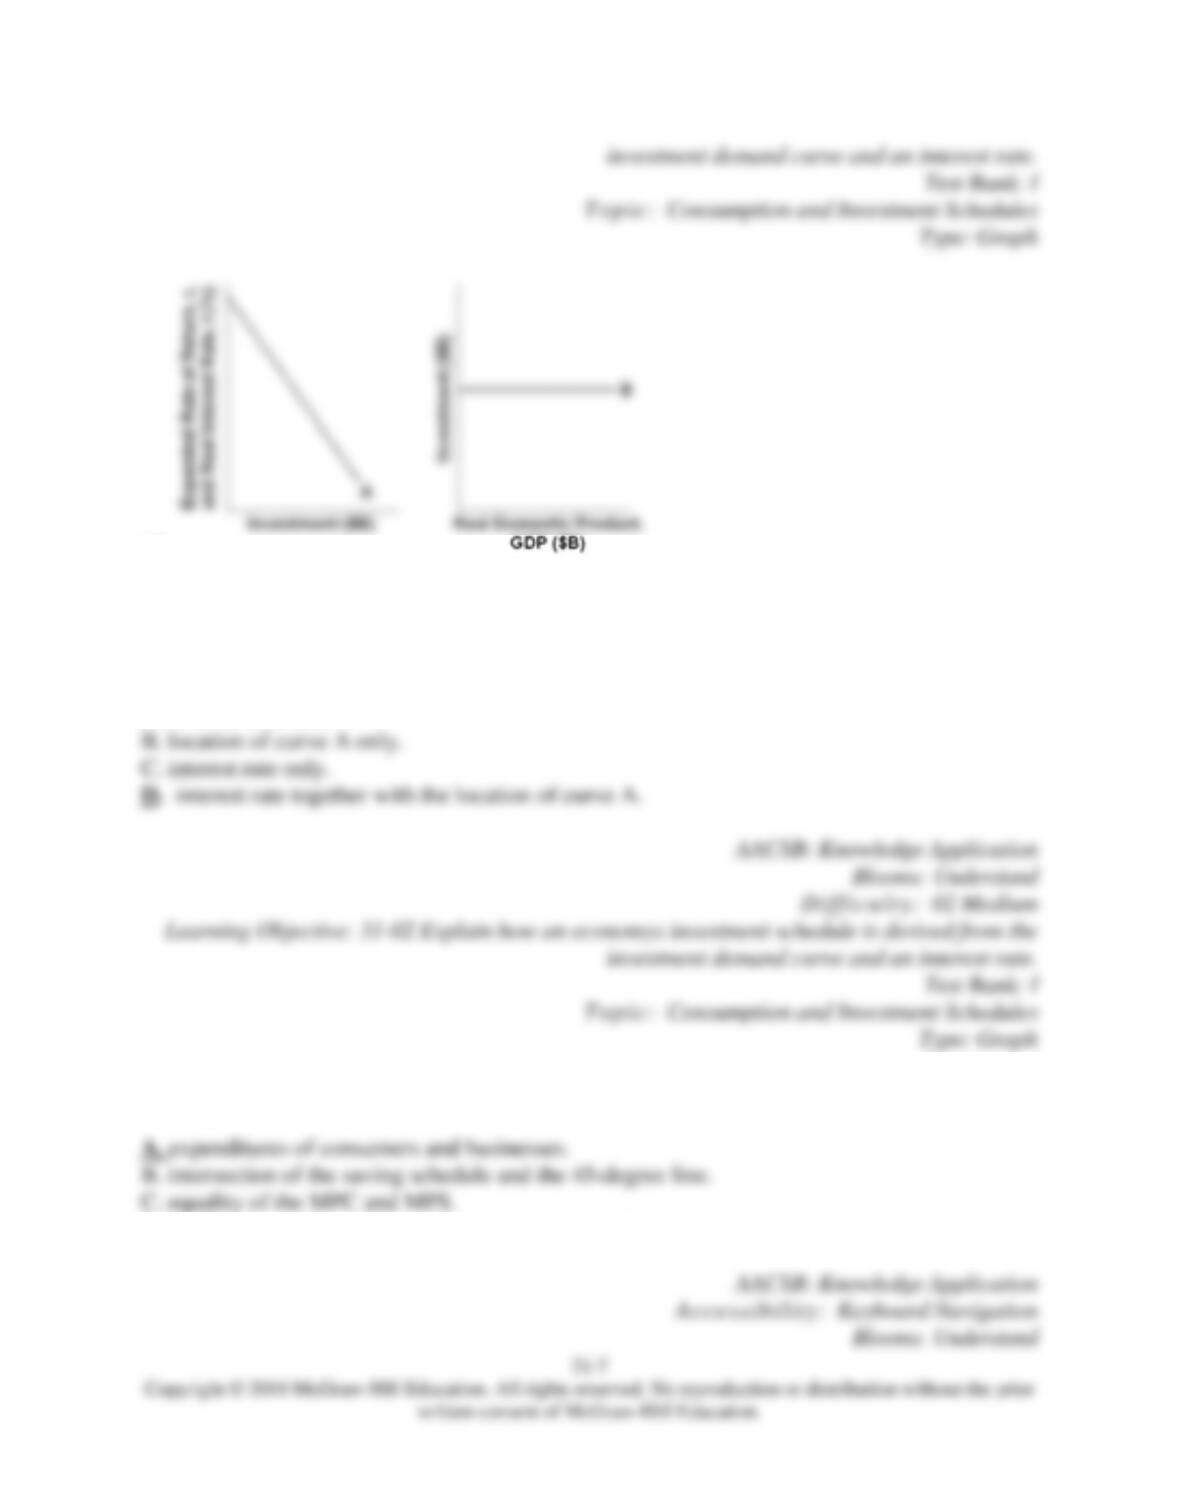
12.
Refer to the diagrams. The location of curve B depends on the
A.
level of real GDP.
13.
The level of aggregate expenditures in the private closed economy is determined by the
D. intersection of the saving and consumption schedules.

31-8
Copyright © 2018 McGraw-Hill Education. All rights reserved. No reproduction or distribution without the prior
written consent of McGraw-Hill Education.
Di ff i cu l ty :
02 Medium
Learning Objective: 31-03 Illustrate how economists combine consumption and investment to
depict an aggregate expenditures schedule for a private closed economy and how that schedule
can be used to demonstrate the economys equilibrium level of output where the total quantity of
goods produced equals the total quantity of goods purchased.
Test Bank: I
To pi c:
Equilibrium GDP: C Ig = GDP
14.
Possible Levels of Domestic Output and Income (GDP = DI)
Consumption
$320
$320
330
327
340
334
350
341
360
348
370
355
380
362
The table gives data for a private closed economy. The MPS is
A. 7/10.
15.
Possible Levels of Domestic Output and Income (GDP = DI)
Consumption
$320
$320

330
327
340
334
350
341
360
348
370
355
380
362
The table gives data for a private closed economy. At the $370 billion level of DI, the APS is
approximately
D. 16 percent.
16.
Possible Levels of Domestic Output and Income (GDP = DI)
Consumption
$320
$320
330
327
340
334
350
341
360
348
370
355
380
362
The table gives data for a private closed economy. If gross investment is $12 billion, the
equilibrium level of GDP will be
A. $380.
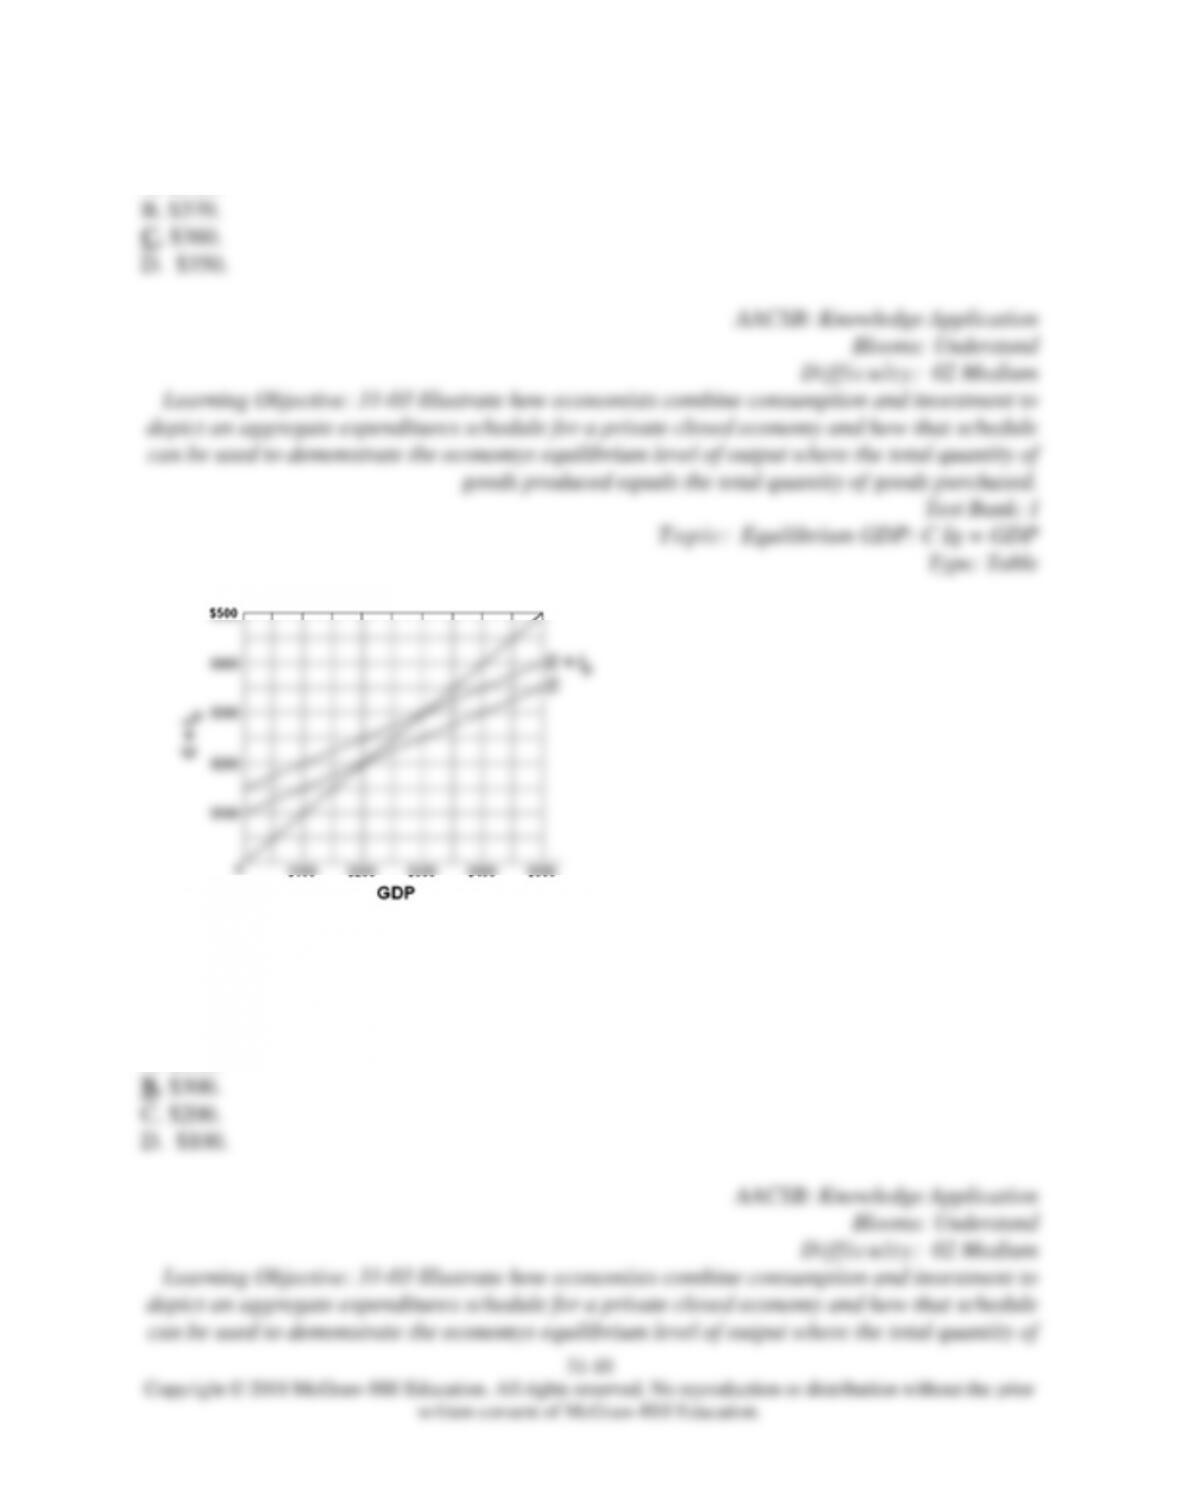
17.
Refer to the diagram for a private closed economy. The equilibrium level of GDP is
A. $400.
31–11
Copyright © 2018 McGraw-Hill Education. All rights reserved. No reproduction or distribution without the prior
written consent of McGraw-Hill Education.
goods produced equals the total quantity of goods purchased.
Test Bank: I
To pi c:
Equilibrium GDP: C Ig = GDP
Type: Graph
18.
Refer to the diagram for a private closed economy. At the equilibrium level of GDP,
investment and saving are both
D. $40.
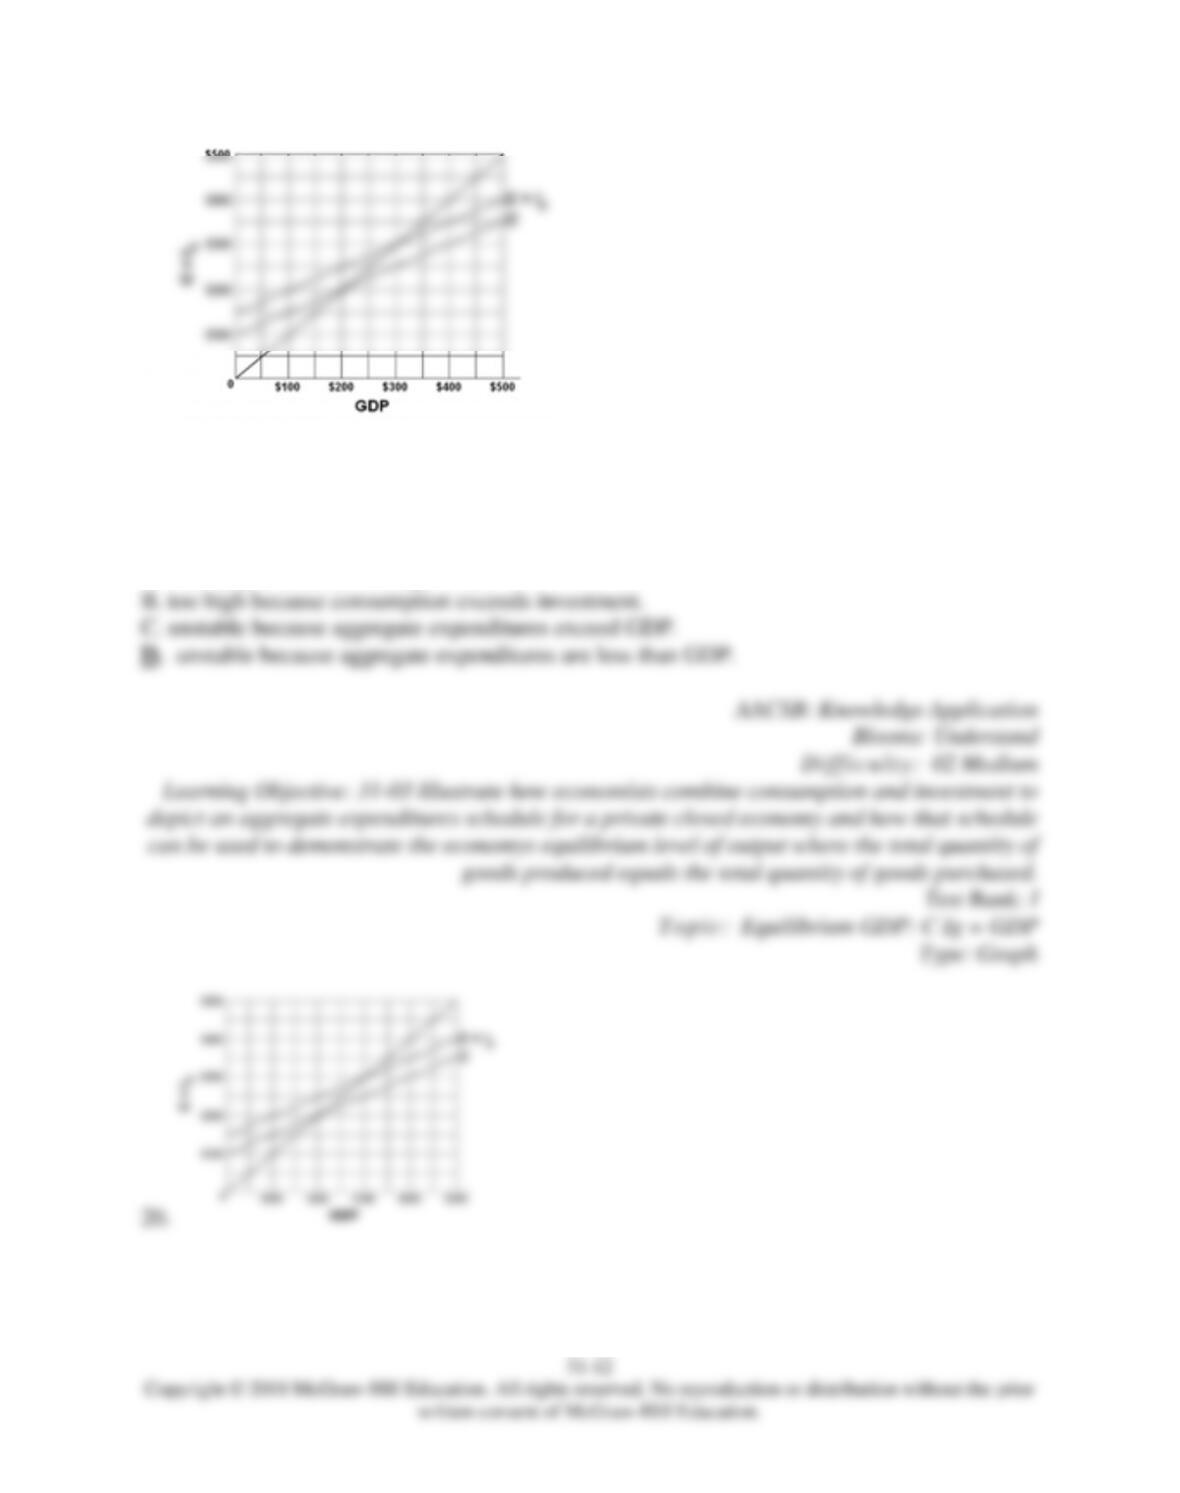
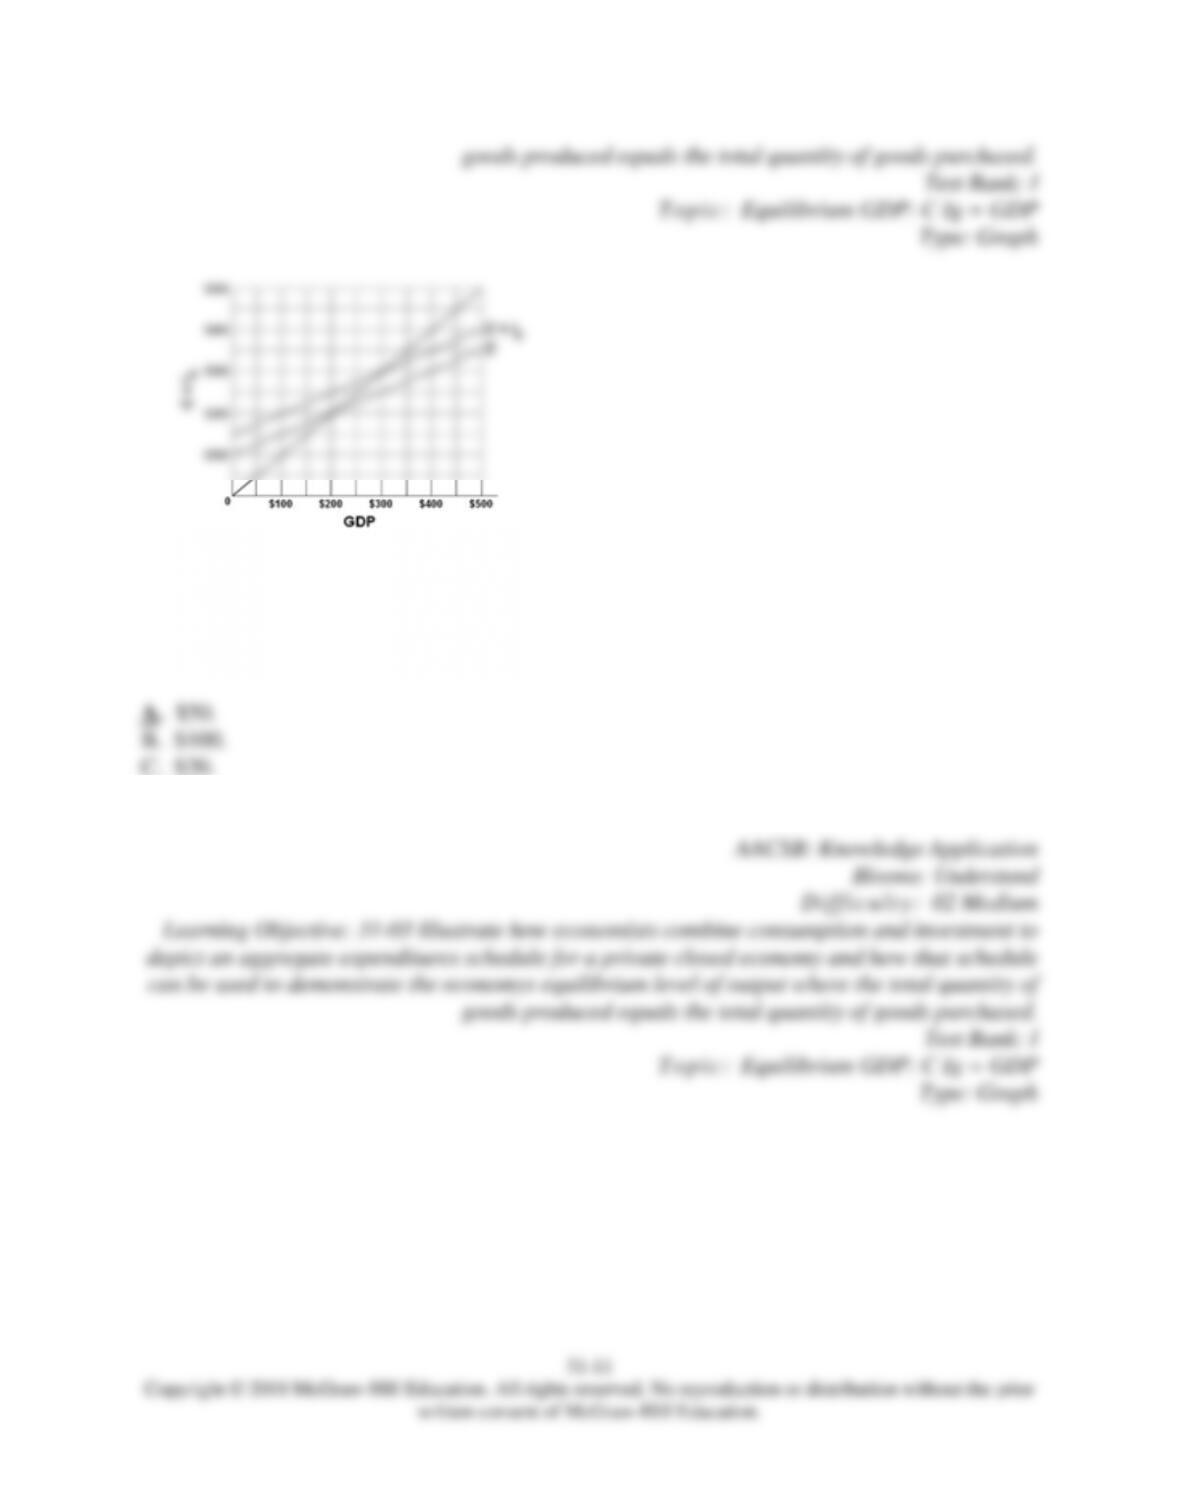
19.
Refer to the diagram for a private closed economy. The $400 level of GDP is
A.
that output at which saving is zero.
Refer to the diagram for a private closed economy. Unplanned changes in inventories will be
zero
D. only at the $400 level of GDP.
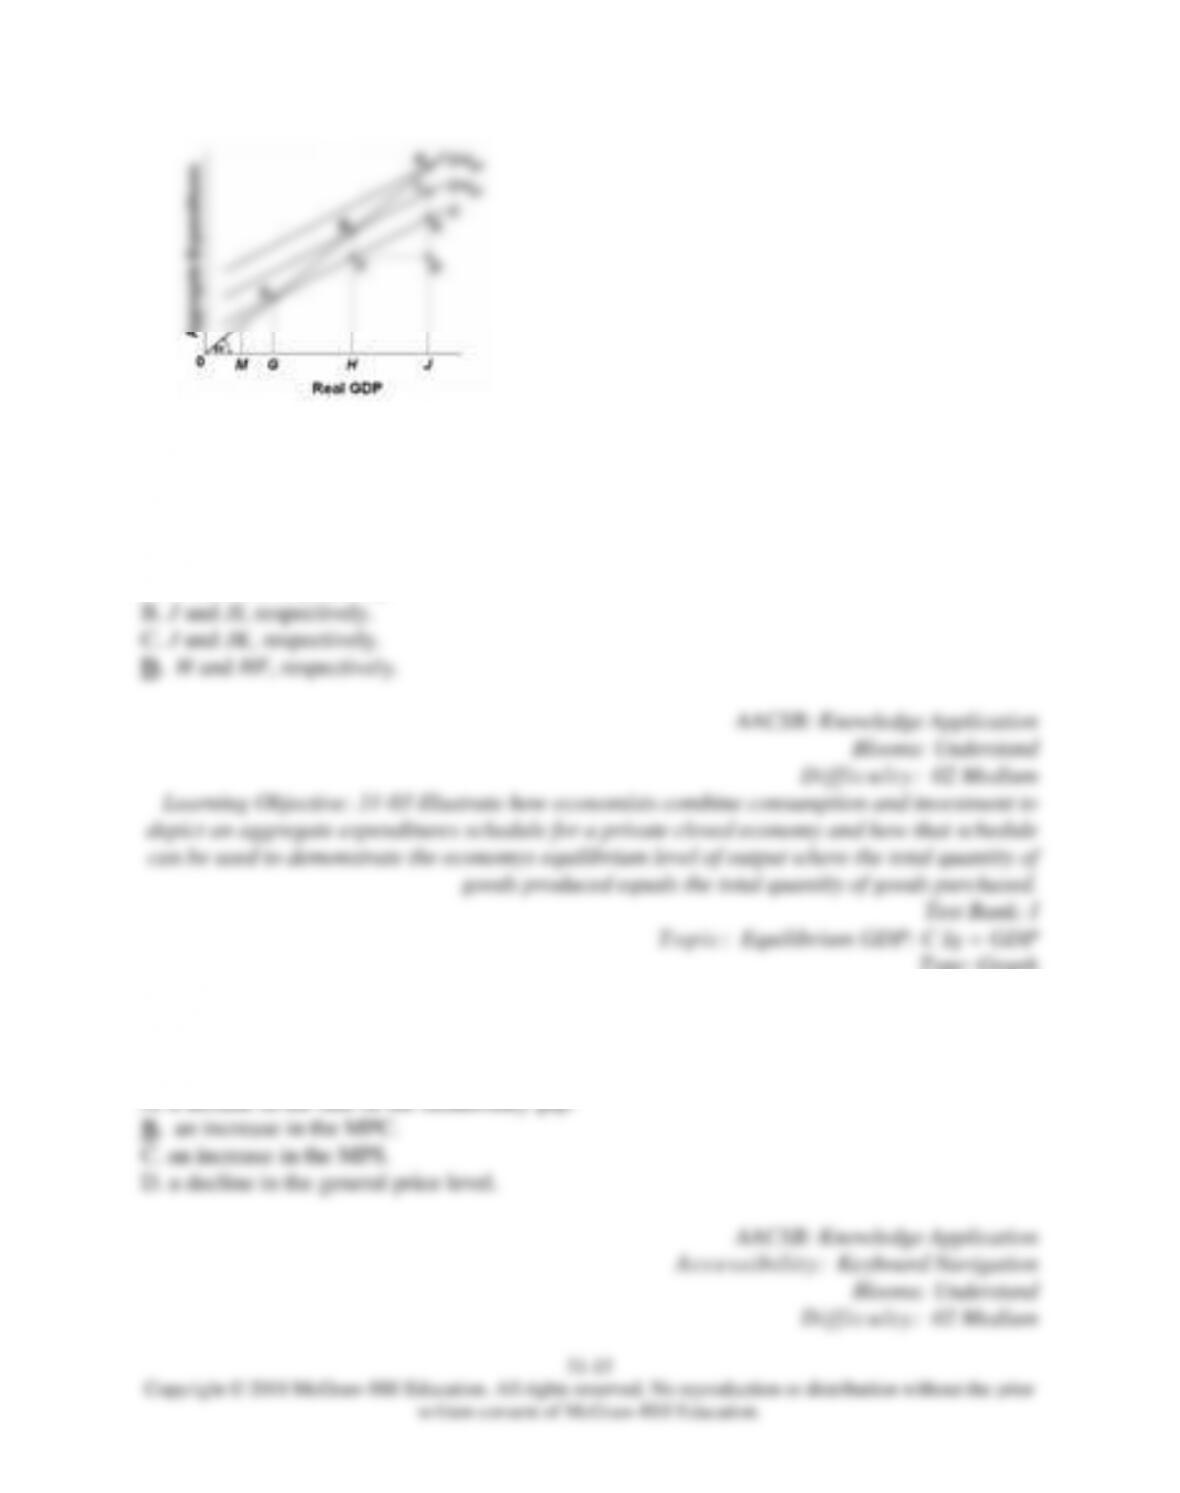
21.
Refer to the diagram, which applies to a private closed economy. The APC is equal to 1 at
income level
A.
J.
31–14
Copyright © 2018 McGraw-Hill Education. All rights reserved. No reproduction or distribution without the prior
written consent of McGraw-Hill Education.
depict an aggregate expenditures schedule for a private closed economy and how that schedule
can be used to demonstrate the economys equilibrium level of output where the total quantity of
goods produced equals the total quantity of goods purchased.
Test Bank: I
To pi c:
Equilibrium GDP: C Ig = GDP
Type: Graph
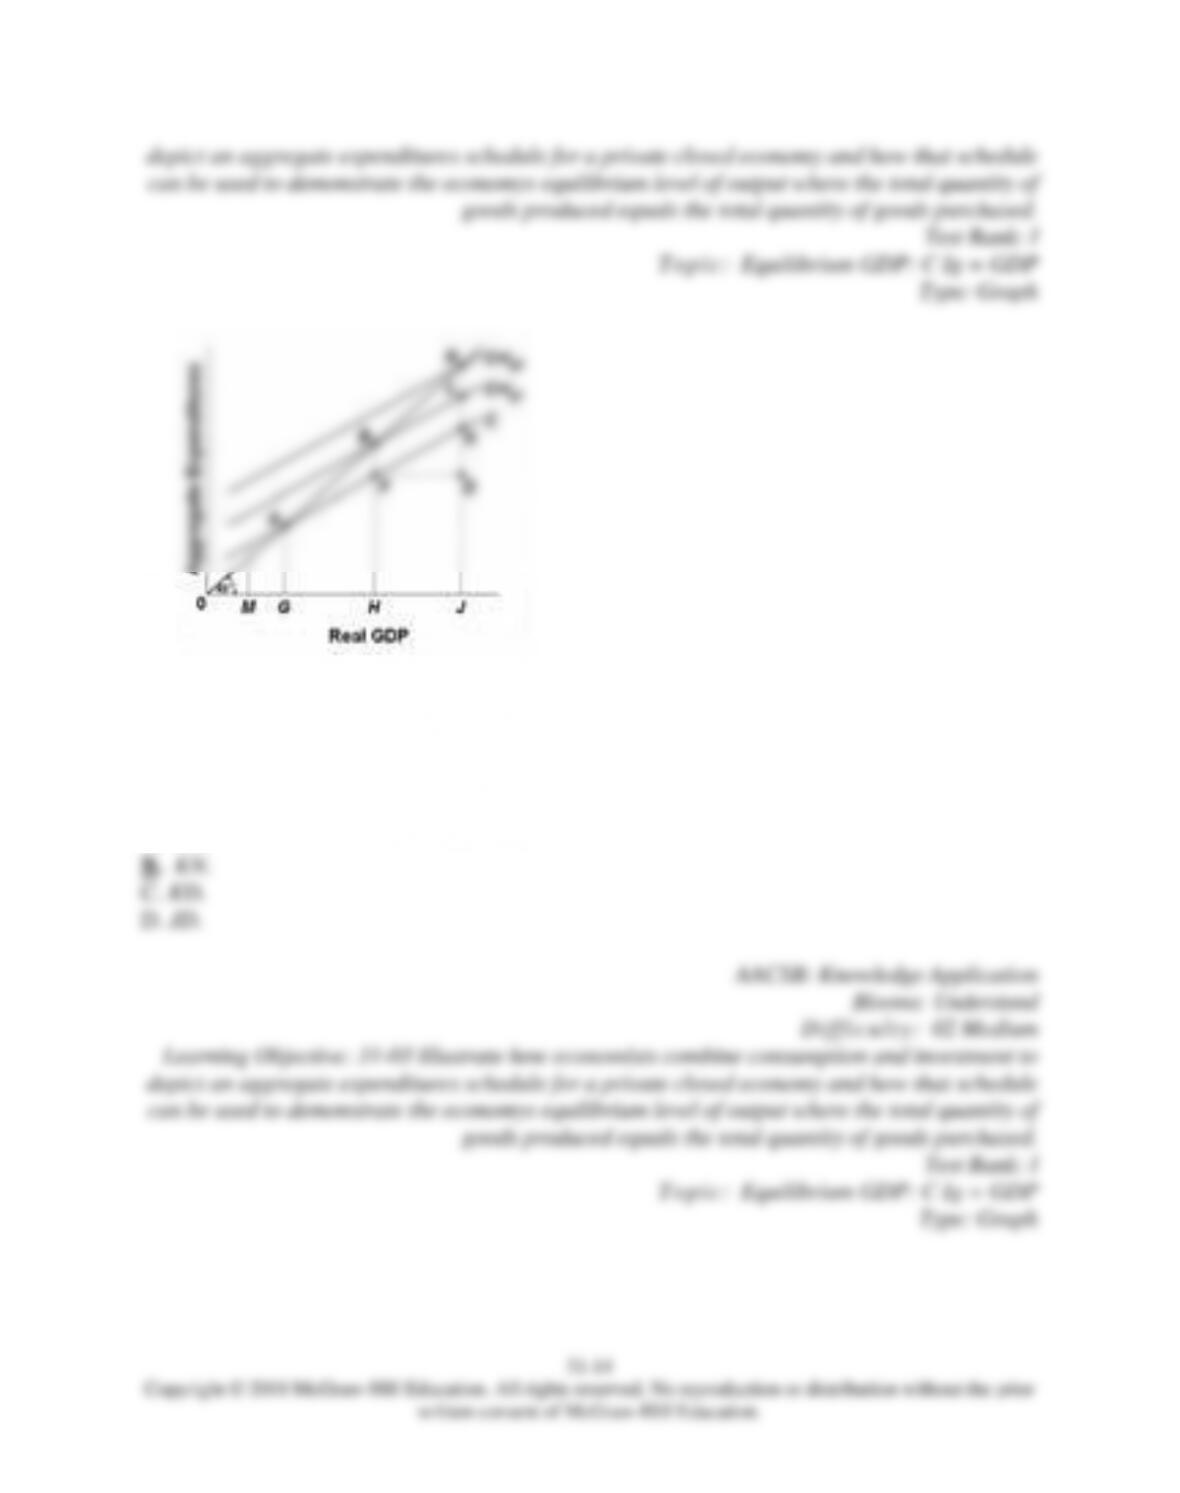
22.
Refer to the diagram, which applies to a private closed economy. If aggregate expenditures are
C + Ig2, the amount of saving at income level J is
A. LK.
23.
Refer to the diagram, which applies to a private closed economy. If gross investment is Ig1, the
equilibrium GDP and the level of consumption will be
A.
H and HB, respectively.
Type: Graph
24. Other things equal, the slope of the aggregate expenditures schedule will increase as a
result of
A.
a decline in the size of the inflationary gap.
31–16
Copyright © 2018 McGraw-Hill Education. All rights reserved. No reproduction or distribution without the prior
written consent of McGraw-Hill Education.
Learning Objective: 31-03 Illustrate how economists combine consumption and investment to
depict an aggregate expenditures schedule for a private closed economy and how that schedule
can be used to demonstrate the economys equilibrium level of output where the total quantity of
goods produced equals the total quantity of goods purchased.
Test Bank: I
To pi c:
Equilibrium GDP: C Ig = GDP
25. In a private closed economy, when aggregate expenditures equal GDP,
A.
consumption equals investment.
26. In a private closed economy, when aggregate expenditures exceed GDP,
A.
GDP will decline.
27. If an unintended increase in business inventories occurs at some level of GDP, then GDP
A.
entails a rate of aggregate expenditures in excess of the rate of aggregate production.
31–17
Copyright © 2018 McGraw-Hill Education. All rights reserved. No reproduction or distribution without the prior
written consent of McGraw-Hill Education.
B.
may be either above or below the equilibrium output.
C.
is too low for equilibrium.
D. is too high for equilibrium.
AACSB: Knowledge Application
Accessibility:
Keyboard Navigation
Blooms: Understand
Di ff i cu l ty :
02 Medium
Learning Objective: 31-04 Discuss the two other ways to characterize the equilibrium level of
real GDP in a private closed economy: saving = investment, and no unplanned changes in
inventories.
Test Bank: I
To pi c:
Other Features of Equilibrium GDP
28. The equilibrium level of GDP is associated with
A.
an excess of planned investment over saving.
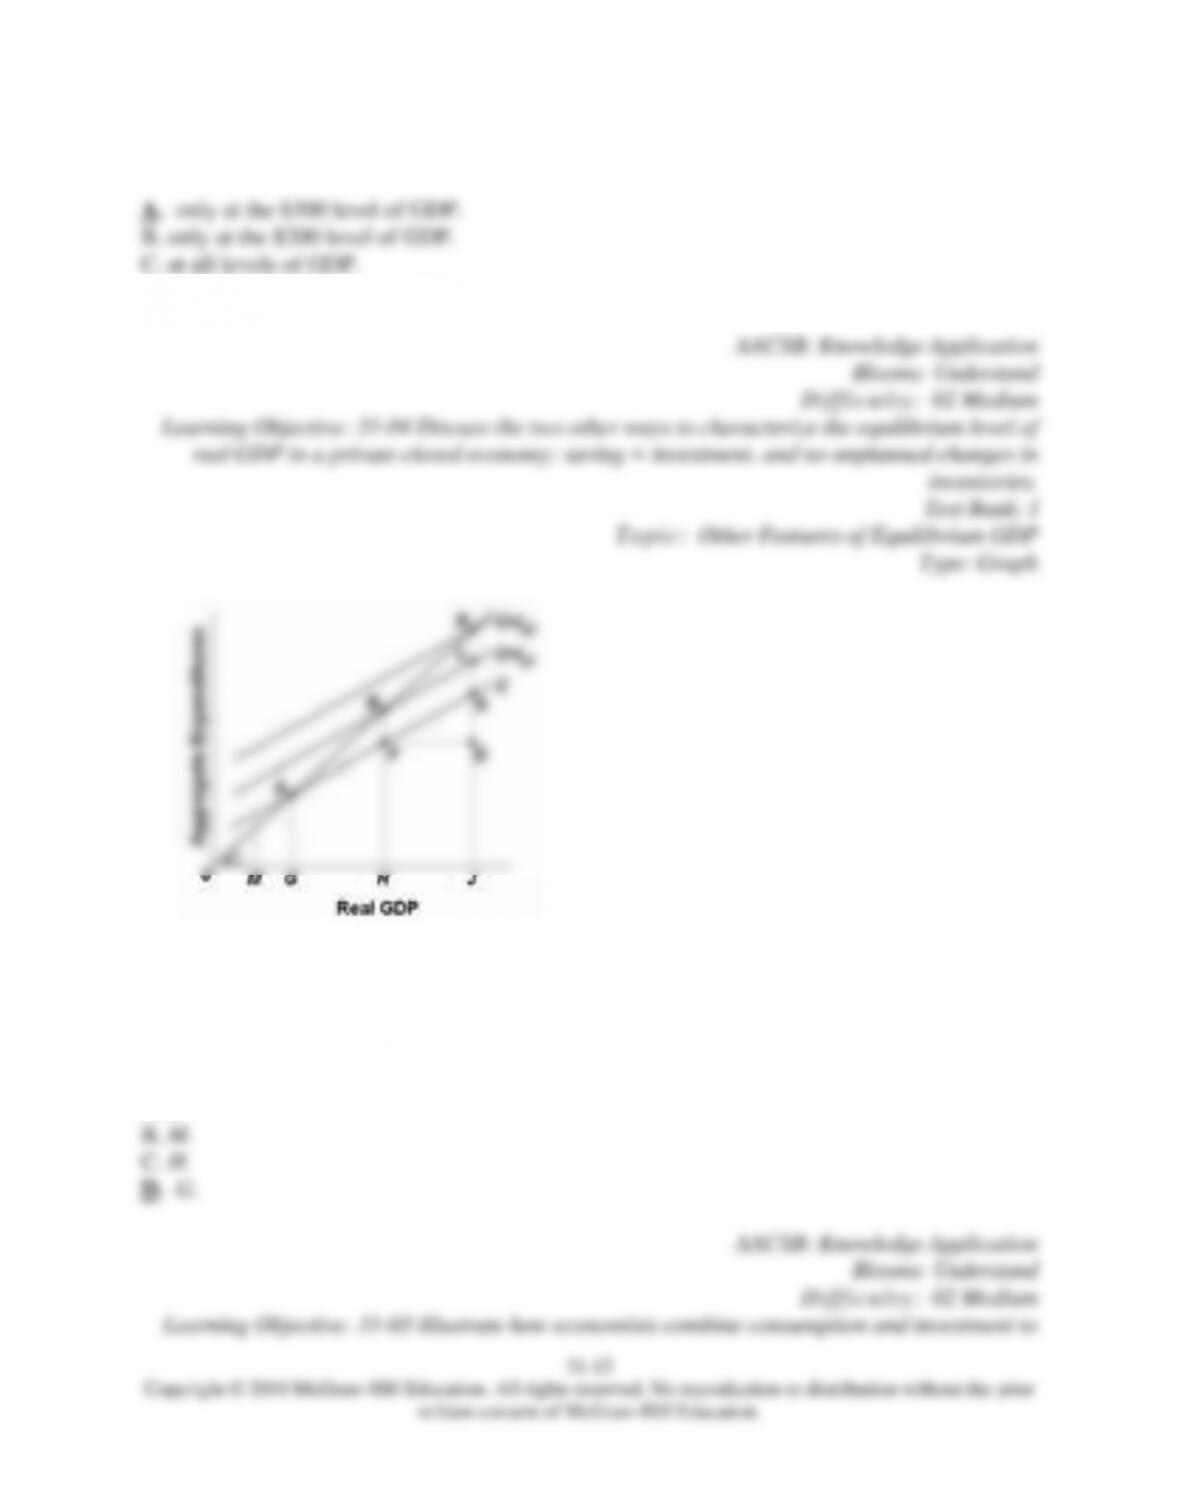
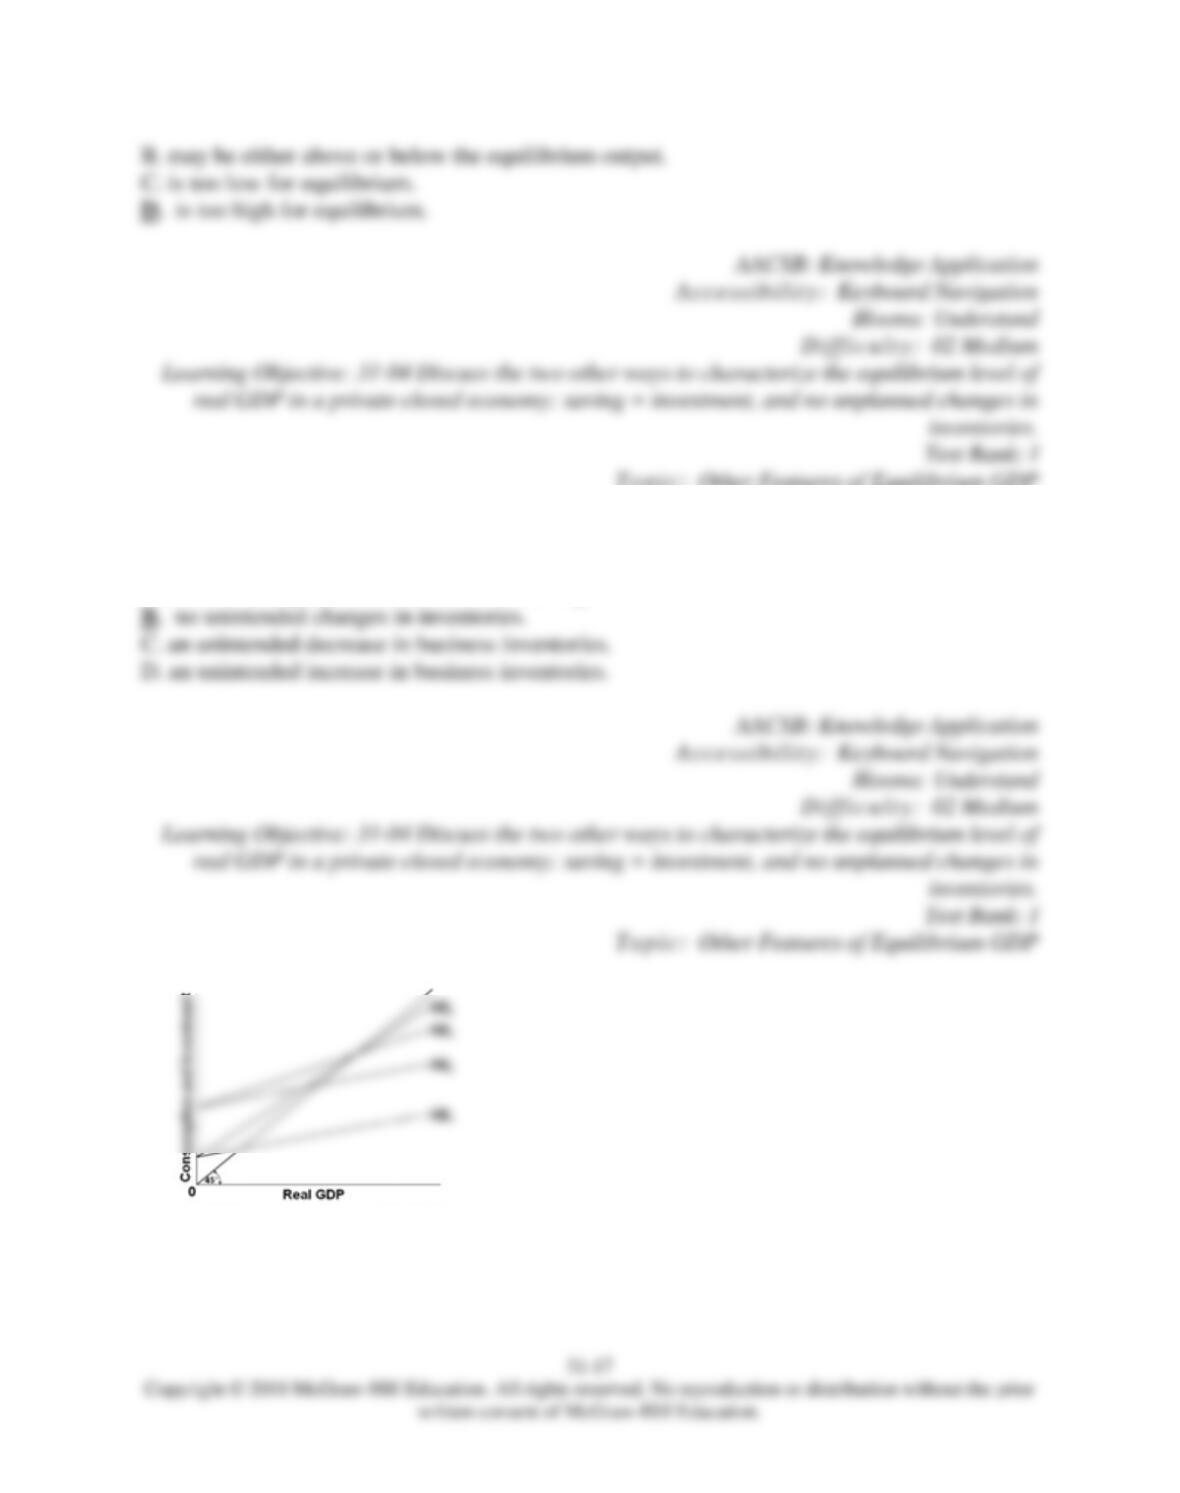
29.
Which aggregate expenditure schedule AE in the diagram for a private closed economy implies
the largest MPC, assuming investment is the same at each level of income?
31–18
Copyright © 2018 McGraw-Hill Education. All rights reserved. No reproduction or distribution without the prior
written consent of McGraw-Hill Education.
A.
AE4
B.
AE3
C.
AE2
D.
AE1
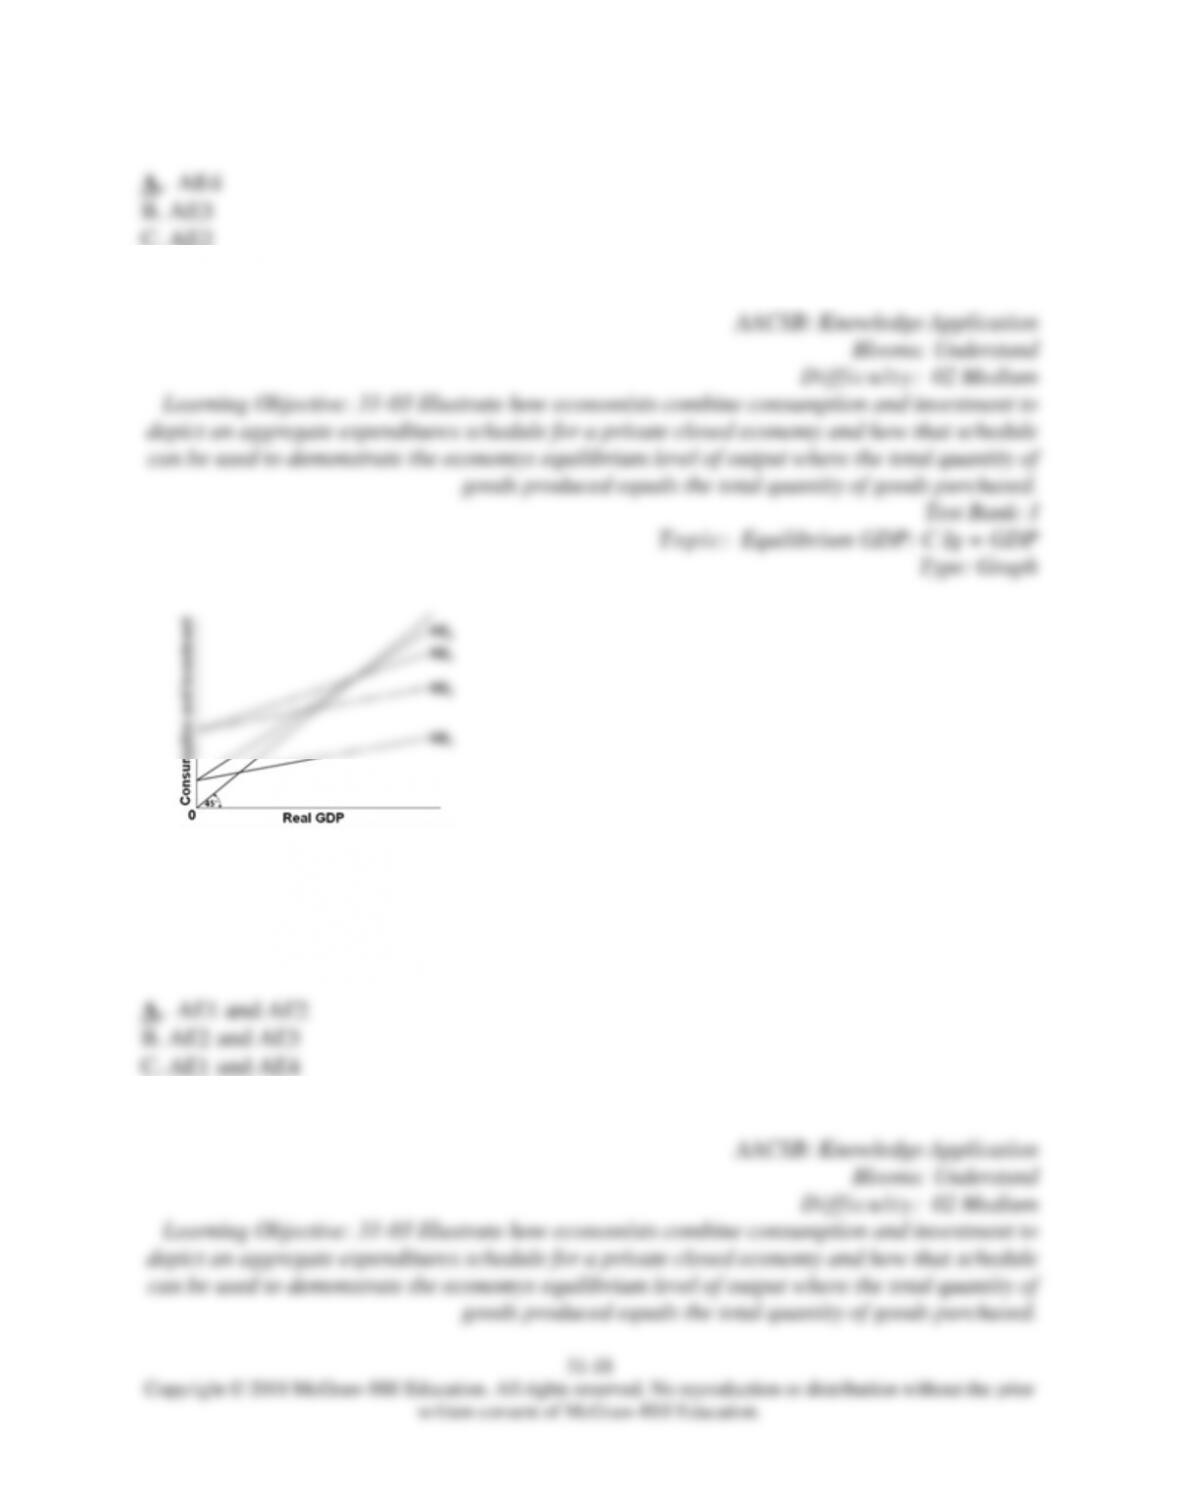
30.
Which two aggregate expenditure schedules AE in the diagram for a private closed economy
have the same MPC, assuming investment is the same at each level of income?
D.
AE3 and AE4
31–19
Copyright © 2018 McGraw-Hill Education. All rights reserved. No reproduction or distribution without the prior
written consent of McGraw-Hill Education.
Test Bank: I
To pi c:
Equilibrium GDP: C Ig = GDP
Type: Graph
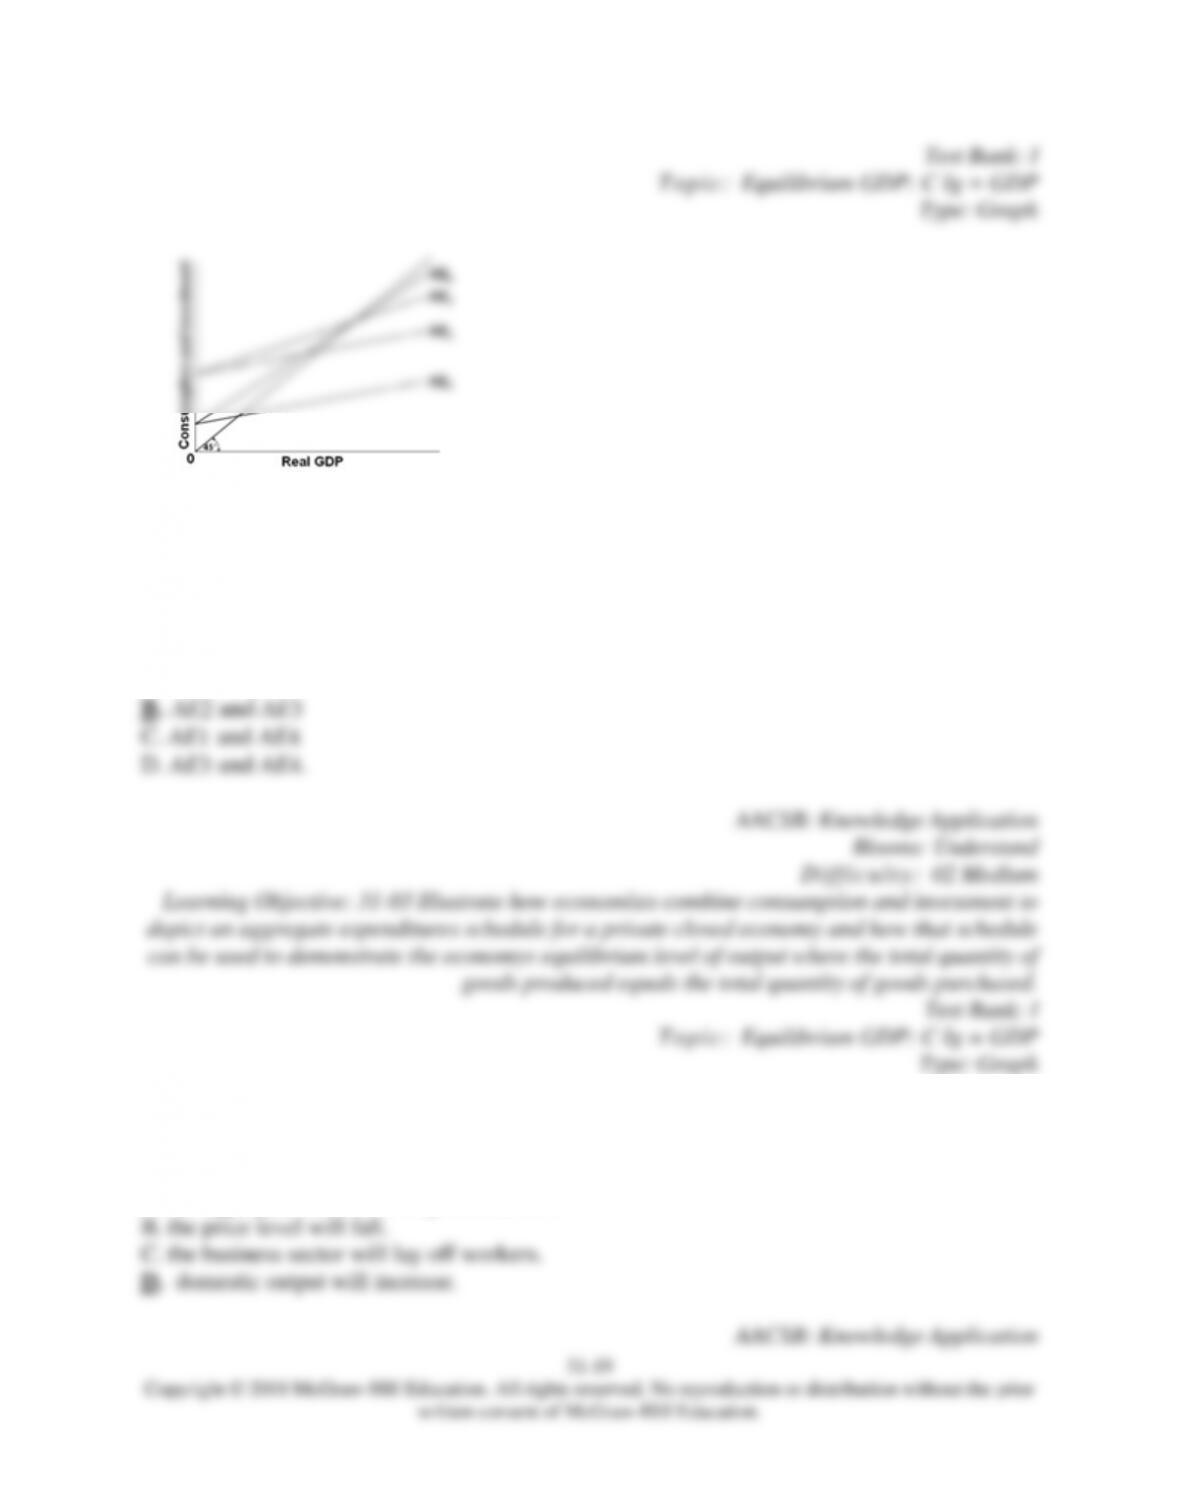
31.
Which aggregate expenditure schedule(s) AE in the diagram for a private closed economy
represent(s) the highest level of investment, assuming investment is the same at each level of
income and the level of consumption at zero income is the same for each schedule?
A. AE4 only
32.
If at some level of GDP the economy is experiencing an unintended decrease in
inventories,
A.
the aggregate level of saving will decline.
31–20
written consent of McGraw-Hill Education.
33.
If an unintended increase in business inventories occurs,
A.
we can expect aggregate production to be unaffected.
34.
Assume that in a private closed economy, consumption is $240 billion and investment is
$50 billion, both at the $280 billion level of domestic output. Thus,
A.
saving is $10 billion.