
30-141
Copyright © 2018 McGraw-Hill Education. All rights reserved. No reproduction or distribution without the prior
written consent of McGraw-Hill Education.
D. $4 billion.
273. A firm invests in a new machine that costs $2,000 a year but which is expected to produce
an increase in total revenue of $2,200 a year. The current real rate of interest is 8 percent. The
firm should
274. A firm invests in a new machine that costs $5,000 a year but which is expected to produce
an increase in total revenue of $5,200 a year. The current real rate of interest is 7 percent. The
firm should

30-142
275. The nominal rate of interest is 8.5 percent, and the real rate is 5 percent. The expected rate
of return on an investment is 8 percent. The firm should
276.
Expected Rate of Return
Cumulative Amount of Investment (in Billions)
22%
$110
20
150
16
180
10
210
5
295
2
380
According to the given cumulative investment table,

30-143
Copyright © 2018 McGraw-Hill Education. All rights reserved. No reproduction or distribution without the prior
written consent of McGraw-Hill Education.
A. $150 billion worth of investments have expected rates of return exactly equal to 20 percent.
B. $150 billion worth of investments have expected rates of return of 20 percent or lower.
C. $40 billion worth of investments have expected rates of return between 20 percent and 22
percent.
D. $260 billion worth of investments have expected rates of return higher than 20 percent.
277.
Expected Rate of Return
Cumulative Amount of Investment (in Billions)
22%
$110
20
150
16
180
10
210
5
295
2
380
According to the given cumulative investment table, if the real interest rate falls from 20
percent to 16 percent, then
278. The investment demand curve is drawn with the amount of investment on the
30-144
Copyright © 2018 McGraw-Hill Education. All rights reserved. No reproduction or distribution without the prior
written consent of McGraw-Hill Education.
A. vertical axis and disposable income on the horizontal axis.
B. horizontal axis and disposable income on the vertical axis.
C. horizontal axis and the expected rate of return and interest rate on the vertical axis.
D. vertical axis and the expected rate of return and interest rate on the horizontal axis.
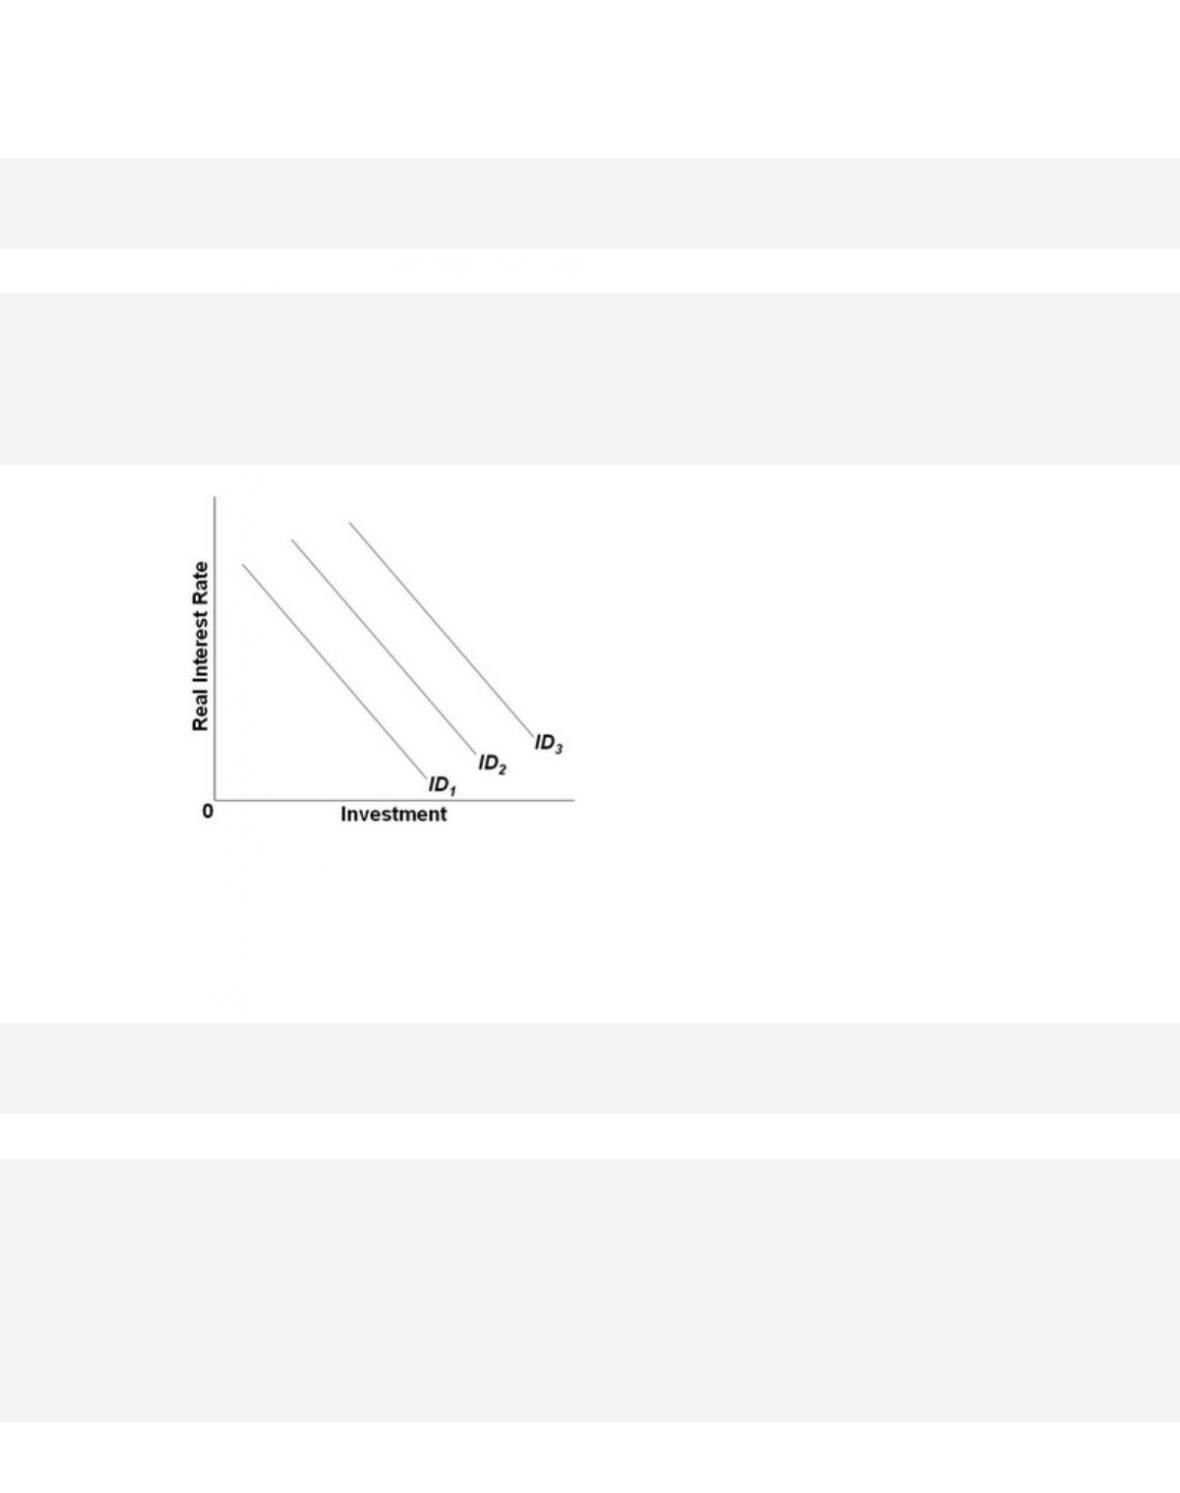
279.
In the accompanying graph, which of the following would shift the investment demand curve
from ID2 to ID1?
30-145
Copyright © 2018 McGraw-Hill Education. All rights reserved. No reproduction or distribution without the prior
written consent of McGraw-Hill Education.
Type: Table
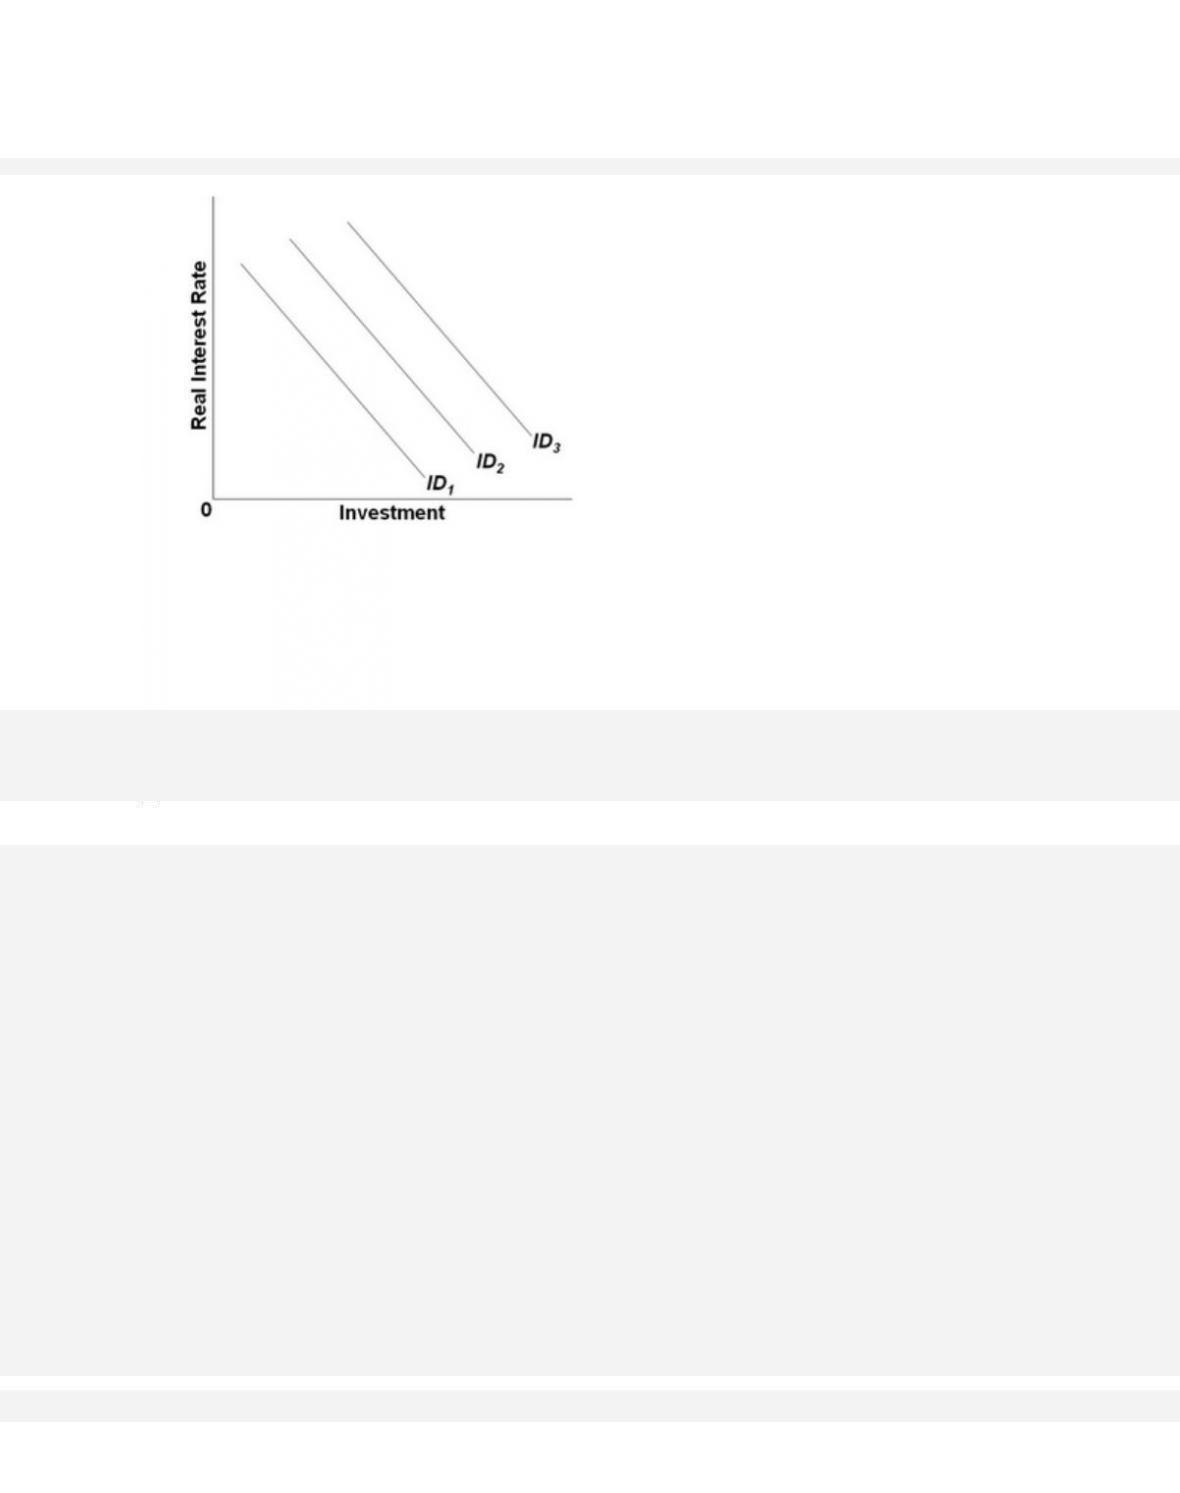
280.
In the accompanying graph, which of the following would shift the investment demand curve
from ID2 to ID3?
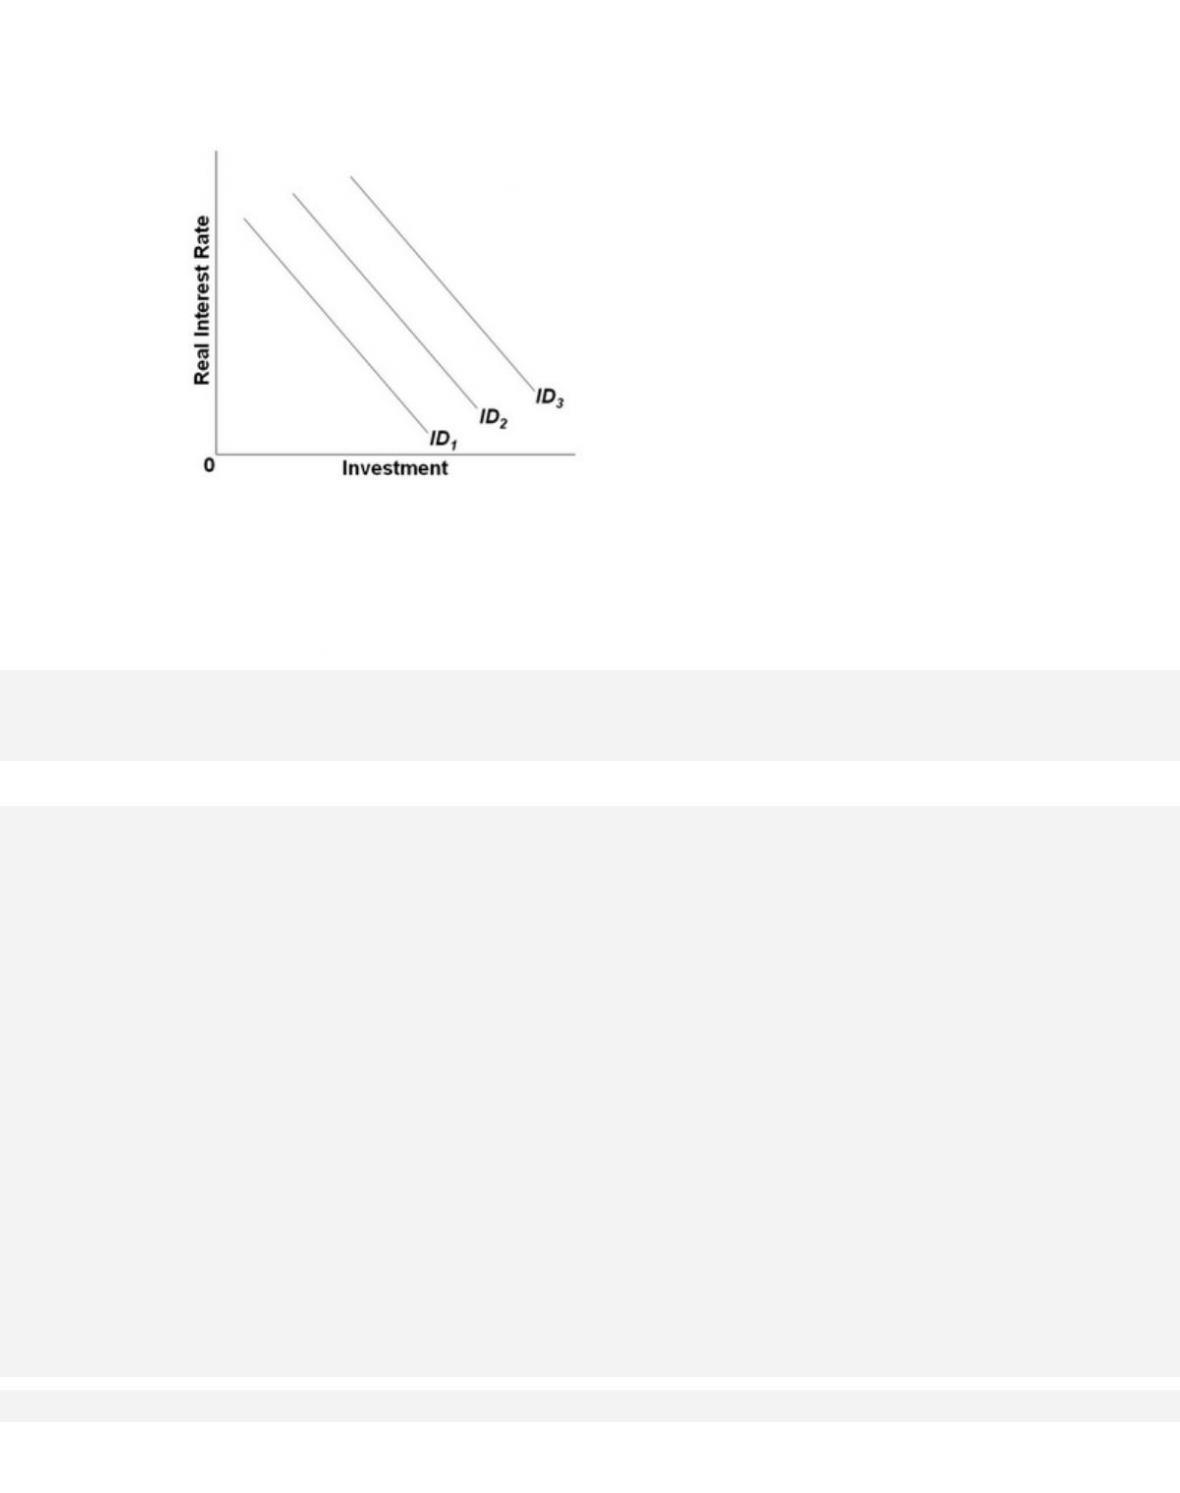
281.
In the accompanying graph, which of the following would shift the investment demand curve
from ID2 to ID1?
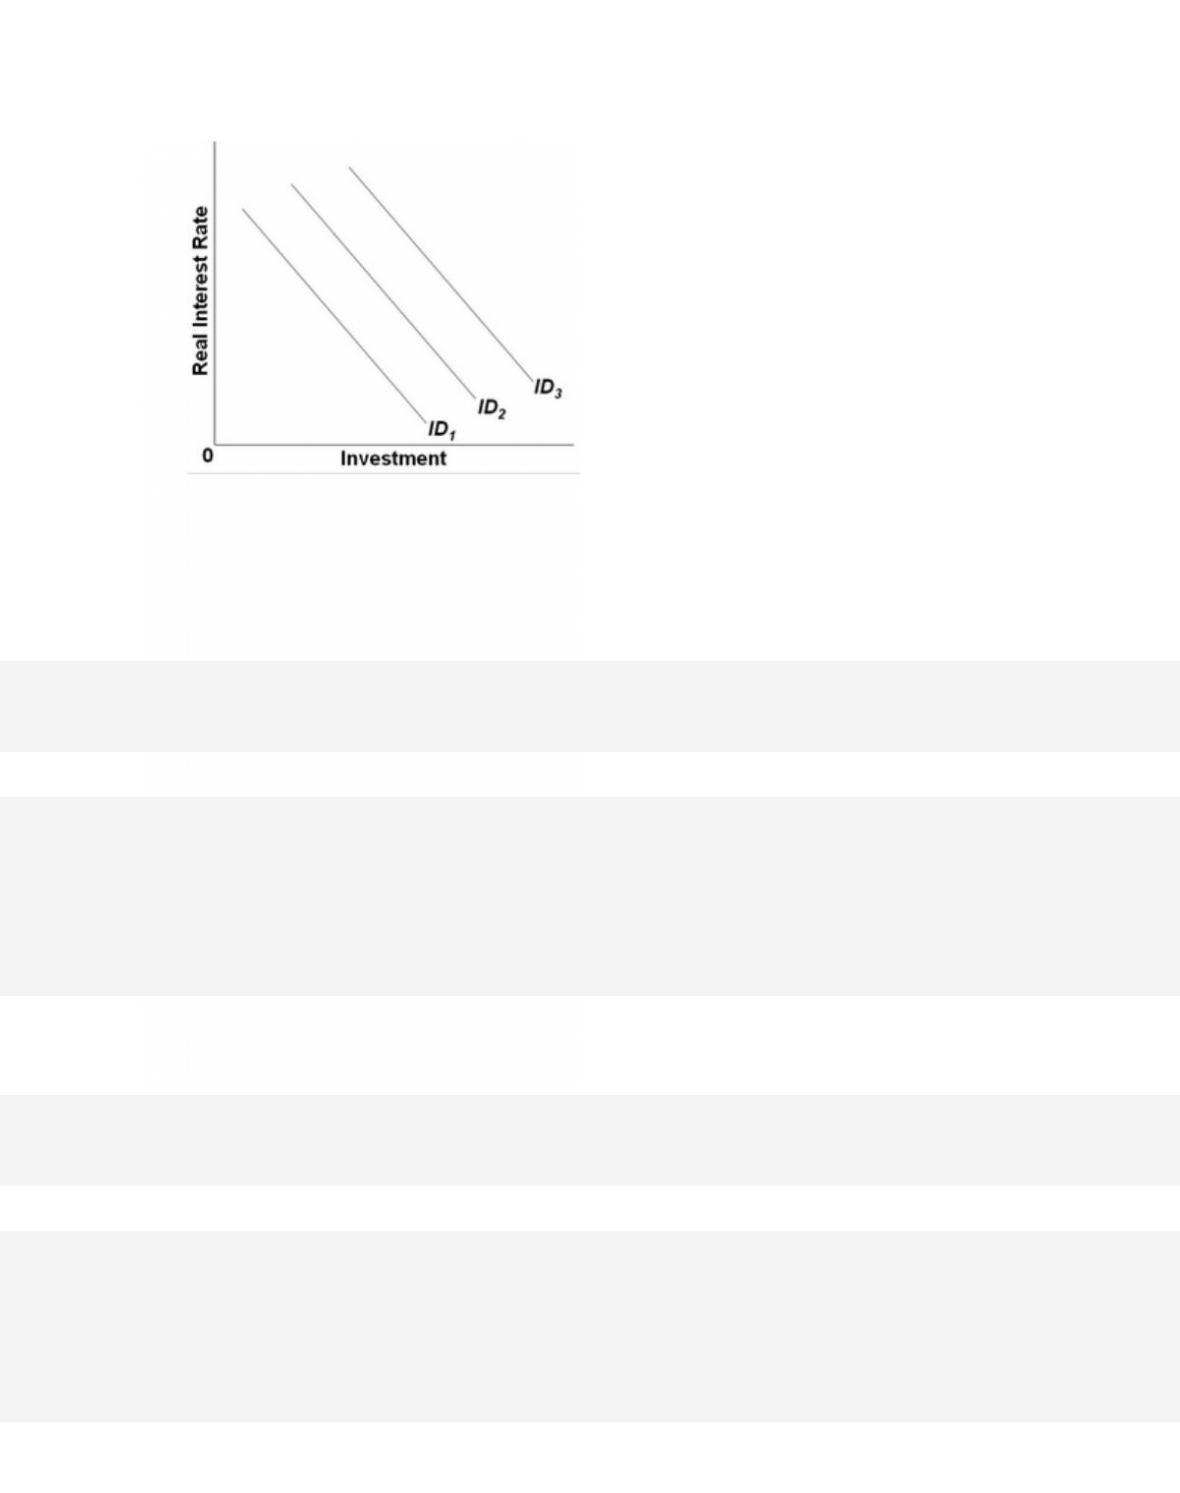
282.
In the accompanying graph, which of the following would shift the investment demand curve
from ID2 to ID3?
283. Which of the following factors would decrease investment demand?

30-148
Copyright © 2018 McGraw-Hill Education. All rights reserved. No reproduction or distribution without the prior
written consent of McGraw-Hill Education.
that can affect investment.
Test Bank: II
Topic:
Shifts of the Investment Demand Curve
284. If businesses feel more optimistic about the state of the economy, then this change is likely
to
285. The investment demand curve will shift to the left as the result of
286. Which of the following factors does not help explain the instability of investment?

30-149
Copyright © 2018 McGraw-Hill Education. All rights reserved. No reproduction or distribution without the prior
written consent of McGraw-Hill Education.
AACSB: Knowledge Application
Access i bility:
Keyboard Navigation
Blooms: Remember
Di f f i c u l t y :
01 Easy
Learning Objective: 30-04 Identify and explain factors other than the real interest rate
that can affect investment.
Test Bank: II
Topic:
Shifts of the Investment Demand Curve
287. The variability of business profits
288. Which factor explains the variability of investment?
289. During the Great Recession of 2007–2009, real interest rates

30-150
Copyright © 2018 McGraw-Hill Education. All rights reserved. No reproduction or distribution without the prior
written consent of McGraw-Hill Education.
B. declined to about zero, and investments also declined sharply.
C. increased sharply, and investments declined significantly.
D. increased sharply, and investments also rose significantly.
290. During the Great Recession of 2007–2009, the investment demand curve shifted

30-151
Copyright © 2018 McGraw-Hill Education. All rights reserved. No reproduction or distribution without the prior
written consent of McGraw-Hill Education.
Test Bank: II
Topic:
Shifts of the Investment Demand Curve
292. The multiplier effect relates
293. The multiplier can be calculated by dividing
294. Which of the following is not an assumption of the simple multiplier formula?

30-152
Copyright © 2018 McGraw-Hill Education. All rights reserved. No reproduction or distribution without the prior
written consent of McGraw-Hill Education.
AACSB: Knowledge Application
Acce ssib i l ity:
Keyboard Navigation
Blooms: Understand
D i f f i c u l t y :
02 Medium
Learning Objective: 30-05 Illustrate how changes in investment or one of the other
components of total spending can increase or decrease real GDP by a multiple amount.
Test Bank: II
Topic:
The Multiplier Effect
295. Generally speaking, the greater the MPS, the
296. If the MPC is 0.75, the multiplier will be

297. In a closed private economy, income is $50 billion and consumption is $40 billion. When
income rises by 10 percent, consumption rises by 9 percent. The MPS over the relevant income
range is
298. If, in an economy, a $200 billion increase in consumption spending creates $200 billion of
new income in the first round of the multiplier process and $160 billion in the second round, the
marginal propensity to consume and the multiplier are, respectively,
299. Assume the marginal propensity to consume is 0.8. If consumer spending increases by $20
billion, then real GDP will

30-154
Copyright © 2018 McGraw-Hill Education. All rights reserved. No reproduction or distribution without the prior
written consent of McGraw-Hill Education.
C. increase by $16 billion.
D. not change.
300. Assume that MPS is 0.4. If spending increases by $8 billion, then real GDP will increase
by
301.
Change in
Income
Change in
Consumption
Change in
Saving
Assumed Increase in
Investment
$5.00
$
$1.25
Second Round
$
$2.81
$
All Other Rounds
$
$8.44
$
Totals
$
$
$5.00
The table illustrates the multiplier process resulting from an autonomous increase in investment
by $5. The marginal propensity to consume is

302.
Change in
Income
Change in
Consumption
Change in
Saving
Assumed Increase in
Investment
$5.00
$
$1.25
Second Round
$
$2.81
$
All Other Rounds
$
$8.44
$
Totals
$
$
$5.00
The table illustrates the multiplier process resulting from an autonomous increase in investment
by $5. The change in income in round two will be