
30–81
Copyright © 2018 McGraw-Hill Education. All rights reserved. No reproduction or distribution without the prior
written consent of McGraw-Hill Education.
A. 2.
B. 3.
C. 4.
D. 5.
AACSB: Knowledge Application
Accessibility:
Keyboard Navigation
Blooms: Understand
D i f fi cu lt y:
02 Medium
Learning Objective: 30-05 Illustrate how changes in investment or one of the other
components of total spending can increase or decrease real GDP by a multiple amount.
Test Bank: I
Topic:
The Multiplier Effect
149. If the MPC is 0.70 and investment increases by $3 billion, the equilibrium GDP will
150. The numerical value of the multiplier will be smaller the

151. The practical significance of the multiplier is that it
152. If the MPC is 0.6, the multiplier will be
153. Assume the MPC is 2/3. If investment spending increases by $2 billion, the level of GDP
will increase by

30–83
Copyright © 2018 McGraw-Hill Education. All rights reserved. No reproduction or distribution without the prior
written consent of McGraw-Hill Education.
Blooms: Understand
D i f fi cu lt y:
02 Medium
Learning Objective: 30–05 Illustrate how changes in investment or one of the other
components of total spending can increase or decrease real GDP by a multiple
amount.
Test Bank: I
Topic:
The Multiplier Effect
154. The multiplier applies to
155. The multiplier effect indicates that
156.

30–84
Change in
Income
Change in
Consumption
Change in
Saving
Assumed Increase in
Investment
$20
$
$4.00
Second Round
$
$12.80
$
All Other Rounds
$
$51.20
$
Totals
$
$
$20.00
Refer to the given table, which illustrates the multiplier process. The marginal propensity to
consume is
157.
Change in
Income
Change in
Consumption
Change in
Saving
Assumed Increase in
Investment
$20
$
$4.00
Second Round
$
$12.80
$
All Other Rounds
$
$51.20
$
Totals
$
$
$20.00
Refer to the given table, which illustrates the multiplier process. The marginal propensity to
save is

158.
Change in
Income
Change in
Consumption
Change in
Saving
Assumed Increase in
Investment
$20
$
$4.00
Second Round
$
$12.80
$
All Other Rounds
$
$51.20
$
Totals
$
$
$20.00
Refer to the given table, which illustrates the multiplier process. The change in income in round
two will be

30–86
Copyright © 2018 McGraw-Hill Education. All rights reserved. No reproduction or distribution without the prior
written consent of McGraw-Hill Education.
components of total spending can increase or decrease real GDP by a multiple
amount.
Test Bank: I
Topic:
The Multiplier Effect
Type: Table
159.
Change in
Income
Change in
Consumption
Change in
Saving
Assumed Increase in
Investment
$20
$
$4.00
Second Round
$
$12.80
$
All Other Rounds
$
$51.20
$
Totals
$
$
$20.00
Refer to the given table, which illustrates the multiplier process. The total change in income
resulting from the initial change in investment will be
160.
Change in
Income
Change in
Consumption
Change in
Saving
Assumed Increase in
Investment
$20
$
$4.00
Second Round
$
$12.80
$
All Other Rounds
$
$51.20
$

Totals
$
$
$20.00
Refer to the given table, which illustrates the multiplier process. The total change in
consumption resulting from the initial change in investment will be
161.
Change in
Income
Change in
Consumption
Change in
Saving
Assumed Increase in
Investment
$20
$
$4.00
Second Round
$
$12.80
$
All Other Rounds
$
$51.20
$
Totals
$
$
$20.00
Refer to the given table, which illustrates the multiplier process. The multiplier in this economy
is

30–88
Copyright © 2018 McGraw-Hill Education. All rights reserved. No reproduction or distribution without the prior
written consent of McGraw-Hill Education.
D. 10.
162. If a $200 billion increase in investment spending creates $200 billion of new income in the
first round of the multiplier process and $160 billion in the second round, the multiplier in the
economy is
163. If a $50 billion decrease in investment spending causes income to decline by $50 billion in
the first round of the multiplier process and by $25 in the second round, the multiplier in the
economy is

30–89
Copyright © 2018 McGraw-Hill Education. All rights reserved. No reproduction or distribution without the prior
written consent of McGraw-Hill Education.
Learning Objective: 30-05 Illustrate how changes in investment or one of the other
components of total spending can increase or decrease real GDP by a multiple amount.
Test Bank: I
Topic:
The Multiplier Effect
164. If a $100 billion decrease in investment spending causes income to decline by $100 billion
in the first round of the multiplier process and by $75 billion in the second round, income will
eventually decline by
165. If a $500 billion increase in investment spending increases income by $500 billion in the
first round of the multiplier process and by $450 in the second round, income will eventually
increase by
166. If the marginal propensity to save is 0.2 in an economy, a $20 billion rise in investment
spending will increase

30–90
Copyright © 2018 McGraw-Hill Education. All rights reserved. No reproduction or distribution without the prior
written consent of McGraw-Hill Education.
A. GDP by $120 billion.
B. GDP by $20 billion.
C. saving by $25 billion.
D. consumption by $80 billion.
167. A $1 billion increase in investment will cause a
168. The actual multiplier effect in the U.S. economy is less than the multiplier effect in the text
examples because

30–91
Copyright © 2018 McGraw-Hill Education. All rights reserved. No reproduction or distribution without the prior
written consent of McGraw-Hill Education.
D i f fi c ul ty :
02 Medium
Learning Objective: 30–05 Illustrate how changes in investment or one of the other
components of total spending can increase or decrease real GDP by a multiple
amount.
Test Bank: I
Topic:
The Multiplier Effect
169. (Consider This) During the Great Recession of 2007–2009, both real interest rates and
investment spending declined. This suggests that
170. (Consider This) During the Great Recession of 2007–2009,

171. (Last Word) Art Buchwald‘s article “Squaring the Economic Circle” is a humorous
description of
172. (Last Word) Art Buchwald’s article “Squaring the Economic Circle” humorously describes
how
True / False Questions
173. If DI is $275 billion and the APC is 0.8, we can conclude that saving is $55 billion.

30–93
Copyright © 2018 McGraw-Hill Education. All rights reserved. No reproduction or distribution without the prior
written consent of McGraw-Hill Education.
Blooms: Understand
D i f fi c ul ty :
02 Medium
Learning Objective: 30-01 Describe how changes in income affect consumption and
saving.
Test Bank: I
Topic:
The Income-Consumption and Income-Saving Relationships
174. If the MPC is constant at various levels of income, then the APC must also be constant at
all of those income levels.
175. The average propensity to consume is defined as income divided by consumption.
176. 1 − MPC = MPS.

30–94
Copyright © 2018 McGraw-Hill Education. All rights reserved. No reproduction or distribution without the prior
written consent of McGraw-Hill Education.
Test Bank: I
Topic:
The Income-Consumption and Income-Saving Relationships
177. If the Hennige family’s marginal propensity to consume is 0.70, then it will necessarily
consume seven-tenths of its total income.
179. The slope of the consumption schedule is measured by the MPC.
180. A decline in the real interest rate will shift the investment demand curve to the right.

181. A specific investment will be undertaken if the expected rate of return, r, exceeds the
interest rate, i.
182. Investment is highly stable; it increases over time at a very steady rate.
183. The greater the MPC, the greater the multiplier.

184. The multiplier is equal to the reciprocal of the MPC.
185. The multiplier shows the relationship between changes in a component of spending, say,
investment, and the consequent changes in real income and output.
186. Economists widely agree that the value of the real-world multiplier is 2.5.

30–97
Copyright © 2018 McGraw-Hill Education. All rights reserved. No reproduction or distribution without the prior
written consent of McGraw-Hill Education.
AACSB: Knowledge Application
Access i b ility:
Keyboard Navigation
Blooms: Understand
D i f fi cu lt y:
02 Medium
Learning Objective: 30-05 Illustrate how changes in investment or one of the other
components of total spending can increase or decrease real GDP by a multiple amount.
Test Bank: I
Topic:
The Multiplier Effect
187. If the MPC is 0.9 and investment spending increases by $20 billion, real GDP will
increase by $200 billion.
Multiple Choice Questions
188. Personal saving is equal to
189. The amount of consumption in an economy correlates

30–98
Copyright © 2018 McGraw-Hill Education. All rights reserved. No reproduction or distribution without the prior
written consent of McGraw-Hill Education.
B. directly with the level of disposable income.
C. directly with the level of saving.
D. directly with the rate of interest.
190. The consumption schedule shows the relationship of household consumption to the level of
191. When a consumption schedule is plotted as a straight line, the slope of the consumption
line is

30–99
Copyright © 2018 McGraw-Hill Education. All rights reserved. No reproduction or distribution without the prior
written consent of McGraw-Hill Education.
Topic:
The Income-Consumption and Income-Saving Relationships
192. When the consumption schedule is plotted on a graph,
193. As disposable income decreases, consumption
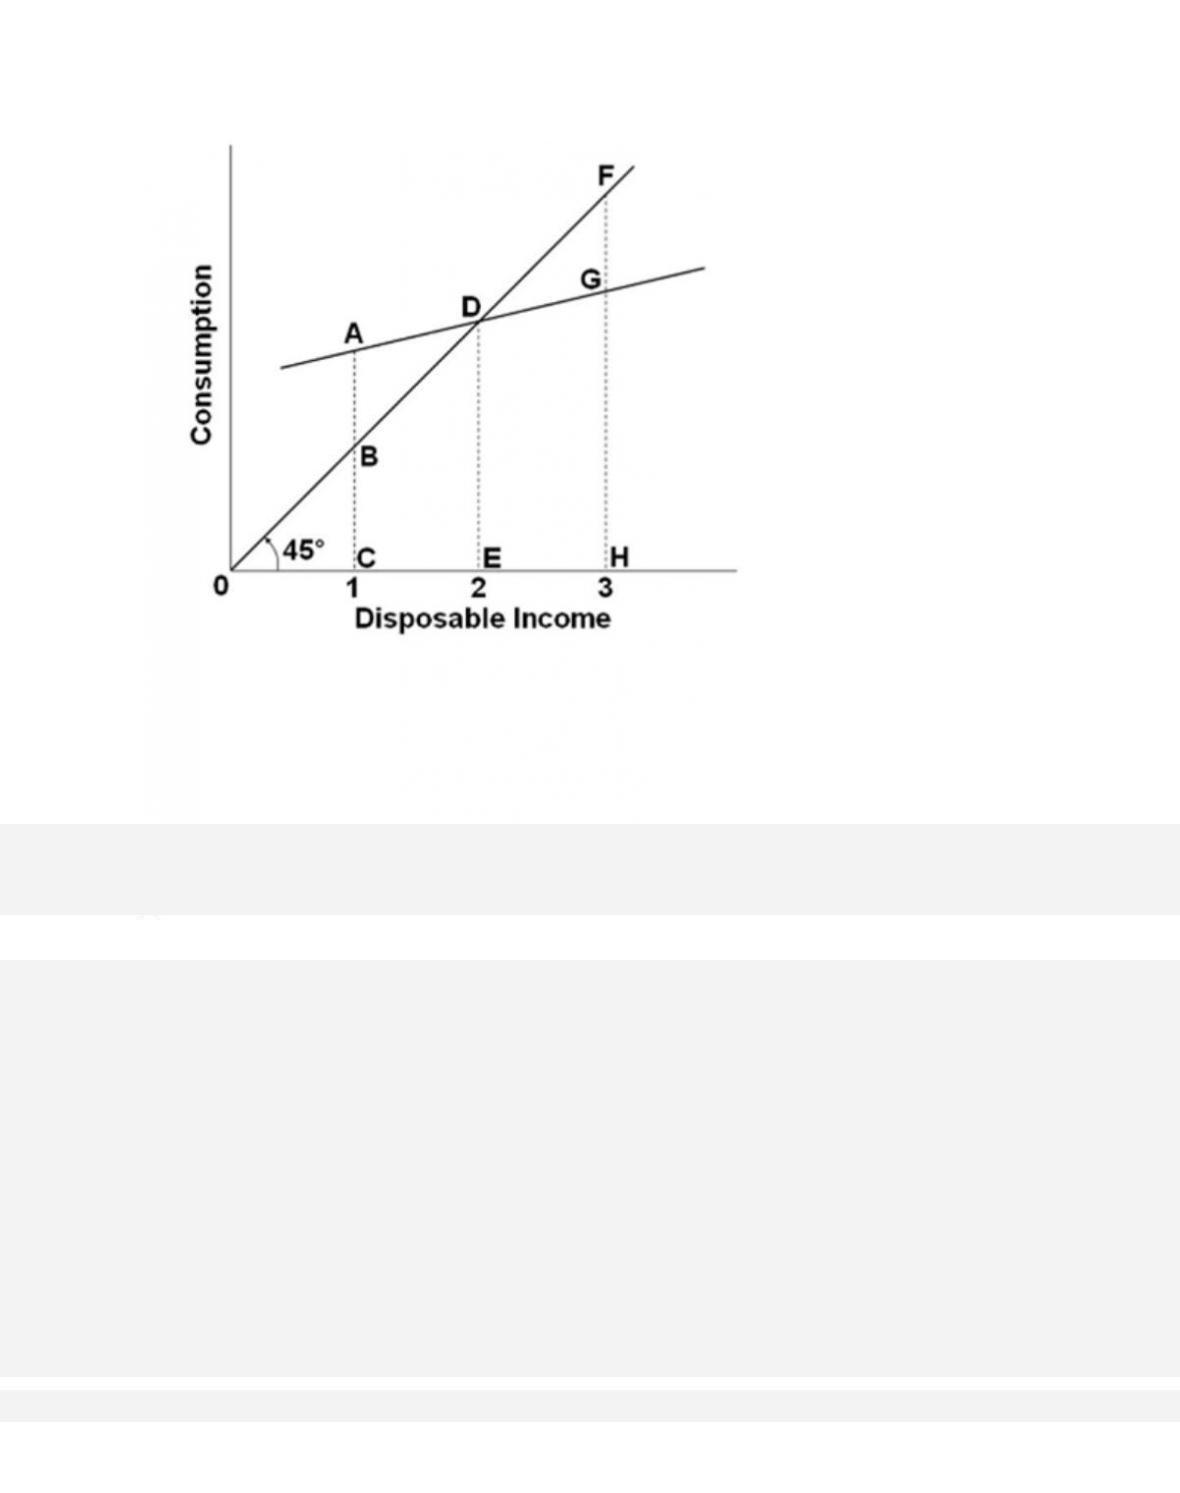
194.
Refer to the consumption schedule shown in the graph. At income level 3, the amount of
consumption is represented by the line segment