30–21
Copyright © 2018 McGraw-Hill Education. All rights reserved. No reproduction or distribution without the prior
written consent of McGraw-Hill Education.
Topic:
Nonincome Determinants of Consumption and Saving
51. The wealth effect is shown graphically as a
52.
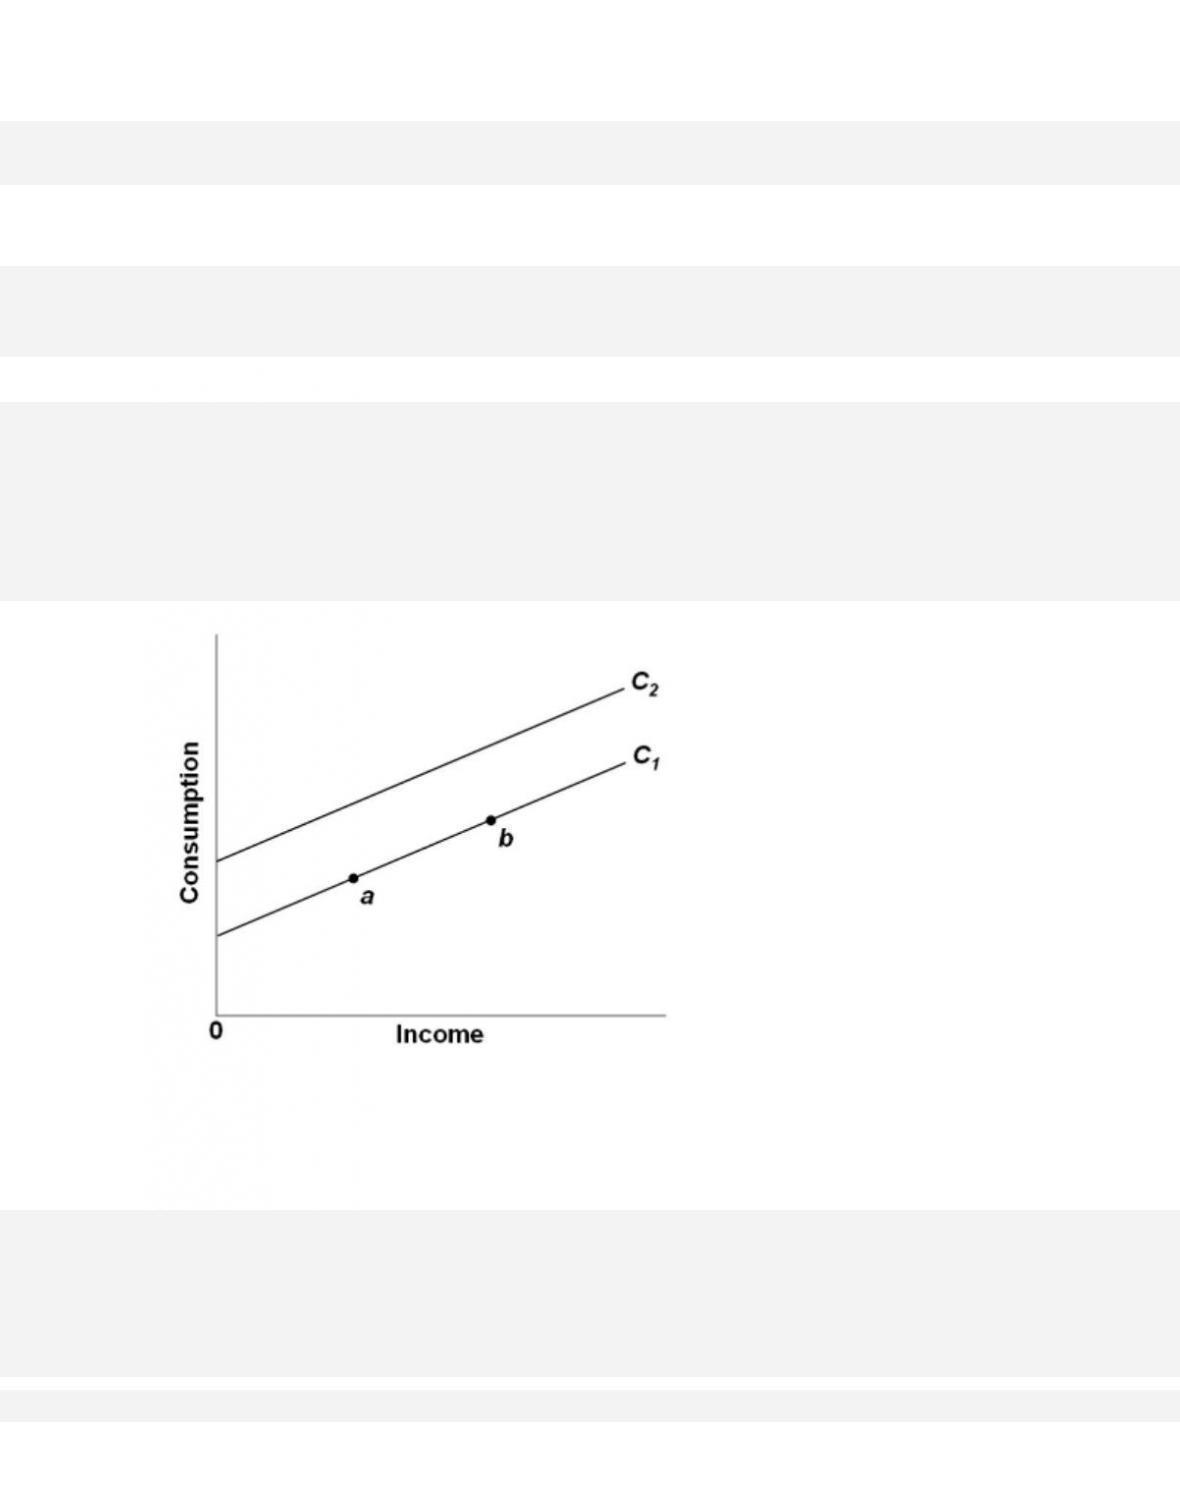
Refer to the given graph. A movement from b to a along C1 might be caused by a(n)
30–22
Copyright © 2018 McGraw-Hill Education. All rights reserved. No reproduction or distribution without the prior
written consent of McGraw-Hill Education.
AACSB: Knowledge Application
Blooms: Remember
Di f f i c u l t y :
01 Easy
Learning Objective: 30-02 List and explain factors other than income that can affect
consumption.
Test Bank: I
Topic:
Nonincome Determinants of Consumption and Saving
Type: Graph
53.
Refer to the given graph. A shift of the consumption schedule from C1 to C2 might be caused
by a(n)
54.
Refer to the given graph. A movement from a to b along C1 might be caused by a(n)
55.
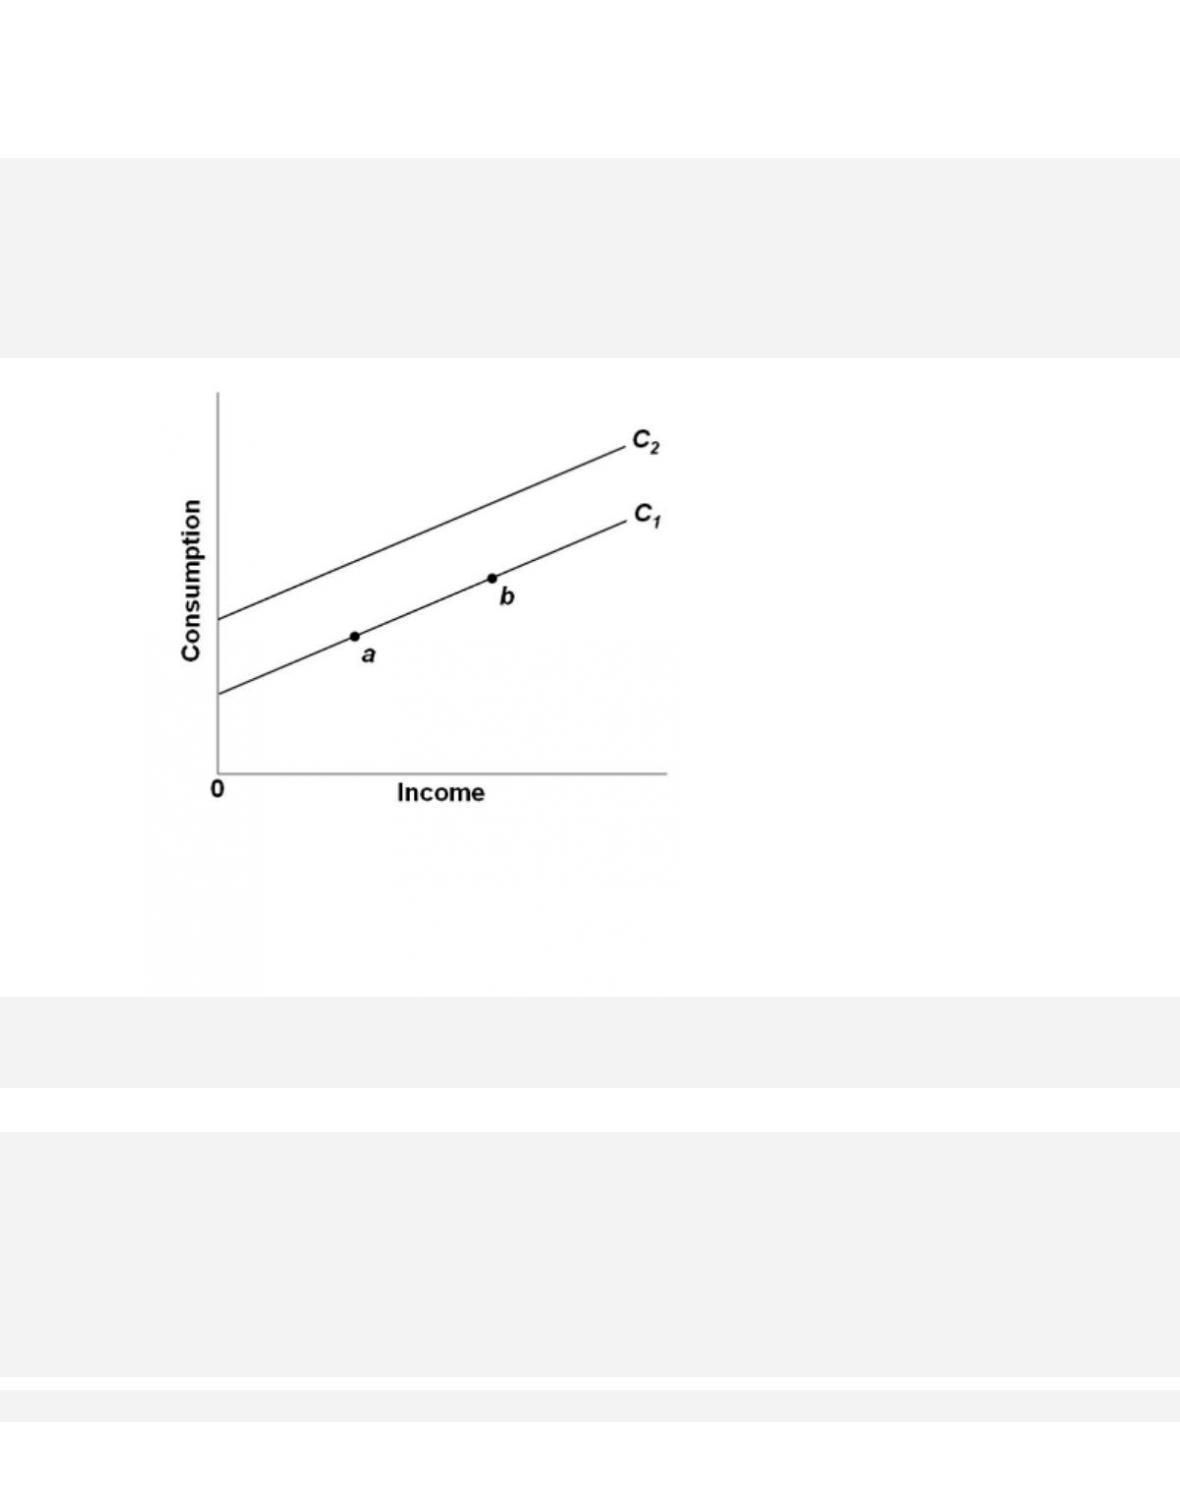
Refer to the given graph. A shift of the consumption schedule from C2 to C1 might be caused
by a(n)
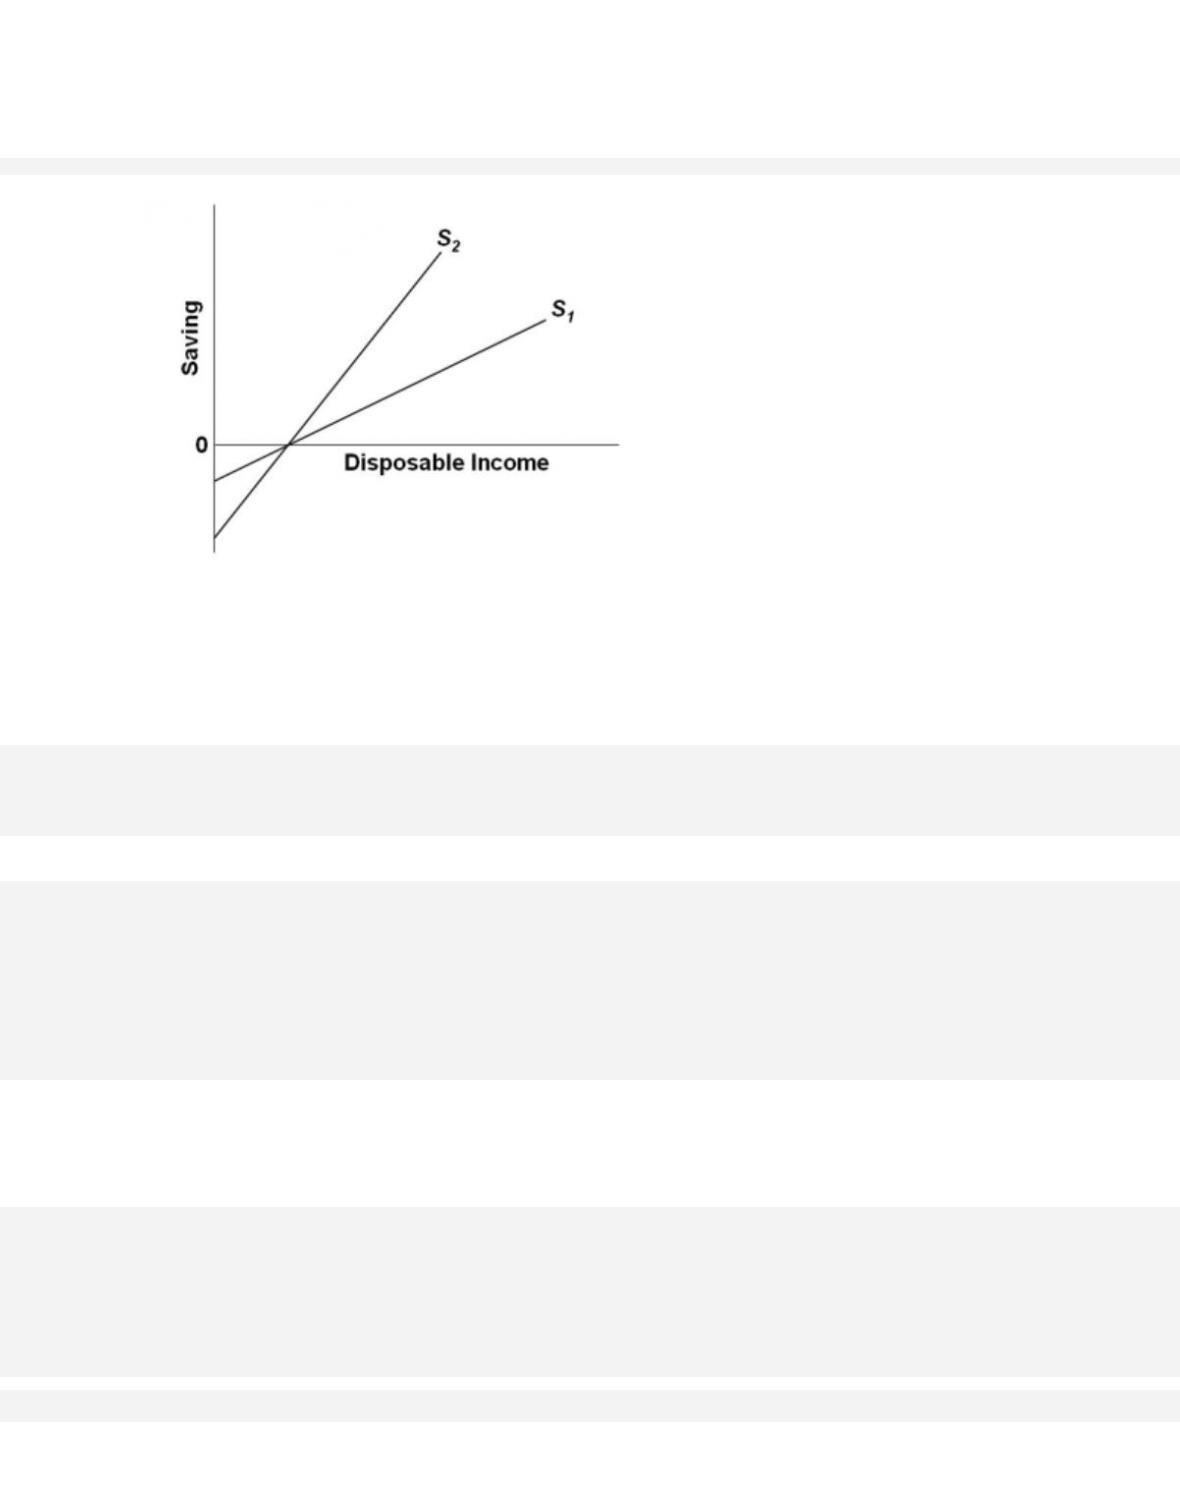
56. An upward shift of the saving schedule suggests

30–25
Copyright © 2018 McGraw-Hill Education. All rights reserved. No reproduction or distribution without the prior
written consent of McGraw-Hill Education.
Acces s i bility:
Keyboard Navigation
Blooms: Remember
Di f f i c u l t y :
01 Easy
Learning Objective: 30–02 List and explain factors other than income that can affect
consumption.
Test Bank: I
Topic:
Nonincome Determinants of Consumption and Saving
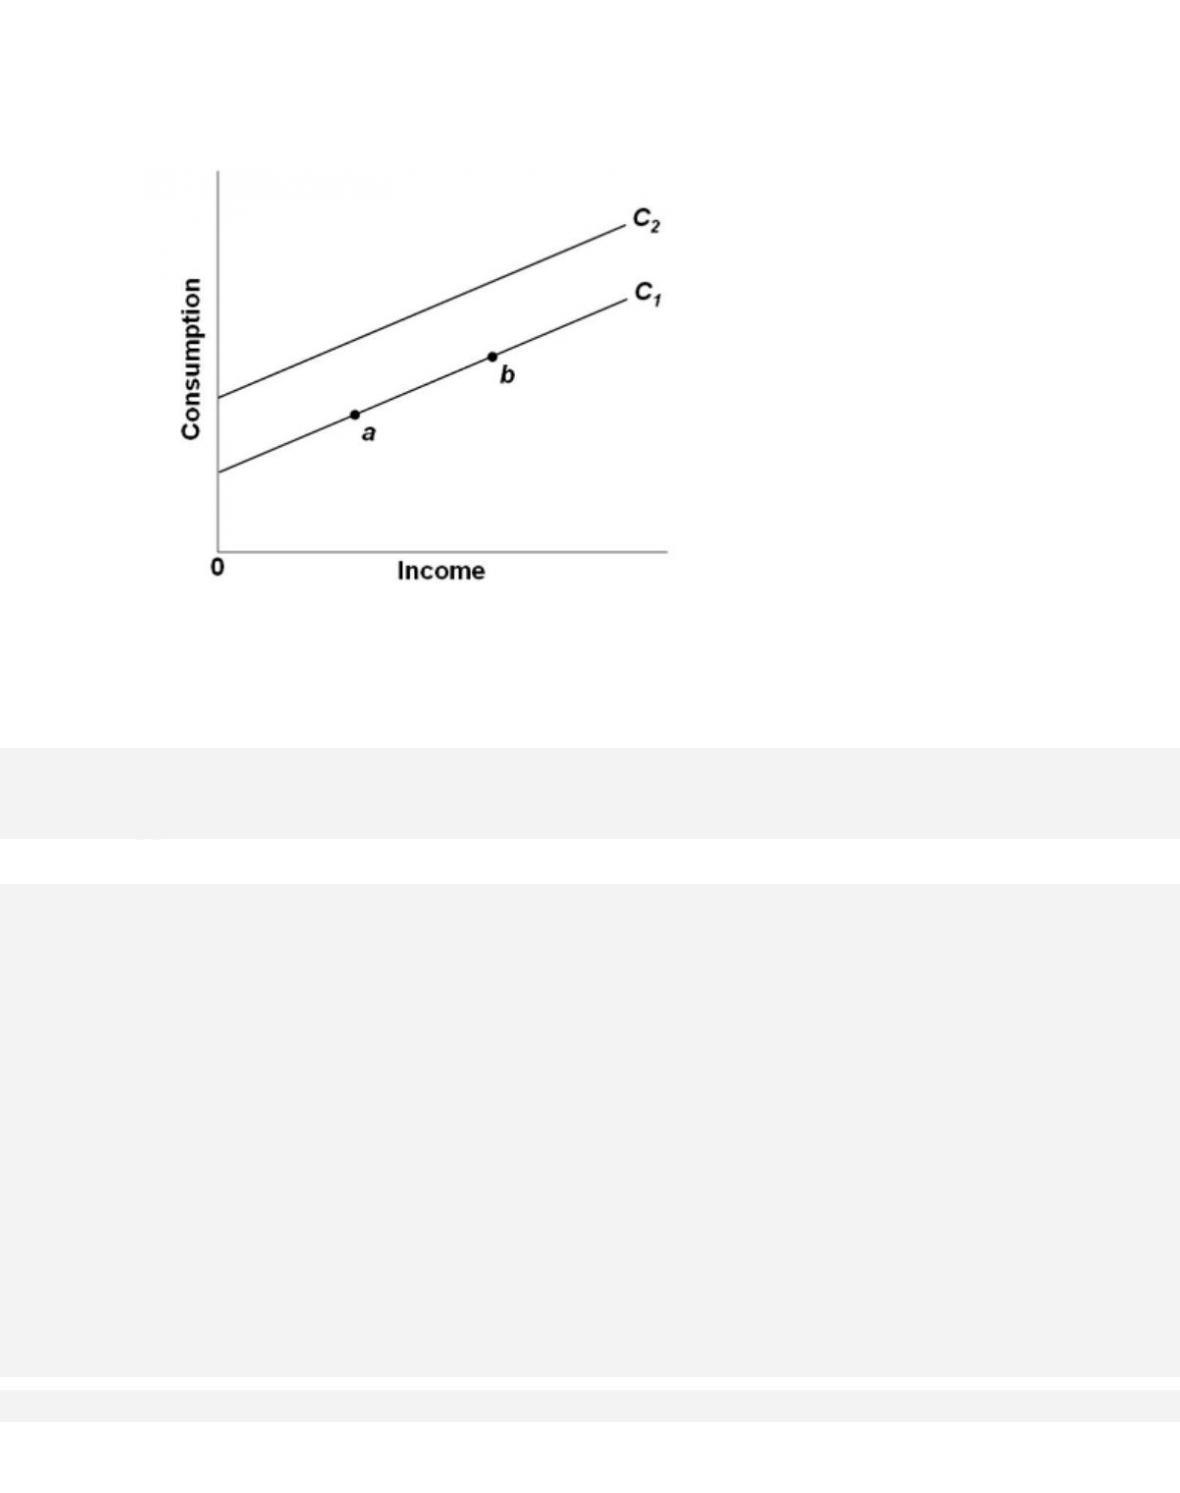
57. Which of the following will not tend to shift the consumption schedule upward?
58. If the consumption schedule shifts upward and the shift was not caused by a tax change, the
saving schedule
59. Which of the following will not cause the consumption schedule to shift?

30–26
Copyright © 2018 McGraw-Hill Education. All rights reserved. No reproduction or distribution without the prior
written consent of McGraw-Hill Education.
B. a change in consumer incomes
C. the expectation of a recession
D. a growing expectation that consumer durables will be in short supply
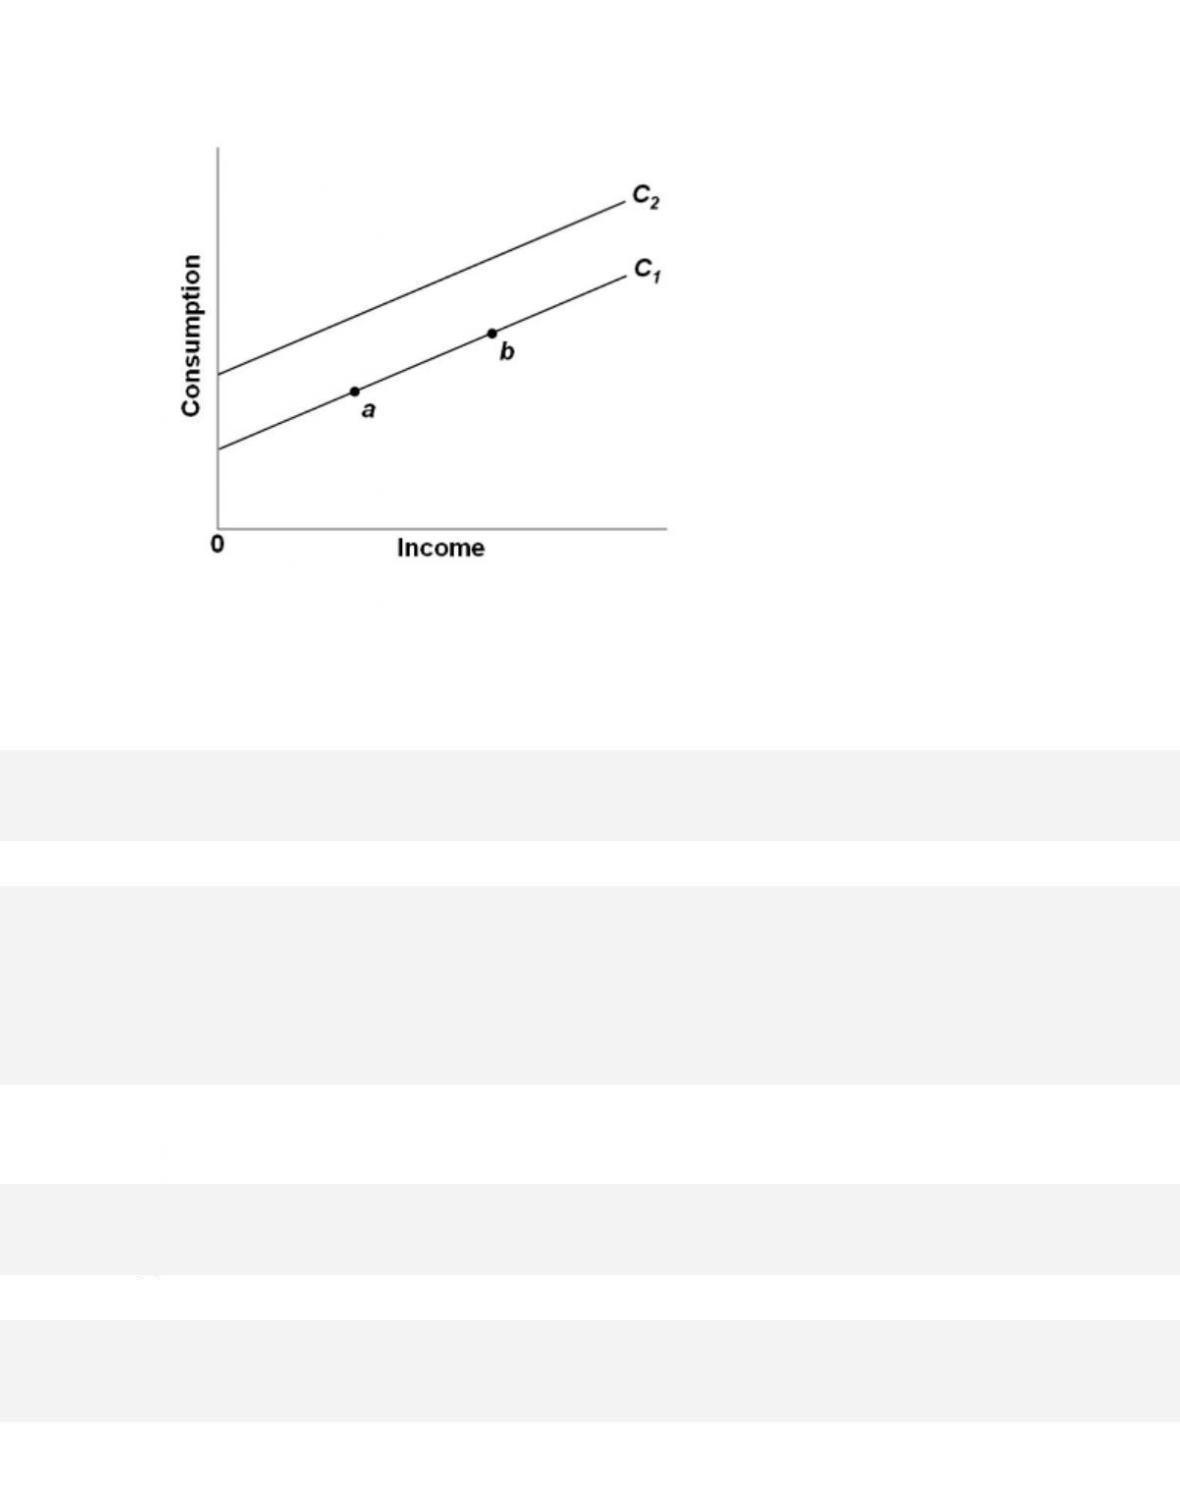
60. When consumption and saving are graphed relative to real GDP, an increase in personal
taxes will shift
61. If for some reason households become increasingly thrifty, we could show this by
30–27
Copyright © 2018 McGraw-Hill Education. All rights reserved. No reproduction or distribution without the prior
written consent of McGraw-Hill Education.
Topic:
Nonincome Determinants of Consumption and Saving
62.
Suppose the economy‘s saving schedule shifts from S1 to S2, as shown in the given diagram. We
can say that its
63. Assume the economy‘s consumption and saving schedules simultaneously shift downward.
This must be the result of

30–28
Copyright © 2018 McGraw-Hill Education. All rights reserved. No reproduction or distribution without the prior
written consent of McGraw-Hill Education.
AACSB: Knowledge Application
Acces s i bility:
Keyboard Navigation
Blooms: Remember
Di f f i c u l t y :
01 Easy
Learning Objective: 30–02 List and explain factors other than income that can affect
consumption.
Test Bank: I
Topic:
Nonincome Determinants of Consumption and Saving
64.
Suppose an economy‘s consumption schedule shifts from C1 to C2, as shown in the diagram.
We can say that its

30–29
Copyright © 2018 McGraw-Hill Education. All rights reserved. No reproduction or distribution without the prior
written consent of McGraw-Hill Education.
Type: Graph
65.
Disposable Income
Consumption
$200
$205
225
225
250
245
275
265
300
285
Refer to the given data. The marginal propensity to consume is
66.
Disposable Income
Consumption
$200
$205
225
225
250
245
275
265
300
285
Refer to the given data. At the $200 level of disposable income,

30–30
Copyright © 2018 McGraw-Hill Education. All rights reserved. No reproduction or distribution without the prior
written consent of McGraw-Hill Education.
A. the marginal propensity to save is 2½ percent.
B. dissaving is $5.
C. the average propensity to save is 0.20.
D. the average propensity to consume is 0.80.
67.
Disposable Income
Consumption
$200
$205
225
225
250
245
275
265
300
285
Refer to the given data. If disposable income was $325, we would expect consumption to be

68.
Refer to the given diagram. The marginal propensity to consume is equal to

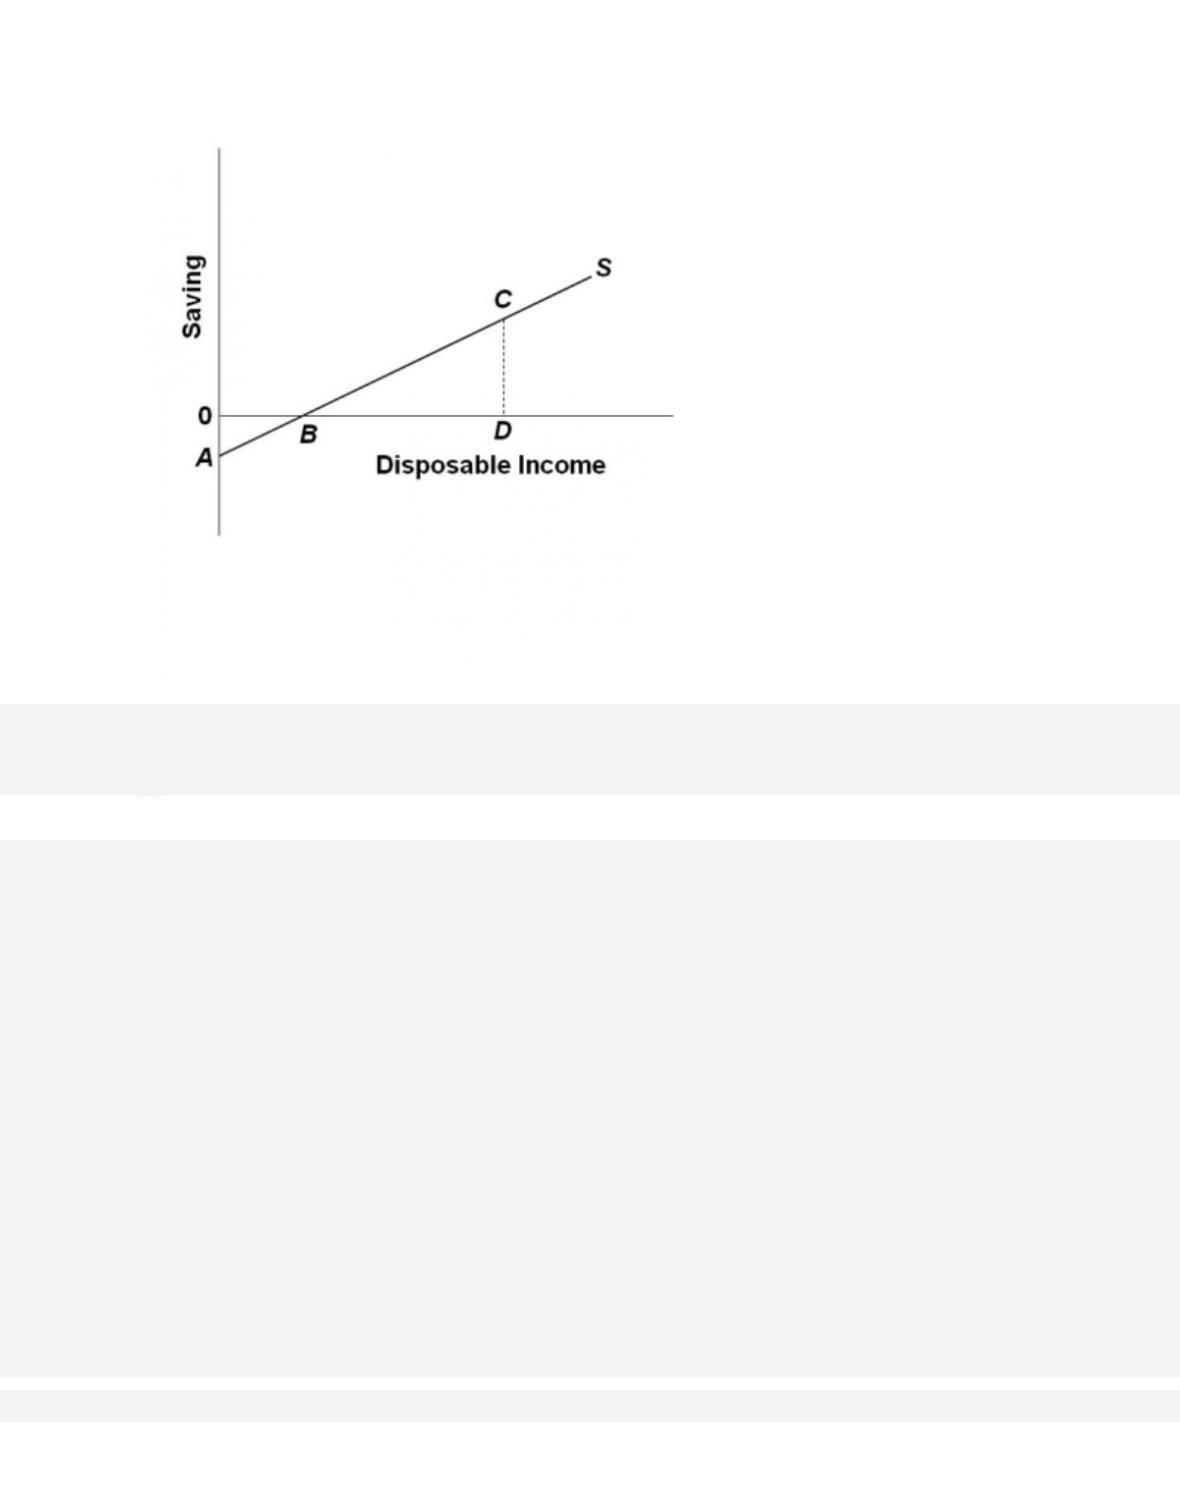
69.
Refer to the given diagram. At income level F, the volume of saving is

70.
Refer to the given diagram. Consumption will be equal to income at

71.
Refer to the given diagram. The economy is dissaving
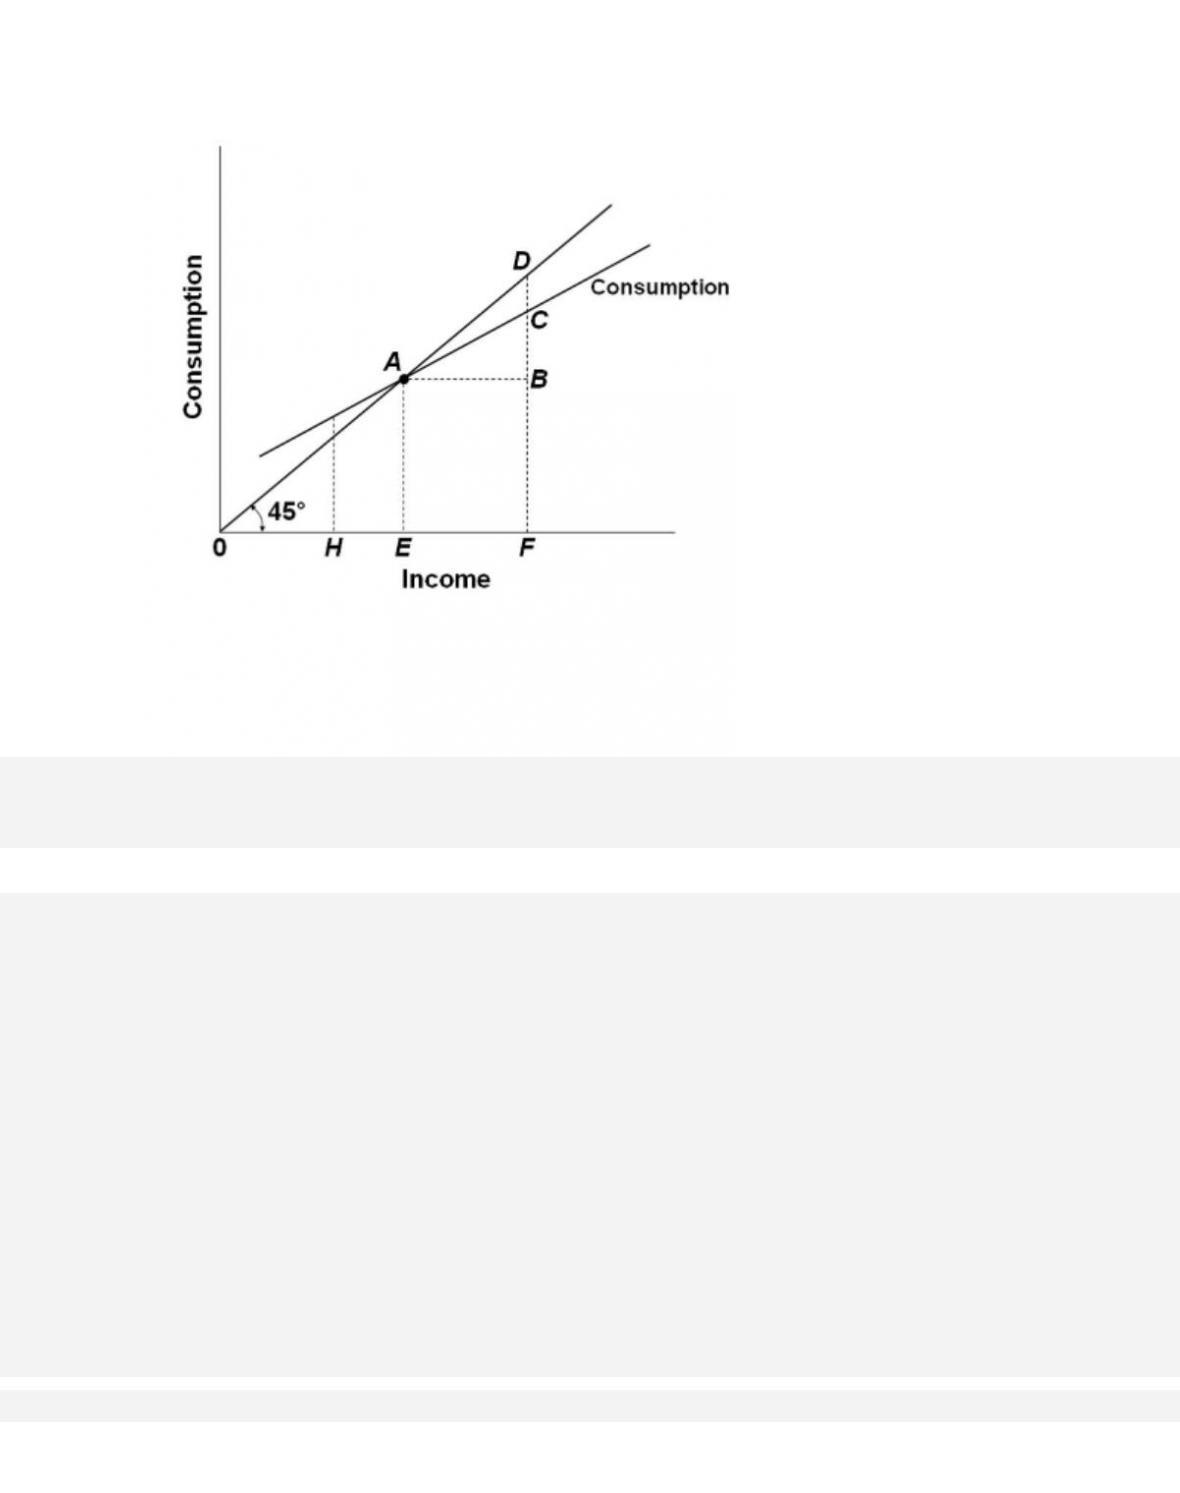
72.
Refer to the given diagram. The marginal propensity to save is
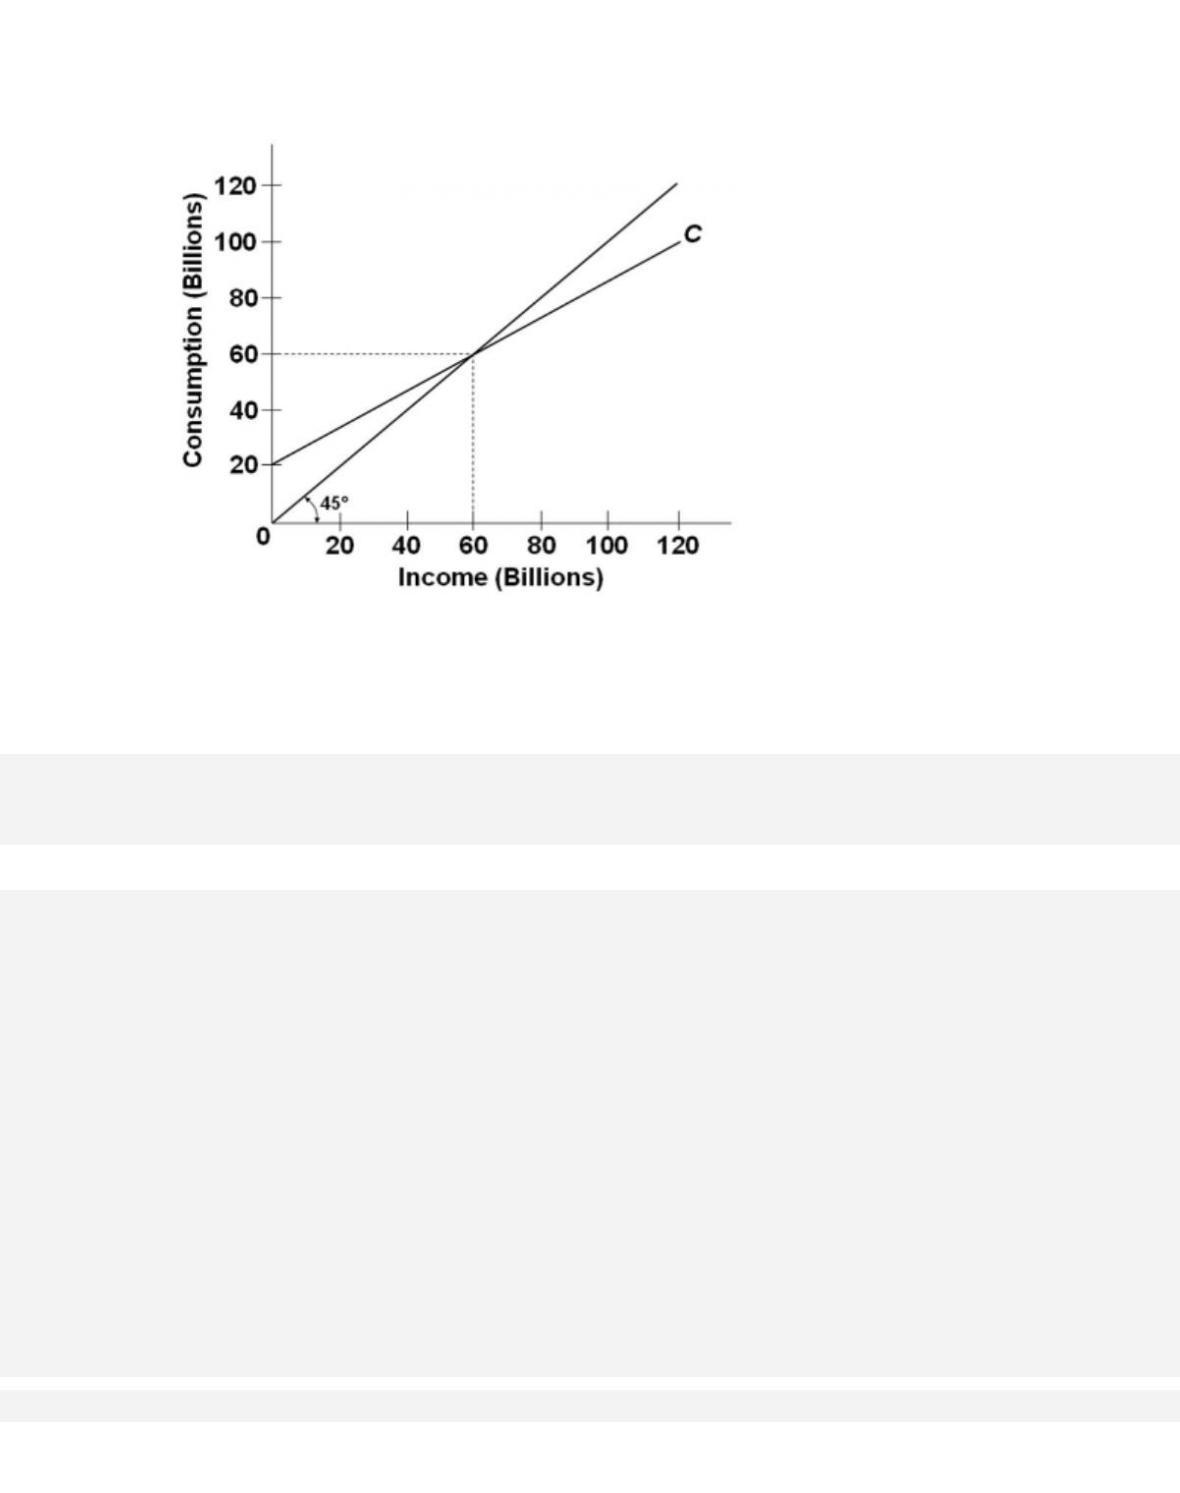
73.
The given figure suggests that
30–37
74.
Refer to the given figure. If the relevant saving schedule were constructed,
75.
Disposable Income
Saving
$0
-$10
50
0
100
10
150
20
200
30

Refer to the given data for a hypothetical economy. The marginal propensity to consume is
76.
Disposable Income
Saving
$0
-$10
50
0
100
10
150
20
200
30
Refer to the given data for a hypothetical economy. At the $100 level of income, the average
propensity to save is

30–39
Copyright © 2018 McGraw-Hill Education. All rights reserved. No reproduction or distribution without the prior
written consent of McGraw-Hill Education.
Topic:
The Income-Consumption and Income-Saving Relationships
Type: Table
77.
Disposable Income
Saving
$0
-$10
50
0
100
10
150
20
200
30
Refer to the given data for a hypothetical economy. If plotted on a graph, the slope of the saving
schedule would be
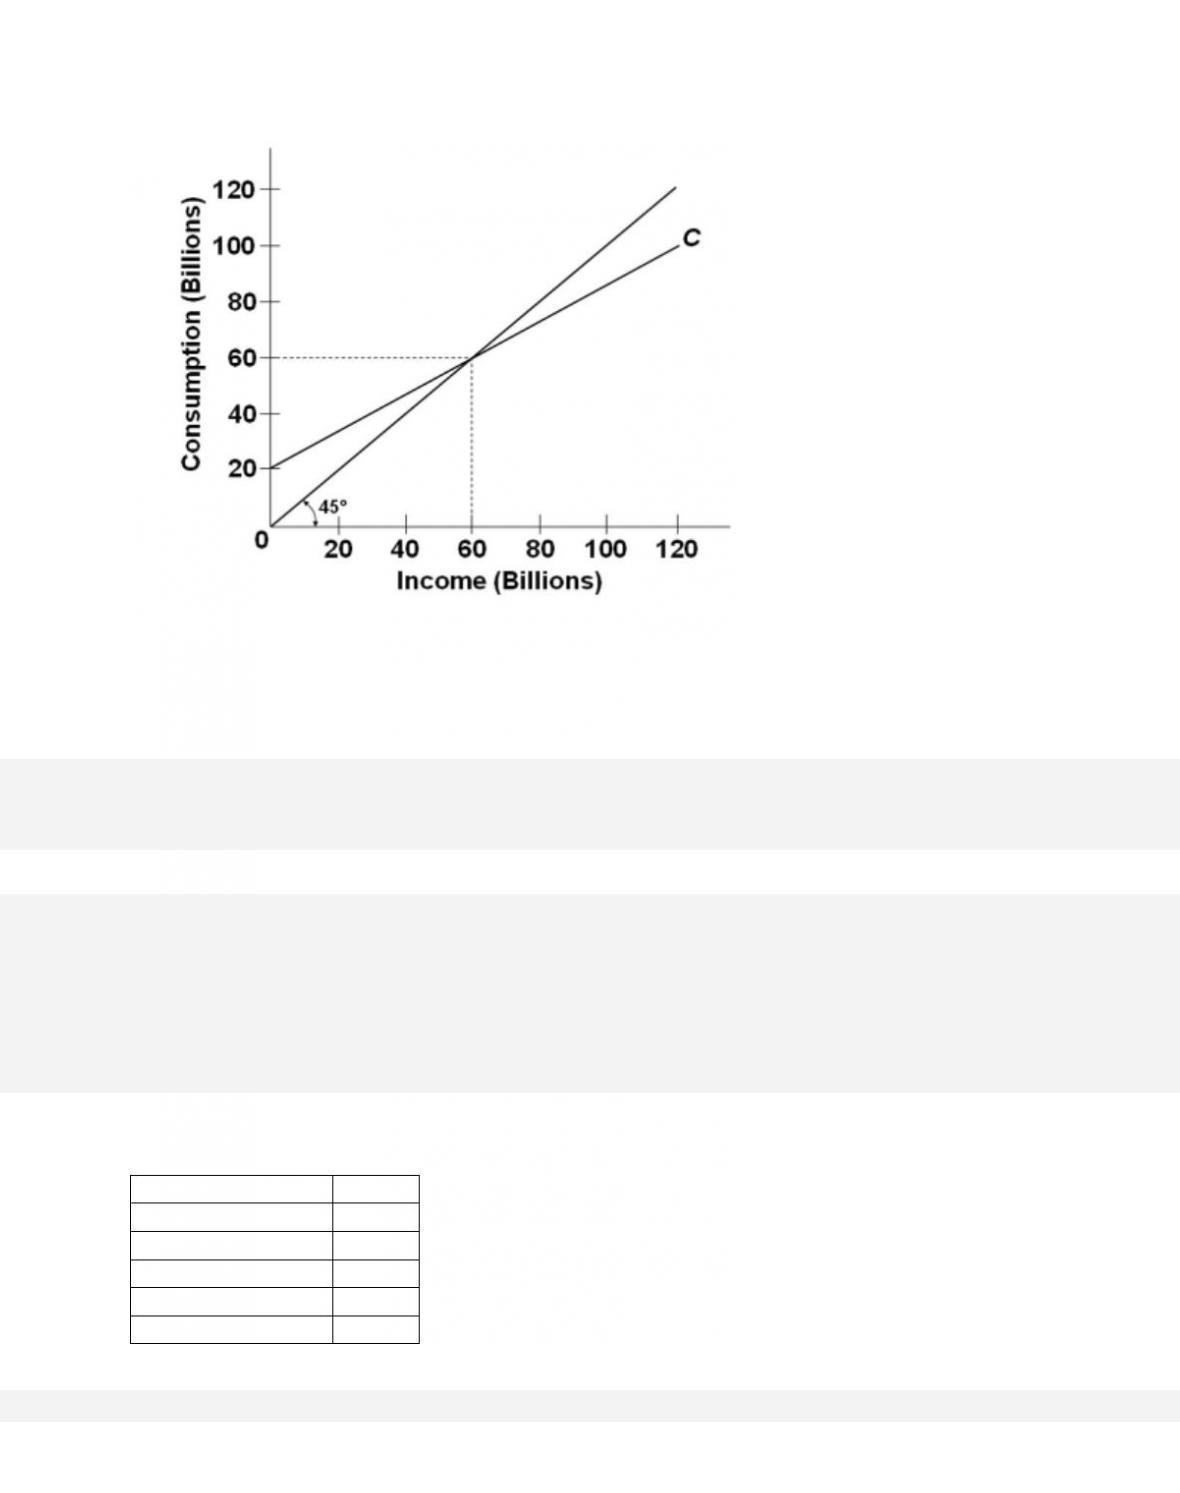
78.
Refer to the given diagram. The marginal propensity to save is equal to