
C.
5.0 percent
148.
Nation A’s real GDP was $520 billion in 2015 and $550 billion in 2016. Its population
was 150 million in 2015 and 155 million in 2016. On the other hand, Nation B’s real GDP
was $200 billion in 2015 and $210 billion in 2016; and its population was 53 million in
2015 and 55 million in 2016. Which of the following statements is true?
149.
Nation A’s real GDP was $520 billion in 2015 and $550 billion in 2016. Its population
was 150 million in 2015 and 155 million in 2016. On the other hand, Nation B’s real GDP
was $200 billion in 2015 and $210 billion in 2016; and its population was 53 million in
2015 and 55 million in 2016. Which of the following statements is true?

28–62
Copyright © 2018 McGraw-Hill Education. All rights reserved. No reproduction or distribution without the prior
written consent of McGraw-Hill Education.
Learning Objective: 28-01 List two ways that economic growth is measured.
Test Bank: II
Topic: Economic Growth
150.
The “rule of 70″ is a formula for determining the approximate number of
151.
A nation’s average annual real GDP growth rate is 2.5 percent. Based on the rule of 70,
the approximate number of years that it would take for this nation’s real GDP to double is
152.
Consider two scenarios for a nation’s economic growth. Scenario A has real GDP
growing at an average annual rate of 3.5 percent; scenario B has an average annual growth
of 4.5
percent. The nation’s real GDP would double in about

28–63
Copyright © 2018 McGraw-Hill Education. All rights reserved. No reproduction or distribution without the prior
written consent of McGraw-Hill Education.
AACSB: Knowledge Application
Accessibility: Keyboard Navigation
Blooms: Remember
Dif f i c u l ty: 01 Easy
Learning Objective: 28-01 List two ways that economic growth is measured.
Test Bank: II
Topic: Economic Growth
153.
Economic growth in the U.S. since 1950 has been characterized by
154.
At what average annual rate have real GDP and real GDP per capita grown from 1950
to 2015?
155.
The following factors tend to make the real GDP growth rate understate the growth of
economic well-being, except

28–64
Copyright © 2018 McGraw-Hill Education. All rights reserved. No reproduction or distribution without the prior
written consent of McGraw-Hill Education.
C.
debasement of the environment.
D. a lower-stress lifestyle.
156.
Before the Industrial Revolution, living standards in the world
157.
Economic historians identify which invention as a major factor that started the
Industrial Revolution in Britain?

158.
The invention of the steam engine ushered in the following developments, except
159.
Which of the following does not correctly characterize modern economic growth?
160.
In the modern economic growth process, it is typical to find that

28–66
Copyright © 2018 McGraw-Hill Education. All rights reserved. No reproduction or distribution without the prior
written consent of McGraw-Hill Education.
structures needed for an economy to experience it.
Test Bank: II
Topic: Modern Economic Growth
161.
Modern economic growth often results in the following, except
162.
The main cause for the vast differences in per capita GDP levels seen across the globe
today is the
163.
Growth-promoting institutional structures include the following, except

28–67
164.
Patents and copyrights foster the flow of
165.
Efficient financial institutions foster the flow of
166.
The reasons why per capita GDP in the U.S. is significantly higher than in some other
rich countries like, say, France, include the following, except

167.
Supply factors in economic growth include the following, except
168.
Which of the following is best considered a demand factor in economic growth?

28–69
Copyright © 2018 McGraw-Hill Education. All rights reserved. No reproduction or distribution without the prior
written consent of McGraw-Hill Education.
give rise to economic growth.
Test Bank: II
Topic: Determinants of Growth
169.
Which of the following is a demand factor in economic growth?
170.
Which of the following is the so-called efficiency factor of economic growth?
171.
Economic growth can best be portrayed as a
28–70
Copyright © 2018 McGraw-Hill Education. All rights reserved. No reproduction or distribution without the prior
written consent of McGraw-Hill Education.
AACSB: Knowledge Application
Accessibility: Keyboard Navigation
Blooms: Remember
Dif f i c u l ty: 01 Easy
Learning Objective: 28-03 Identify the general supply, demand, and efficiency forces that
give rise to economic growth.
Test Bank: II
Topic: Production Possibilities Analysis
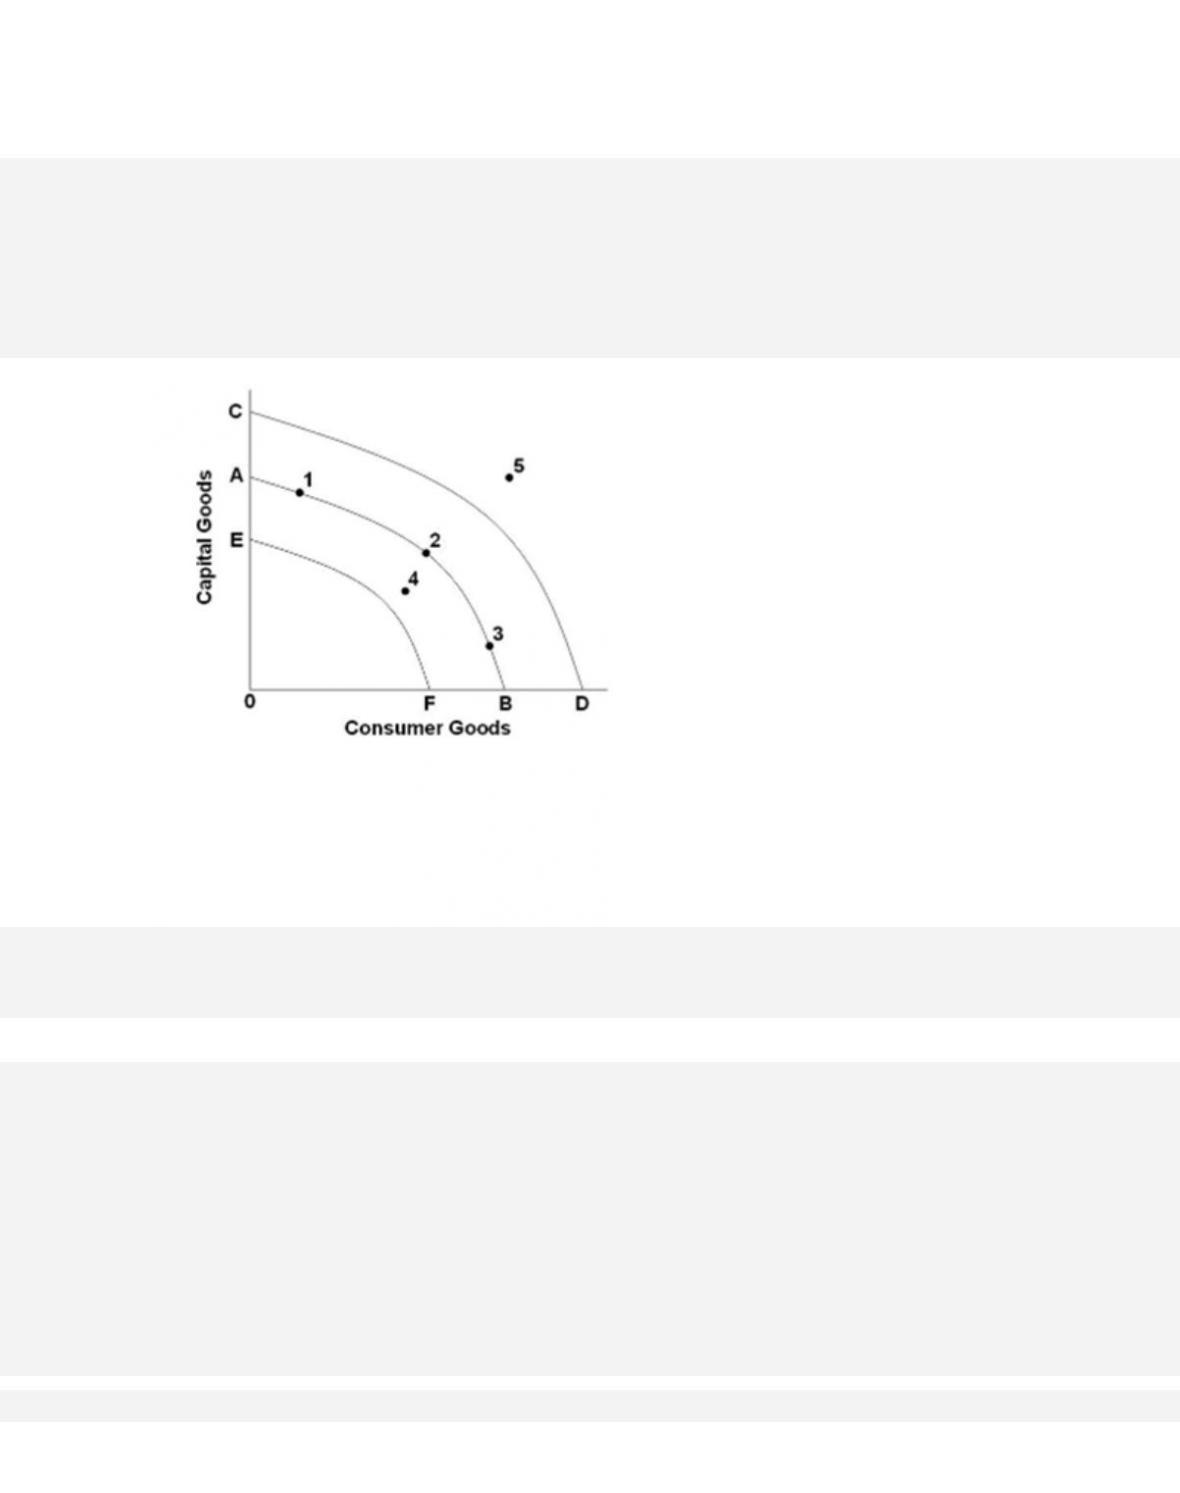
172.
Assume a nation’s current production possibilities are represented by the curve AB in the
accompanying diagram. Economic growth would best be indicated by a
173.
Refer to the accompanying diagram. If the production possibilities curve of an economy
shifts from AB to CD, it is most likely the result of what type of factor affecting economic
growth?
174.
Refer to the accompanying diagram. If the production possibilities of an economy are shown
by curve AB but the economy is operating at point 4, the reasons are most likely to be
because of

175.
Refer to the accompanying diagram. Which of the following is the most likely cause for a
shift in the production possibilities curve from AB to CD?
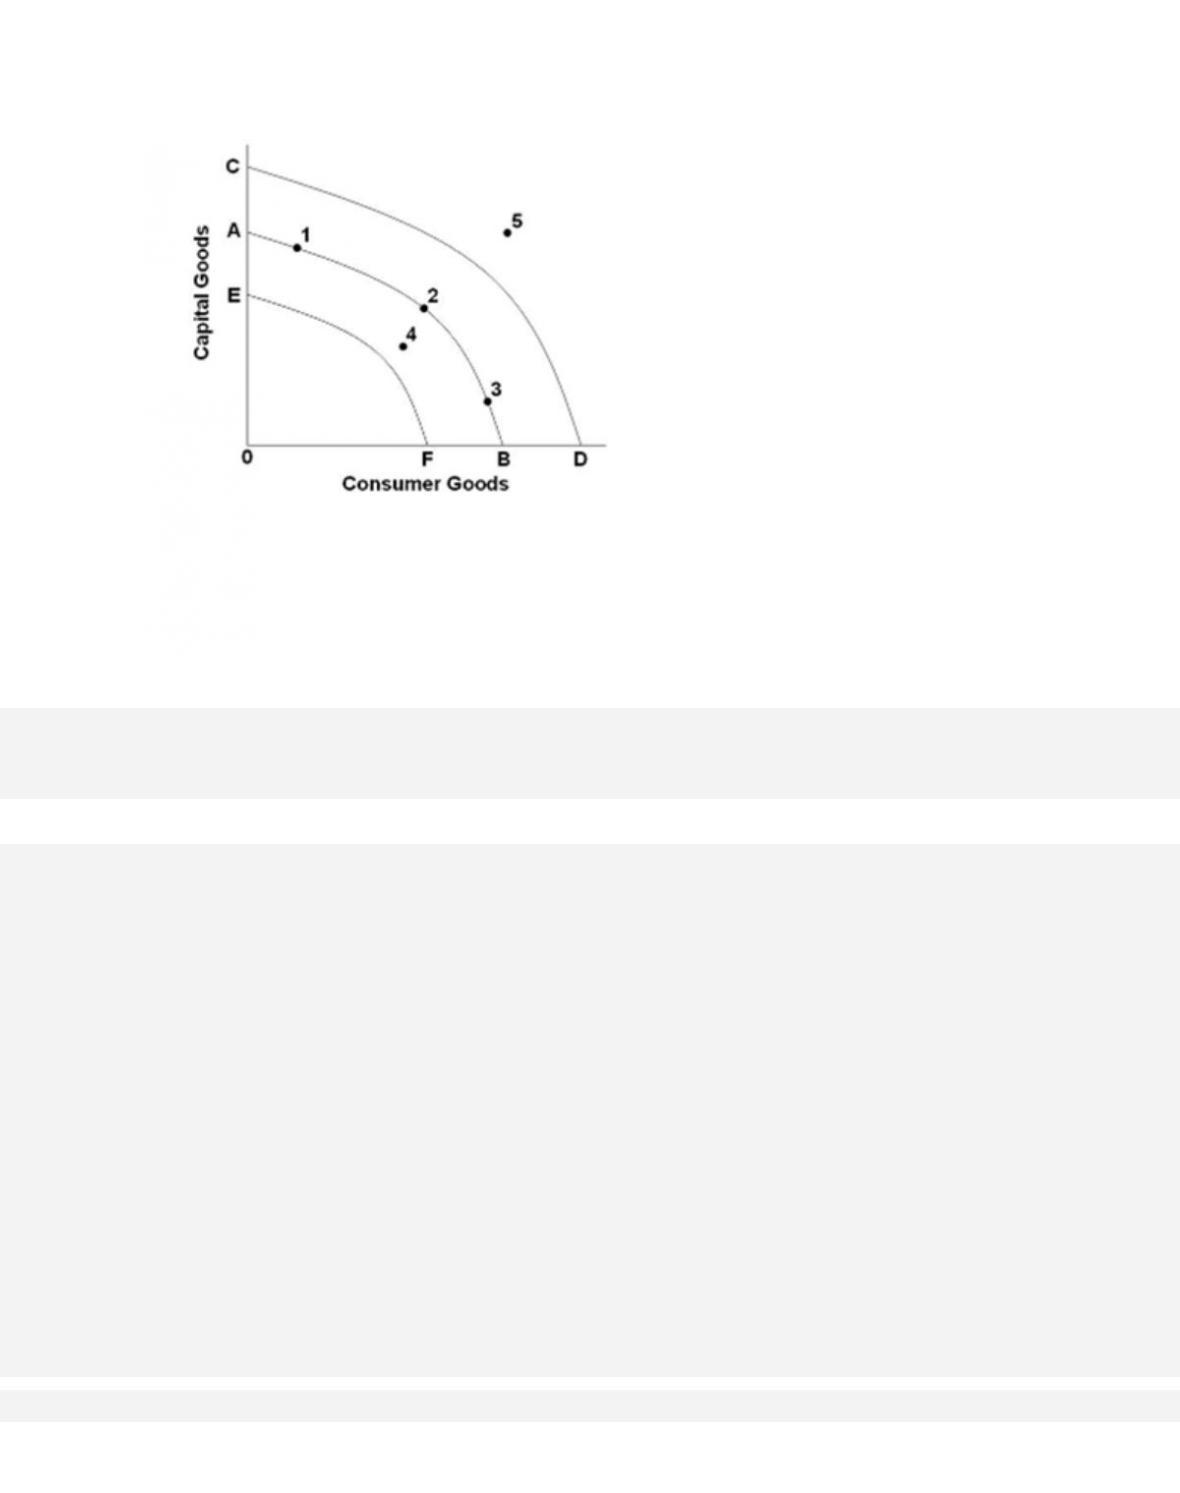
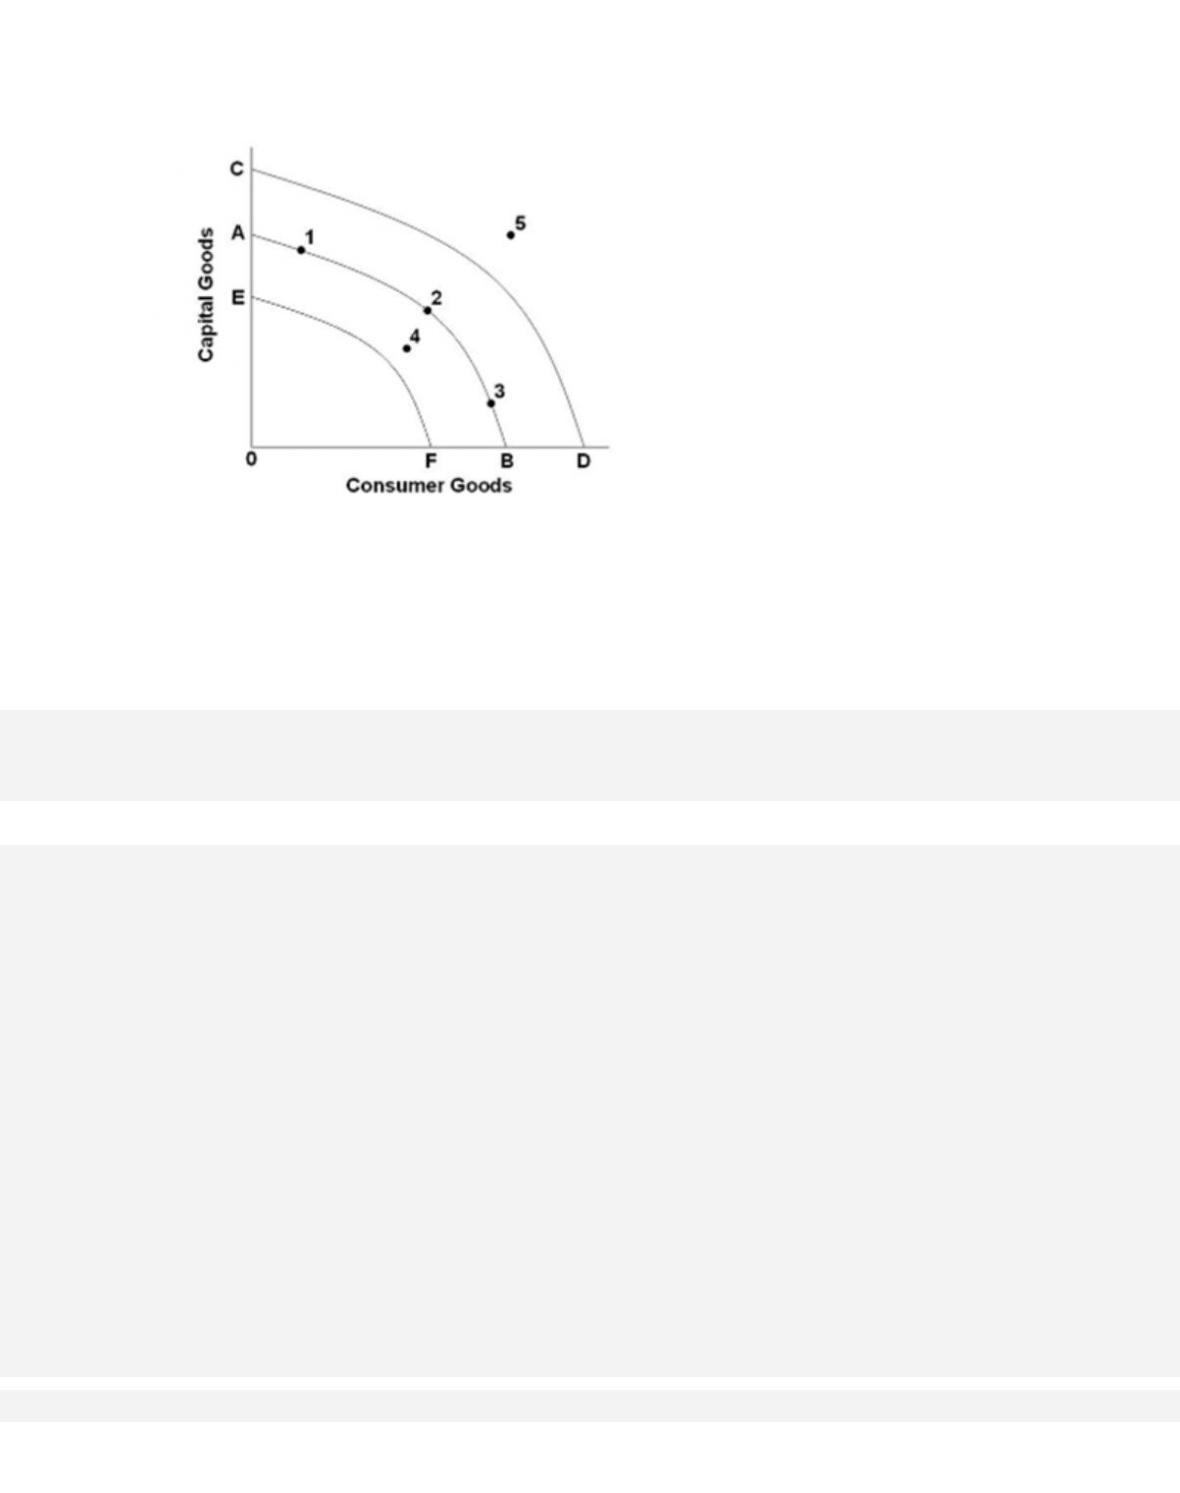
176.
Refer to the accompanying graph. If the production possibilities curve of an economy shifts
from AB to CD, it is most likely caused by which of the following factors?
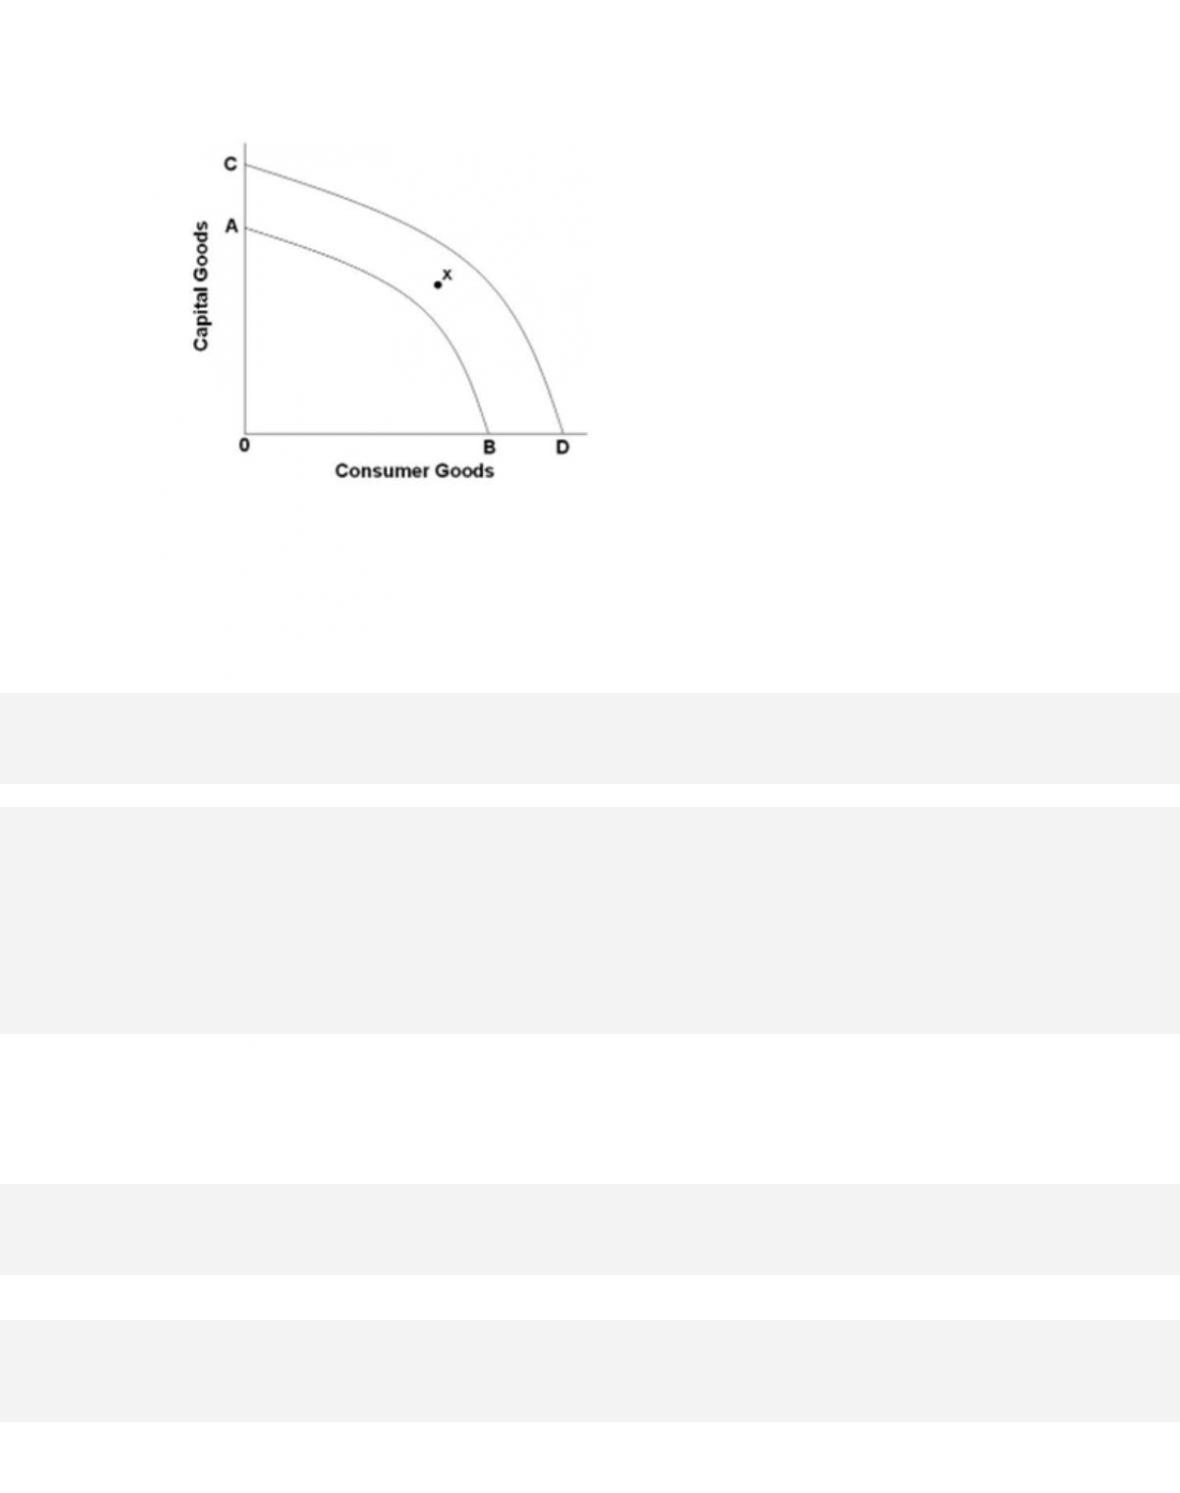
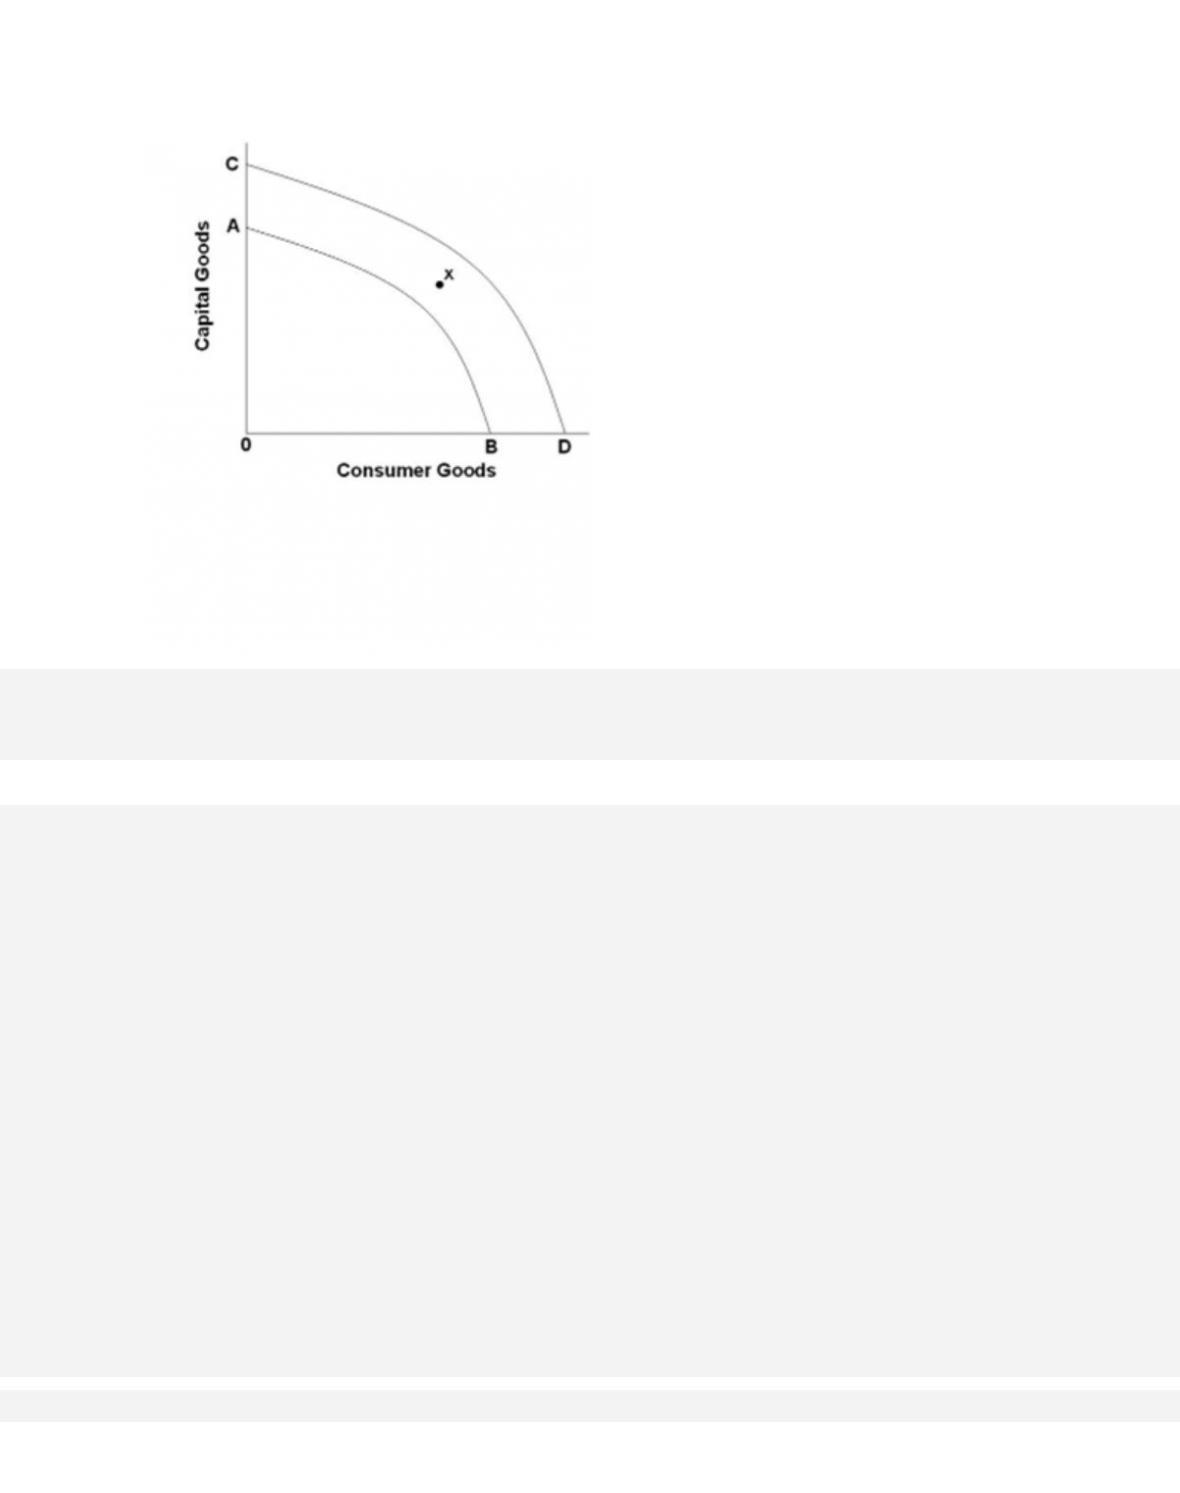
177.
Refer to the accompanying graph. If the production possibilities curve for an economy is at
CD but the economy is operating at point X, the reasons are most likely to be because of
178.
Suppose that an economy is initially operating at a point on its PPC. If it then
experiences an expansion in its production capacity, but its total spending does not rise as
fast as its
capacity, the economy will end up

28–76
Copyright © 2018 McGraw-Hill Education. All rights reserved. No reproduction or distribution without the prior
written consent of McGraw-Hill Education.
Accessibility: Keyboard Navigation
Blooms: Remember
Dif f i c u l ty: 01 Easy
Learning Objective: 28-03 Identify the general supply, demand, and efficiency forces that
give rise to economic growth.
Test Bank: II
Topic: Production Possibilities Analysis
179.
Real GDP, or total output, in any year is equal to
180.
Assume that an economy has 1,500 workers, each working 2,000 hours per year. If the
average real output per worker-hour is $20, then total output, or real GDP, will be
181.
If 40,000 worker-hours produced a total output of $600,000 in an economy, then the
labor productivity is

28–77
Copyright © 2018 McGraw-Hill Education. All rights reserved. No reproduction or distribution without the prior
written consent of McGraw-Hill Education.
A. $10/worker-hour.
B.
$15/worker-hour.
C.
$24/worker-hour.
D.
$240/worker-hour.
AACSB: Knowledge Application
Accessibility: Keyboard Navigation
Blooms: Remember
Dif f i c u l ty: 01 Easy
Learning Objective: 28-03 Identify the general supply, demand, and efficiency forces that
give rise to economic growth.
Test Bank: II
Topic: Production Possibilities Analysis
182.
Society can increase its output and income by increasing basically one or both of two
factors:
183.
A nation’s real GDP will increase by increasing the following, except

28–78
Copyright © 2018 McGraw-Hill Education. All rights reserved. No reproduction or distribution without the prior
written consent of McGraw-Hill Education.
Test Bank: II
Topic: Production Possibilities Analysis
184.
The number of worker-hours available in an economy is determined by the following,
except
185.
Which of the following will not increase the average productivity of labor?
186.
The size of the labor force depends on the size of the working-age population and the

28–79
Copyright © 2018 McGraw-Hill Education. All rights reserved. No reproduction or distribution without the prior
written consent of McGraw-Hill Education.
A c c e s s i b i l i t y : Keyboard Navigation
Blooms: Remember
Dif f i c u l ty: 01 Easy
Learning Objective: 28-03 Identify the general supply, demand, and efficiency forces that
give rise to economic growth.
Test Bank: II
Topic: Production Possibilities Analysis
187.
Year
Quantity of Labor
Productivity of Labor
1
2,000
$200
2
2,000
210
3
2,000
210
The table shows the quantity of labor (measured in hours) and the productivity of labor
(measured in real GDP per hour) in a hypothetical economy in three different years. In Year
2, the economy’s real GDP was
188.
Year
Quantity of Labor
Productivity of Labor
1
2,000
$200
2
2,000
210

3
2,000
210
The table shows the quantity of labor (measured in hours) and the productivity of labor
(measured in real GDP per hour) in a hypothetical economy in three different years.
Between Year 1 and Year 2, real GDP increased by
189.
Year
Quantity of Labor
Productivity of Labor
1
2,000
$200
2
2,000
210
3
2,000
210
The table shows the quantity of labor (measured in hours) and the productivity of labor
(measured in real GDP per hour) in a hypothetical economy in three different years.
Between Year 2 and Year 3, real GDP increased by