
48.
Suppose that an economy‘s labor productivity and total worker-hours each grew by 4
percent between year 1 and year 2. We could conclude that this economy’s
49.
Suppose that an economy’s labor productivity fell by 3 percent and its total worker–
hours remained constant between year 1 and year 2. We could conclude that this economy’s
50.
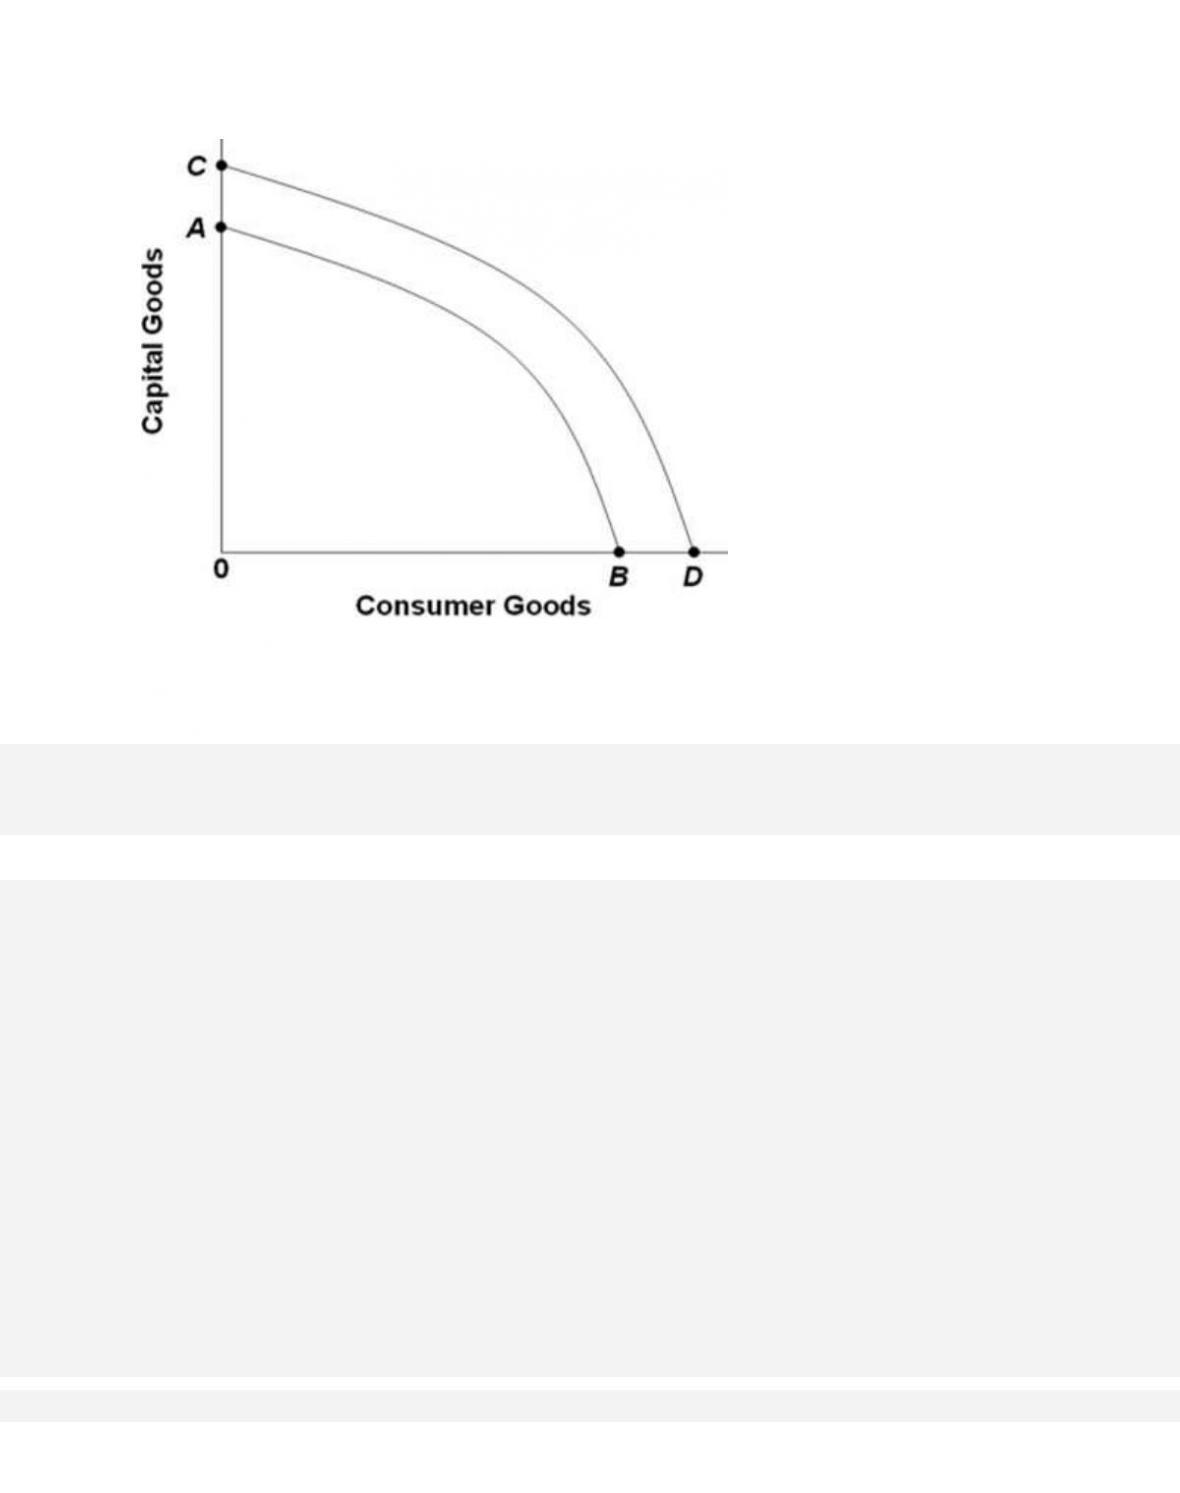
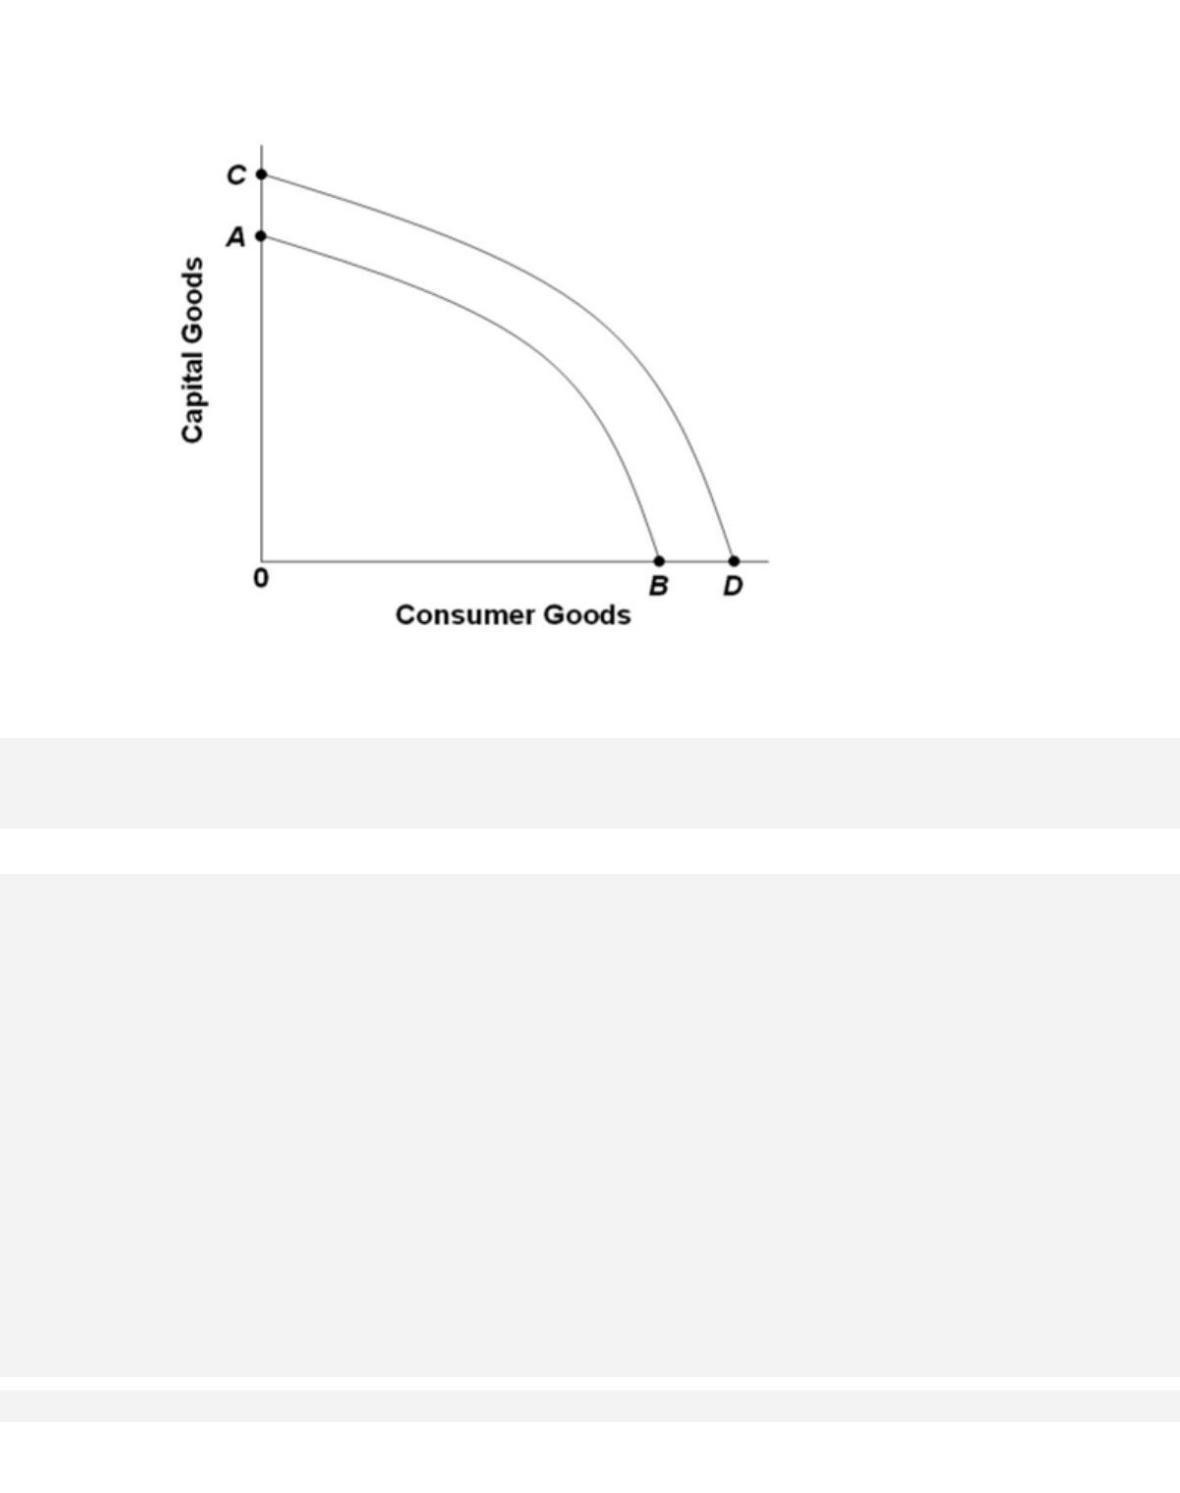
Refer to the graph. Growth of production capacity is shown by the
51.
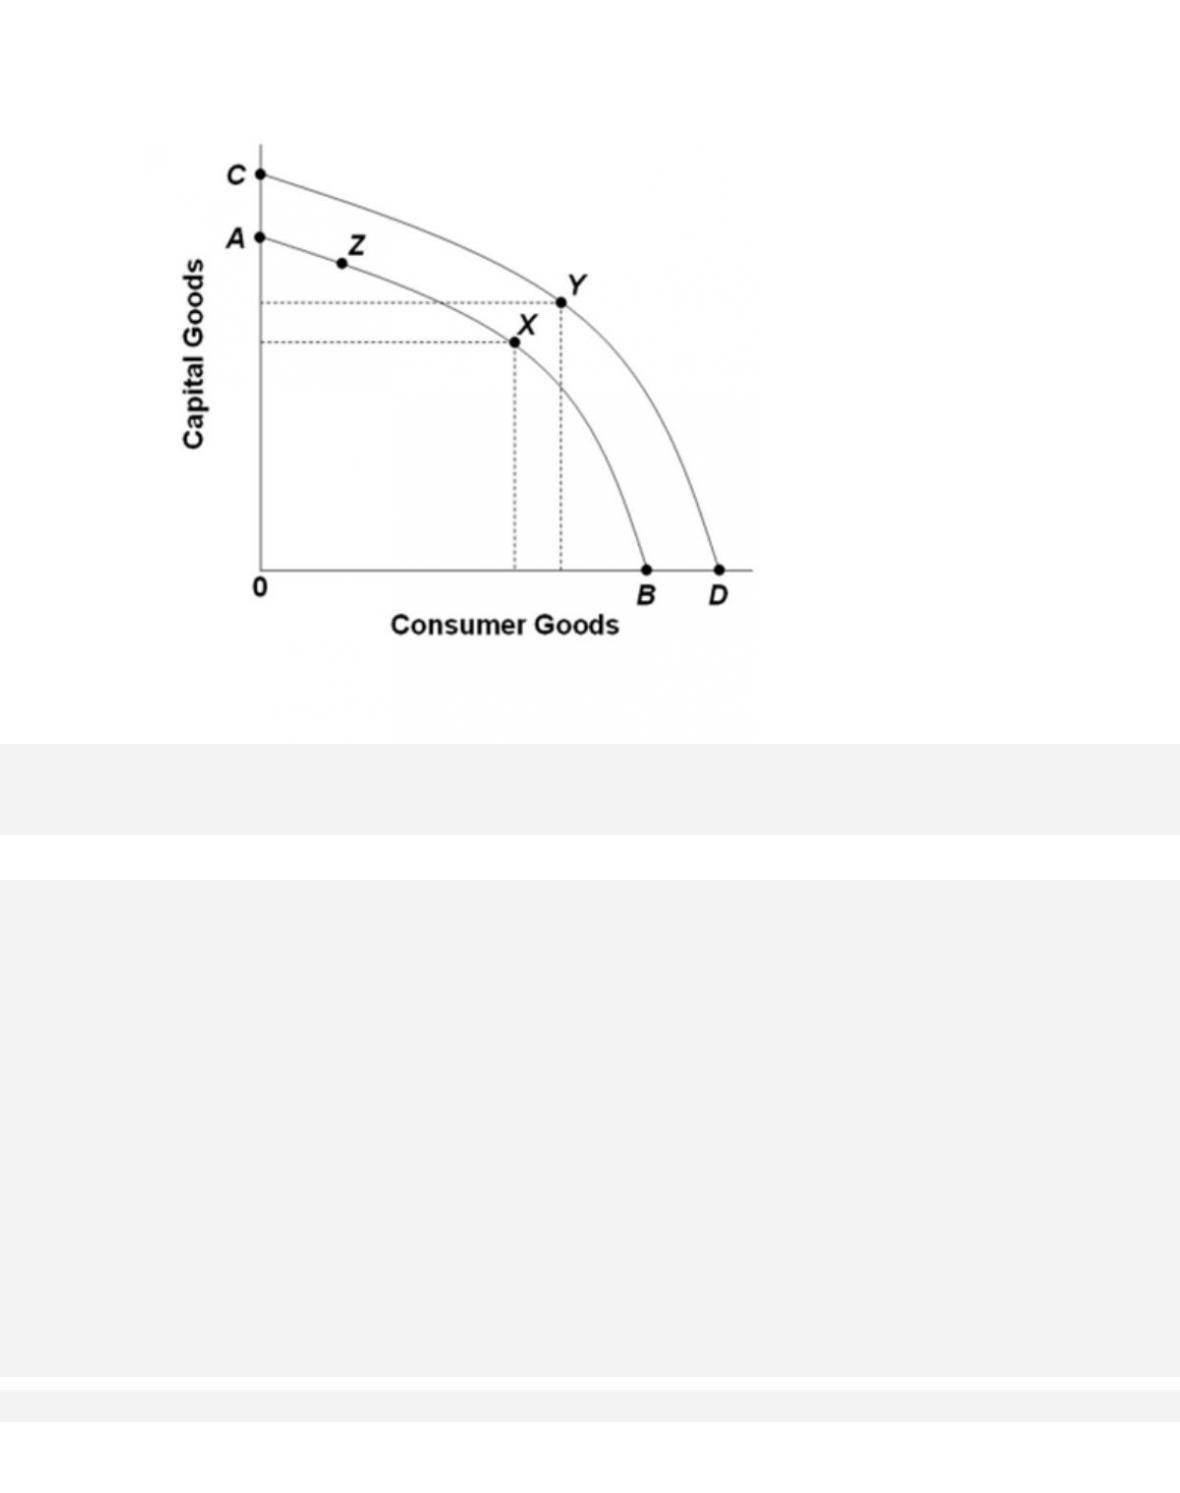
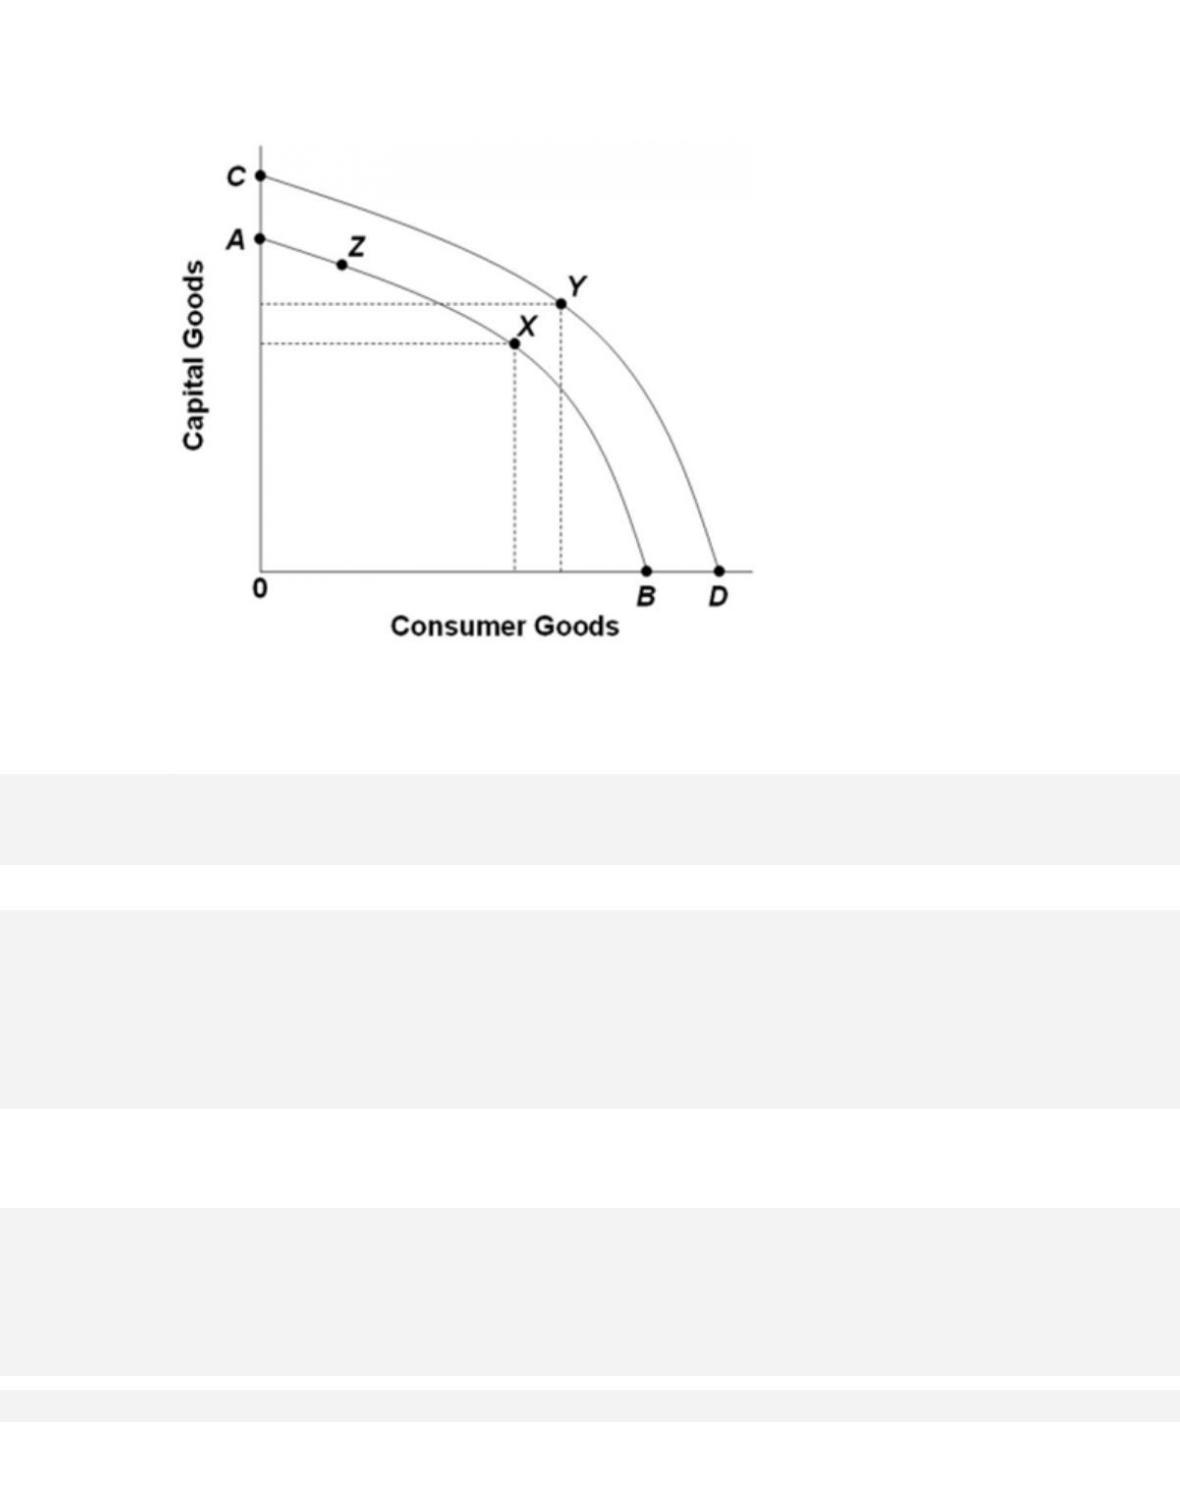
Refer to the graph. An increase in an economy‘s labor productivity would

52.
Refer to the graph. An increase in the economy‘s human capital would
53.
Refer to the diagram. Realized economic growth is best represented by a

54.
Refer to the diagram. The most likely cause of a shift from AB to CD would be a(n)
55.
Refer to the diagram. Increases in the quantity and quality of human resources and capital
are best represented by a
56.
An outward shift of a nation’s production possibilities curve

28–28
57.
Labor productivity is measured by
58.
Labor productivity is defined as
59.
Which of the following is correct?

28–29
Copyright © 2018 McGraw-Hill Education. All rights reserved. No reproduction or distribution without the prior
written consent of McGraw-Hill Education.
A.
Total output = labor productivity/worker-hours.
B.
Labor productivity = worker-hours/total output.
C.
Total output = worker-hours × labor productivity.
D. Worker-hours = labor productivity × total output.
60.
If the number of worker-hours in an economy is 100 and its labor productivity is $5 of
output per worker-hour, the economy’s real GDP
61.
Suppose total output (real GDP) is $4,000 and labor productivity is $8. We can
conclude that

28–30
Copyright © 2018 McGraw-Hill Education. All rights reserved. No reproduction or distribution without the prior
written consent of McGraw-Hill Education.
give rise to economic growth.
Test Bank: I
Topic: Determinants of Growth
62.
Suppose total output (real GDP) is $10,000 and worker-hours are 20,000. We can
conclude that
63.
The percentage of the working-age population in the labor force (= employed +
officially unemployed) is called the
64.
Other things equal, which of the following would decrease the rate of economic growth,
as measured by changes in real GDP?

28–31
Copyright © 2018 McGraw-Hill Education. All rights reserved. No reproduction or distribution without the prior
written consent of McGraw-Hill Education.
D.
a decrease in the labor force participation rate
65.
Other things equal, which of the following would increase the rate of economic growth,
as measured by changes in real GDP?
66.
Which of the following would not be expected to increase labor productivity?

67.
Which of the following statements is correct?
68.
Empirical studies suggest that
69.
Between 2015 and 2026, productivity growth is expected to account for about percent of
the growth of real GDP in the United States.

70.
The largest contributor to increases in the productivity of American labor is
71.
Which of the following statements is correct?

72.
The historical reallocation of labor from agriculture to manufacturing in the United
States has
73.
More than half the growth of real GDP in the United States is caused by
74.
Which of the following is the largest contributor to the growth of labor productivity in
the United States?

28–35
Copyright © 2018 McGraw-Hill Education. All rights reserved. No reproduction or distribution without the prior
written consent of McGraw-Hill Education.
Di f f i cu l t y : 02 Medium
Learning Objective: 28-04 Describe growth accounting and the specific factors
accounting for economic growth in the United States.
Test Bank: I
Topic: Accounting for Growth
75.
A nation’s infrastructure refers to
76.
Economies of scale refers to
77.
Other things equal, if a full-employment economy reallocated a substantial quantity of
its resources to capital goods, we would expect

28–36
Copyright © 2018 McGraw-Hill Education. All rights reserved. No reproduction or distribution without the prior
written consent of McGraw-Hill Education.
B.
future consumption to fall.
C.
a lower rate of growth of real GDP.
D.
labor productivity to rise.
78.
Other things equal, which of the following would increase labor productivity the most?
79.
Human capital refers to

80.
What percentage of the U.S. adult population has at least a high school education (as of
2015)?
81.
What percentage of the U.S. adult population has a college or post-college education (as
of 2015)?
82.
The percentage of U.S. adults with a high school education has

28–38
Copyright © 2018 McGraw-Hill Education. All rights reserved. No reproduction or distribution without the prior
written consent of McGraw-Hill Education.
Blooms: Understand
Di f f i cu l t y : 02 Medium
Learning Objective: 28-04 Describe growth accounting and the specific factors
accounting for economic growth in the United States.
Test Bank: I
Topic: Accounting for Growth
83.
Globally, on average test scores of eighth-grade math and science students, the U.S.
ranks (as of 2011)
84.
If the growth trend of labor productivity is 3 percent per year, the number of years that it
will take for the standard of living to double will be about
85.
If the secular trend of labor productivity rises from 2 percent per year to 4 percent, the
number of years that it will take for the standard of living to double will decline by about

28–39
Copyright © 2018 McGraw-Hill Education. All rights reserved. No reproduction or distribution without the prior
written consent of McGraw-Hill Education.
A.
5.2 years.
B.
10.1 years.
C.
17.5 years.
D. 23.8 years.
86.
The annual growth of U.S. labor productivity
87.
The period in the U.S. economy from 1995 to 2010 is characterized by

28–40
Copyright © 2018 McGraw-Hill Education. All rights reserved. No reproduction or distribution without the prior
written consent of McGraw-Hill Education.
Topic: The Rise in the Average Rate of Productivity Growth
88.
Increases in the value of a product to each user, including existing users, as the total
number of users rises are called
89.
Network effects are
90.
All of the following are sources of increasing returns and economies of scale except