Gross Private Domestic Investment
$1,593
Personal Taxes
1,113
Transfer Payments
1,683
Taxes on Production and Imports
695
Corporate Income Taxes
213
Personal Consumption Expenditures
7,304
Consumption of Fixed Capital
1,393
US Exports
1,059
Dividends
434
Government Purchases
1,973
Net Foreign Factor Income
10
Undistributed Corporate Profits
141
Social Security Contributions
748
US Imports
1,483
Statistical Discrepancy
50
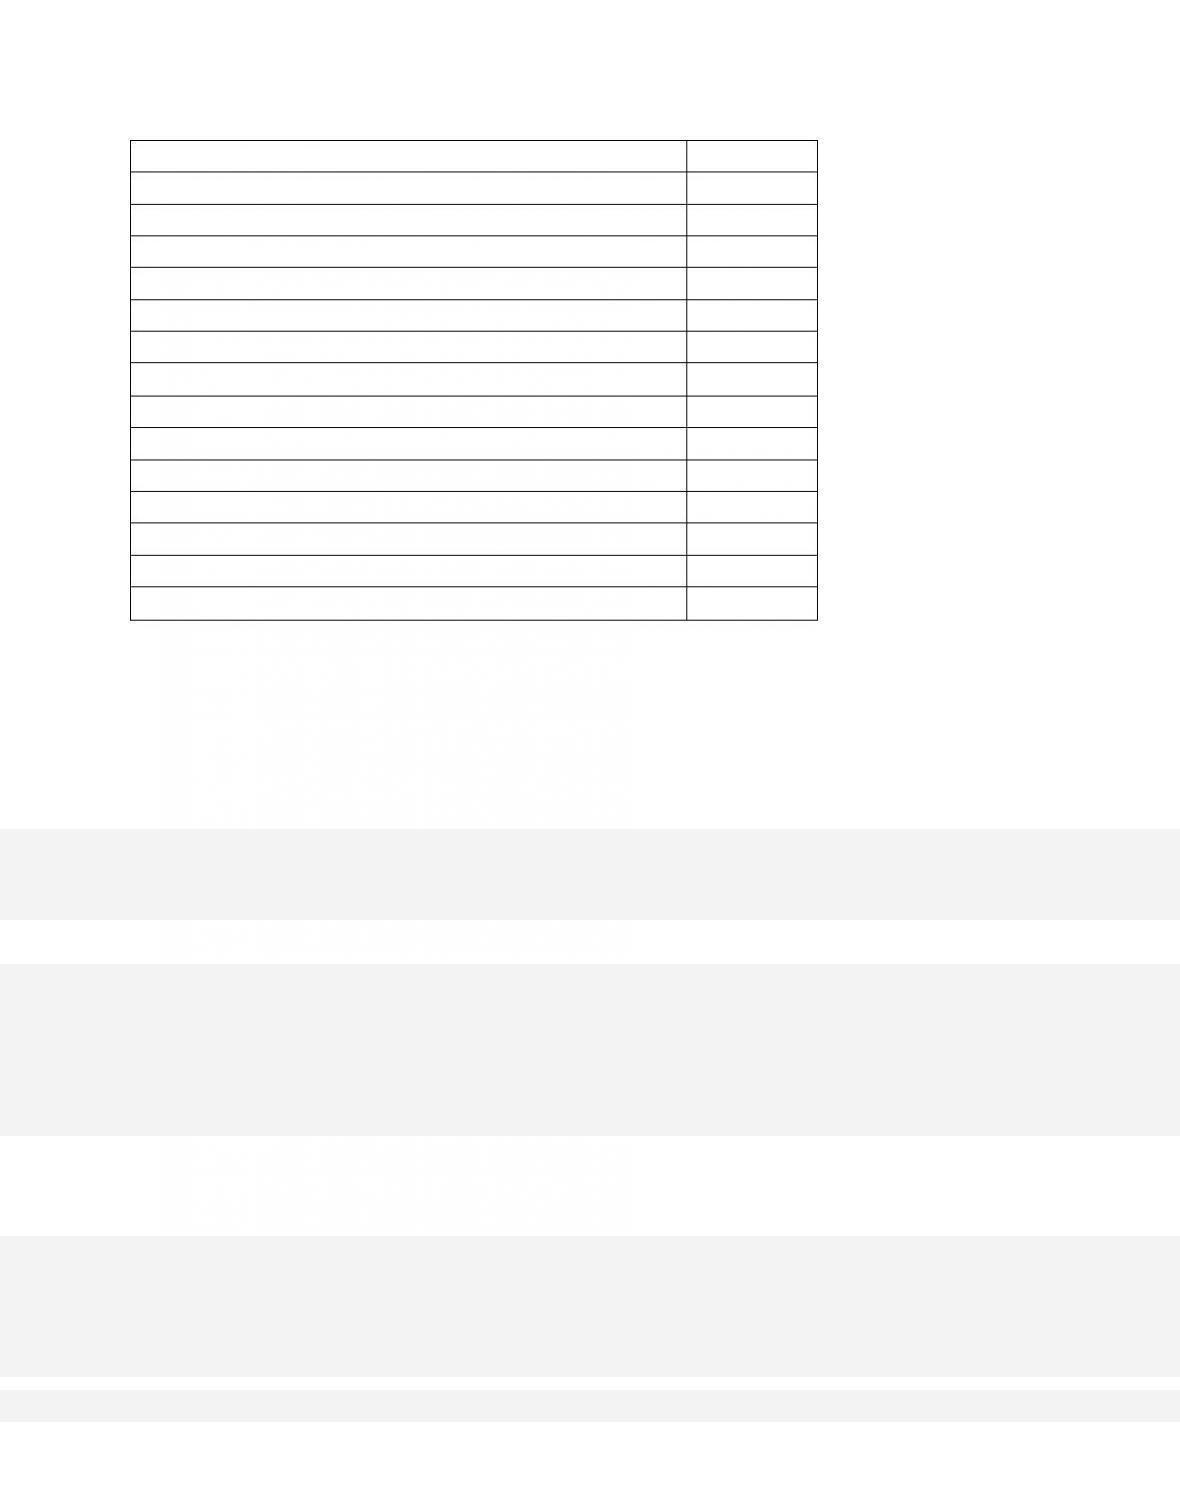
Refer to the accompanying national income data (in billions of dollars). Net private
domestic investment is equal to
255. The following are incomes earned but not received by the nation’s households, except

27-122
256. Which of the following represents an income flow in the circular flow of domestic
output and national income?
257. That portion of corporate profits which is included in personal income is
258. Personal income (PI) refers to all income

259. Personal income will equal disposable income when
260. The total income earned through the use of resources, plus taxes on production and on
imports, equals
27-124
Copyright © 2018 McGraw-Hill Education. All rights reserved. No reproduction or distribution without the prior
written consent of McGraw-Hill Education.
national income, personal income, and disposable income.
Test Bank: II
Topic:
Other National Accounts
261. The amount of new output produced per year for both consumption and additions to
capital stock is measured by
262.
Net Foreign Factor Income
$8
Corporate Profits
47
Gross Private Domestic Investment
73
Proprietors’ Income
46
Dividends
13
Consumption Of Fixed Capital
41
Social Security Contributions
10
US Exports
23
Government Purchases
97
Personal Consumption Expenditures
314
Transfer Payments
27
Imports of the US
24
Personal Taxes
46
Corporate Income Taxes
23
Taxes on Production and Imports
50
Interest
16
Undistributed Corporate Profits
11
Statistical Discrepancy
66
27-125
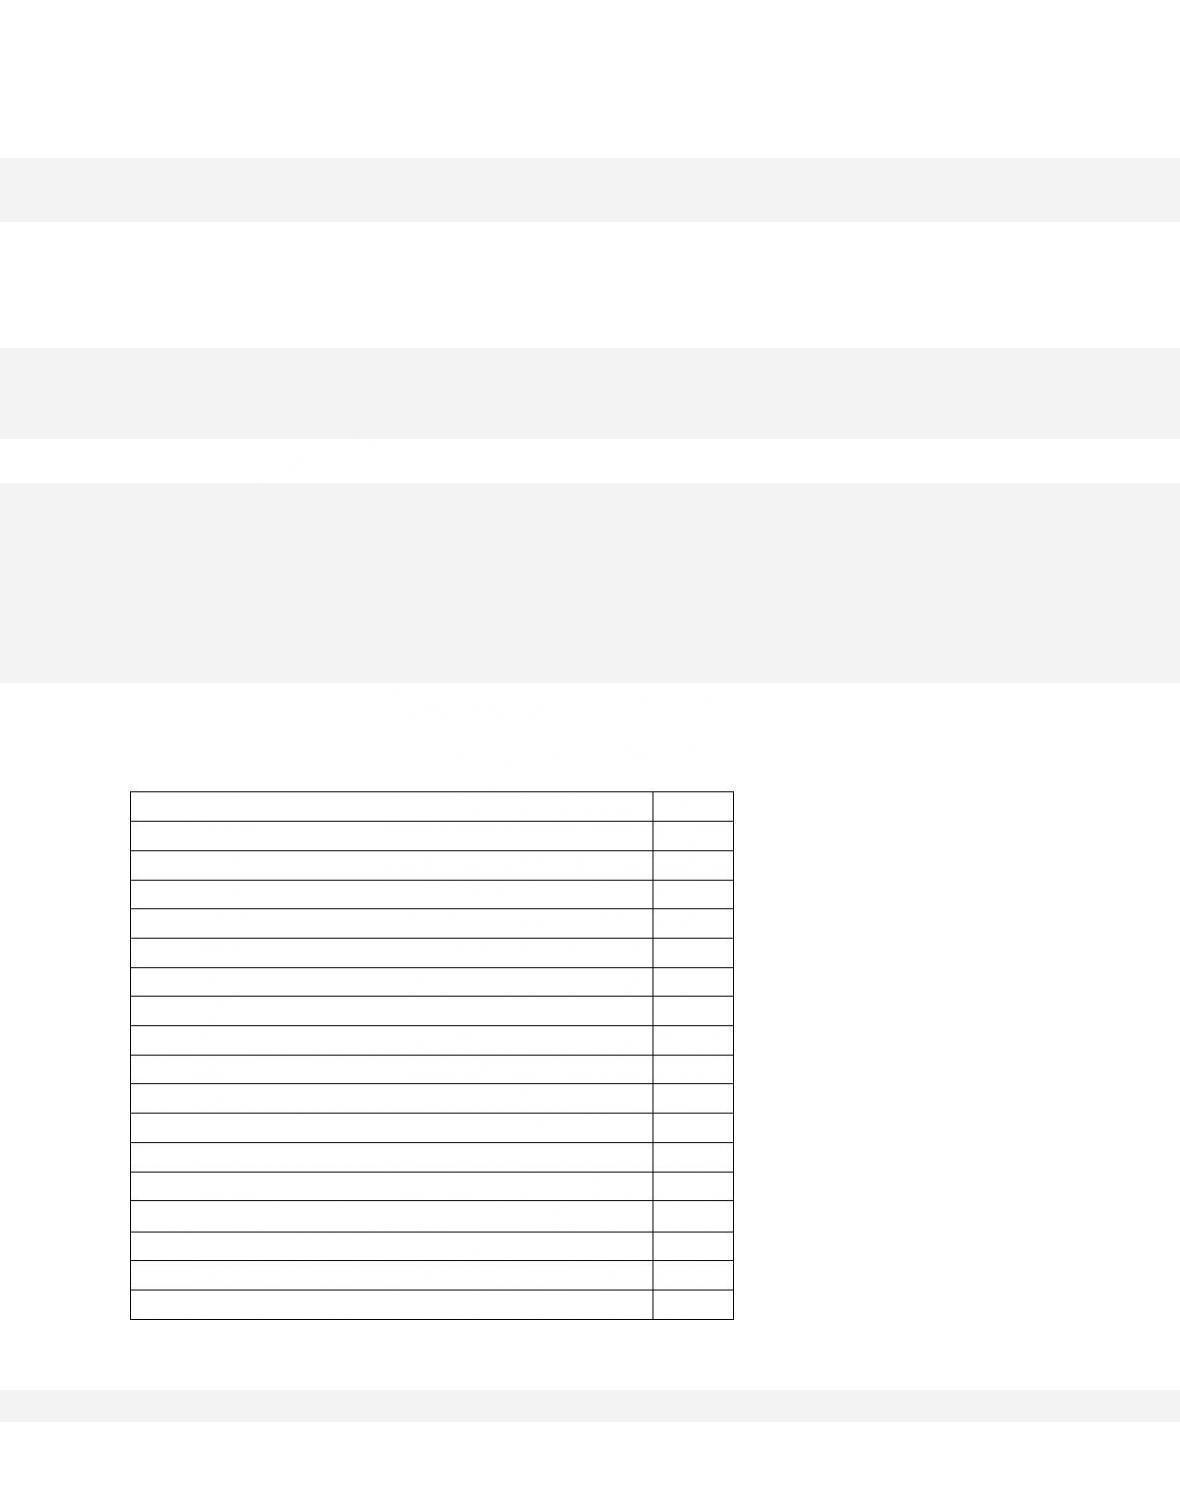
Refer to the accompanying national income statistics (in billions of dollars). Gross
domestic product is
263.
Net Foreign Factor Income
$8
Corporate Profits
47
Gross Private Domestic Investment
73
Proprietors’ Income
46
Dividends
13
Consumption Of Fixed Capital
41
Social Security Contributions
10
US Exports
23
Government Purchases
97
Personal Consumption Expenditures
314
Transfer Payments
27
Imports of the US
24
Personal Taxes
46
Corporate Income Taxes
23
Taxes on Production and Imports
50
Interest
16
Undistributed Corporate Profits
11
Statistical Discrepancy
66
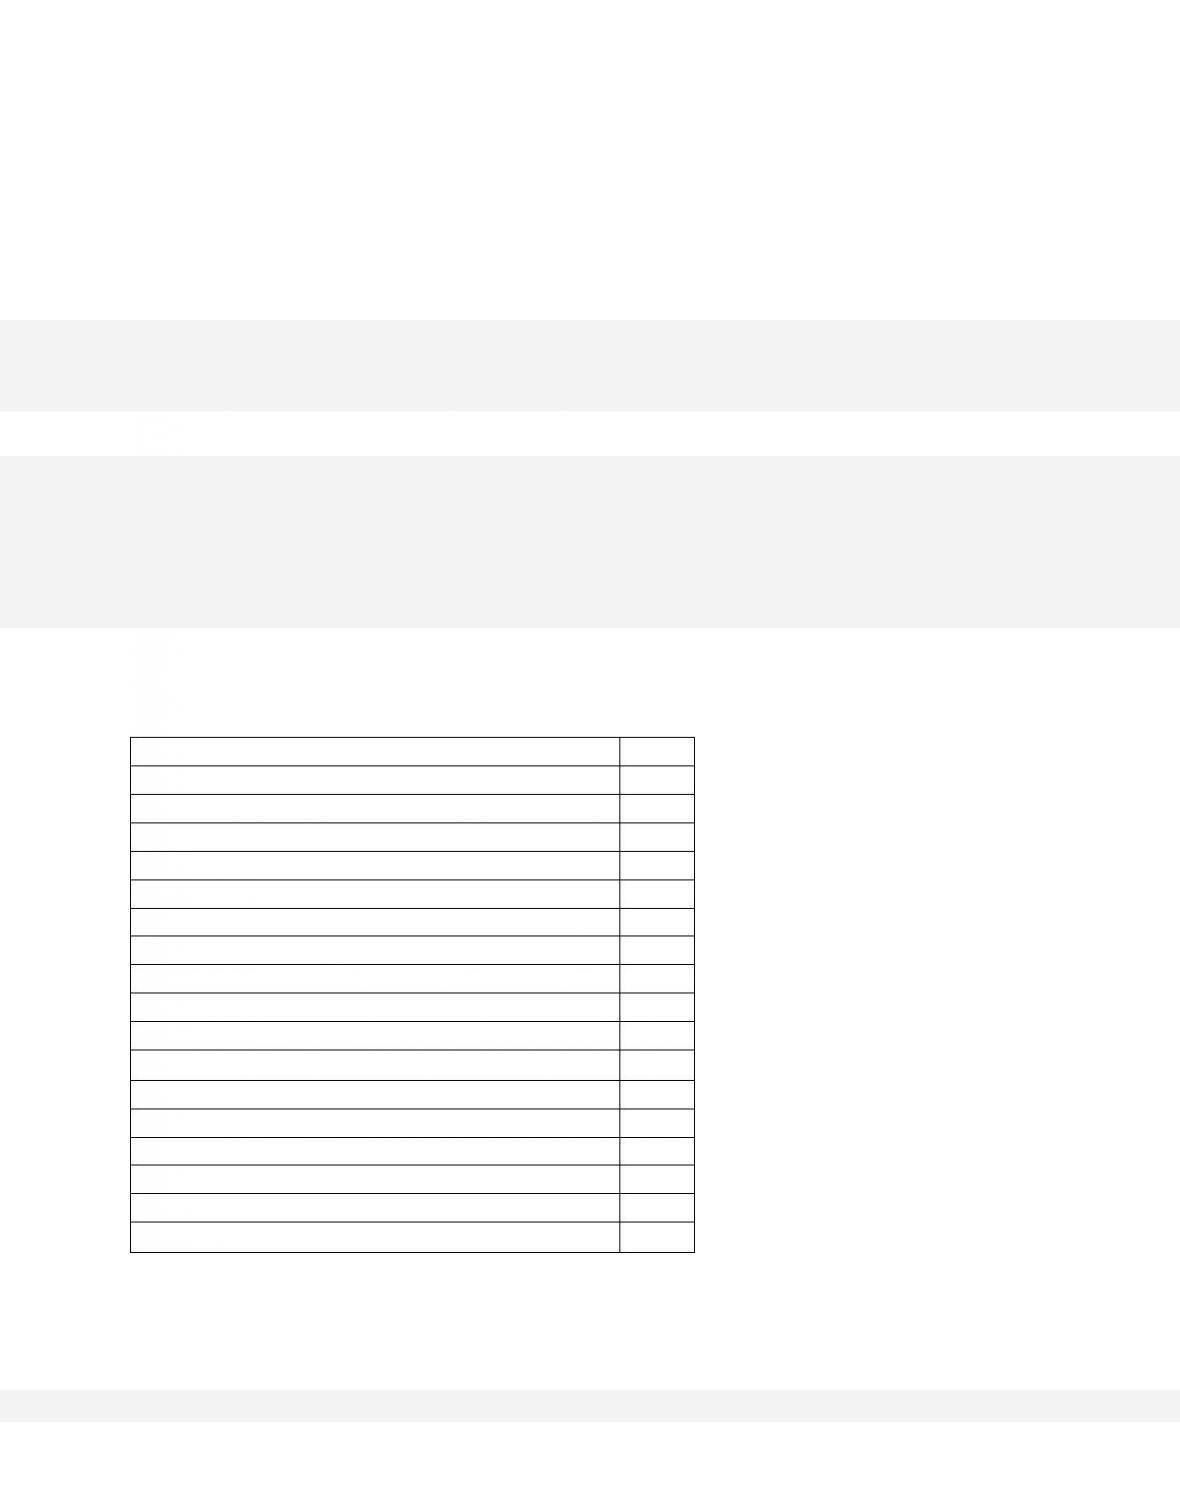
Refer to the accompanying national income statistics (in billions of dollars). Net domestic

27-126
product is
264.
Net Foreign Factor Income
$8
Corporate Profits
47
Gross Private Domestic Investment
73
Proprietors’ Income
46
Dividends
13
Consumption Of Fixed Capital
41
Social Security Contributions
10
US Exports
23
Government Purchases
97
Personal Consumption Expenditures
314
Transfer Payments
27
Imports of the US
24
Personal Taxes
46
Corporate Income Taxes
23
Taxes on Production and Imports
50
Interest
16
Undistributed Corporate Profits
11
Statistical Discrepancy
66
Refer to the accompanying national income statistics (in billions of dollars). National
income is

27-127
Copyright © 2018 McGraw-Hill Education. All rights reserved. No reproduction or distribution without the prior
written consent of McGraw-Hill Education.
A.
$384 billion.
B. $442 billion.
C. $431 billion.
D. $417 billion.
265.
Net Foreign Factor Income
$8
Corporate Profits
47
Gross Private Domestic Investment
73
Proprietors’ Income
46
Dividends
13
Consumption Of Fixed Capital
41
Social Security Contributions
10
US Exports
23
Government Purchases
97
Personal Consumption Expenditures
314
Transfer Payments
27
Imports of the US
24
Personal Taxes
46
Corporate Income Taxes
23
Taxes on Production and Imports
50
Interest
16
Undistributed Corporate Profits
11
Statistical Discrepancy
66
Refer to the accompanying national income statistics (in billions of dollars). Personal
income is

27-128
Copyright © 2018 McGraw-Hill Education. All rights reserved. No reproduction or distribution without the prior
written consent of McGraw-Hill Education.
C. $372 billion.
D.
$317 billion.
266.
Net Foreign Factor Income
$8
Corporate Profits
47
Gross Private Domestic Investment
73
Proprietors’ Income
46
Dividends
13
Consumption Of Fixed Capital
41
Social Security Contributions
10
US Exports
23
Government Purchases
97
Personal Consumption Expenditures
314
Transfer Payments
27
Imports of the US
24
Personal Taxes
46
Corporate Income Taxes
23
Taxes on Production and Imports
50
Interest
16
Undistributed Corporate Profits
11
Statistical Discrepancy
66
Refer to the accompanying national income statistics (in billions of dollars). Disposable
income is

27-129
Copyright © 2018 McGraw-Hill Education. All rights reserved. No reproduction or distribution without the prior
written consent of McGraw-Hill Education.
D. $212 billion.
267. If the price index in year A is 130, this means that
268. The GDP deflator or price index equals
269. “GDP price index” measures changes in the

27-130
Copyright © 2018 McGraw-Hill Education. All rights reserved. No reproduction or distribution without the prior
written consent of McGraw-Hill Education.
A. value of final output produced in the nation.
B.
prices of the output produced in the nation.
C. amount of resources available in the nation.
D. cost of resources employed in the nation.
270.
Year
1
2
3
4
5
6
Price Index
100
95
105
125
125
120
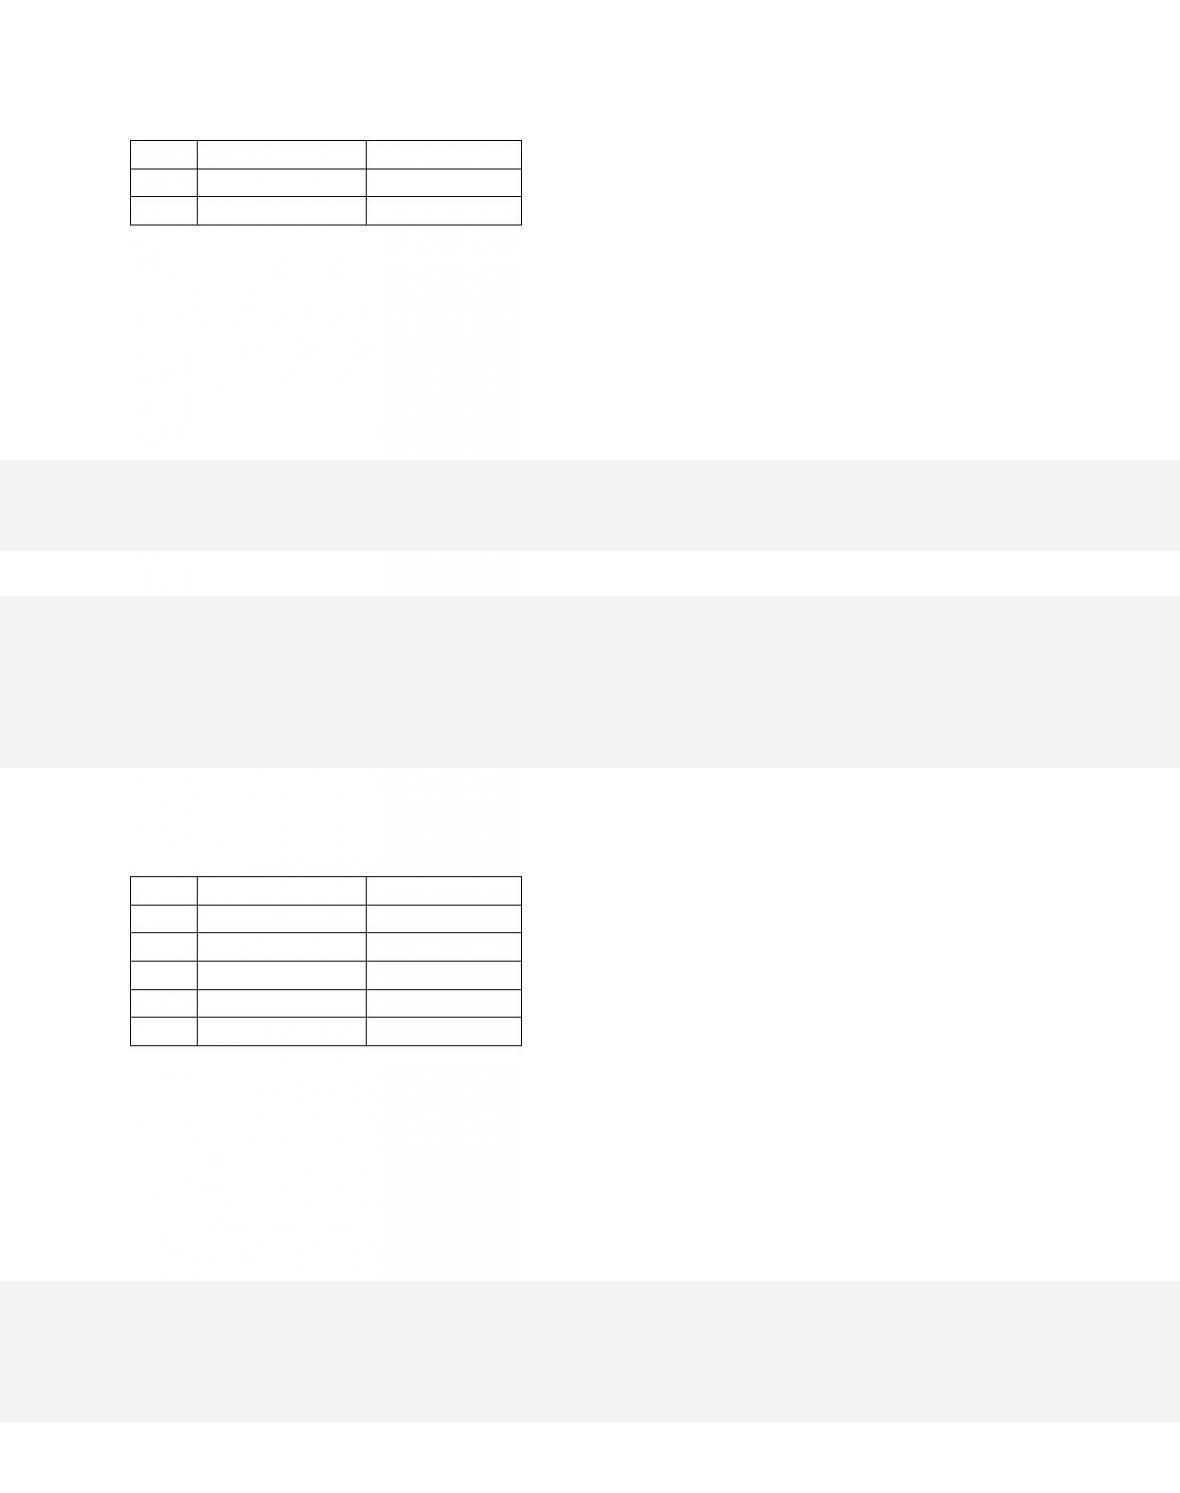
The base year of the price index given in the accompanying table is
271.
Year
1
2
3
4
5
6
Price Index
100
95
105
125
125
120

27-131
Refer to the table. Nominal GDP rises faster than real GDP between years
272.
Year
1
2
3
4
5
6
Price Index
100
95
105
125
125
120
Refer to the table. If output increases by 8 percent from Year 5 to Year 6, then in that
period,
273. Suppose that the base year is 2015, and the GDP price index in 2014 is 92.0. This
implies that the

274. If the price index is rising over a period of time, then the real GDP in years
275. If prices increased, we need to adjust nominal GDP values to give us a measure of
GDP for various years in constant-dollar terms. We refer to that adjustment as

27-133
Copyright © 2018 McGraw-Hill Education. All rights reserved. No reproduction or distribution without the prior
written consent of McGraw-Hill Education.
describe the difference between nominal GDP and real GDP.
Test Bank: II
Topic:
Nominal GDP versus Real GDP
276.
Average Price Per Unit
Product
Quantity
Year 1
Year 2
A
10
$10
$8
B
15
20
22
C
8
50
55
Consumers in an economy buy only three general types of products, A, B, and C. Changes
in the prices of these items over a period are shown in the table. Using year 1 as the base
year, the country‘s price index in year 2 is
277. In an economy, the total expenditures for a market basket of goods in year 1 (the base
year) were $5,000 billion. In year 2, the total expenditure for the same market basket of
goods was $5,500 billion. What was the GDP price index for the economy in year 2?

27-134
Copyright © 2018 McGraw-Hill Education. All rights reserved. No reproduction or distribution without the prior
written consent of McGraw-Hill Education.
Blooms: Understand
Difficulty:
02 Medium
Learning Objective: 27-05 Discuss the nature and function of a GDP price index and
describe the difference between nominal GDP and real GDP.
Test Bank: II
Topic:
Nominal GDP versus Real GDP
278.
Year
Nominal GDP
Real GDP
Price Index
1
5,200
4,800
2
5,500
112
3
5,740
5,000
Refer to the table. (GDP figures are in billions of dollars.) What is the GDP price index in
Year 1?
279.
Year
Nominal GDP
Real GDP
Price Index
1
5,200
4,800
2
5,500
112
3
5,740
5,000

Refer to the table. (GDP figures are in billions of dollars.) What was real GDP in Year 2?
280.
Item
Price Year 1
Price Year 2
Quantity Produced
A
$100
$105
4
B
100
110
2
C
100
95
1
A nation produces three products, A, B, and C. Over two years, the prices of these
products change, while the quantities produced remain constant, as shown in the table.
Over this period, the nation’s nominal GDP increased by
5 percent. The nation’s real GDP
changed by approximately

27-136
Copyright © 2018 McGraw-Hill Education. All rights reserved. No reproduction or distribution without the prior
written consent of McGraw-Hill Education.
Test Bank: II
Topic:
Nominal GDP versus Real GDP
281. GDP measured using current prices is called
282.
Year
Units of Output
Price Per Unit
1
8
$2
2
10
3
3
15
4
4
18
5
5
20
6
The accompanying table gives price and output data over a five-year period for an
economy that produces only one good. If year 2 is the base year, the price index for year 3
is

27-137
Copyright © 2018 McGraw-Hill Education. All rights reserved. No reproduction or distribution without the prior
written consent of McGraw-Hill Education.
Difficu l t y :
02 Medium
Learning Objective: 27-05 Discuss the nature and function of a GDP price index and
describe the difference between nominal GDP and real GDP.
Test Bank: II
Topic:
Nominal GDP versus Real GDP
283.
Year
Units of Output
Price Per Unit
1
8
$2
2
10
3
3
15
4
4
18
5
5
20
6
The accompanying table gives price and output data over a five-year period for an
economy that produces only one good. Assume that year 2 is the base year. In year 4,
nominal GDP would be
284.
Year
Units of Output
Price Per Unit
1
8
$2
2
10
3
3
15
4
4
18
5
5
20
6
The accompanying table gives price and output data over a five-year period for an
economy that produces only one good. If year 2 is the base year, then Real GDP in year 5
is
285.
Year
Units of Output
Price Per Unit
1
8
$2
2
10
3
3
15
4
4
18
5
5
20
6
The accompanying table gives price and output data over a five-year period for an
economy that produces only one good. If year 2 is the base year, then the percentage
increase in real GDP from year 2 to year 4 is

27-139
Copyright © 2018 McGraw-Hill Education. All rights reserved. No reproduction or distribution without the prior
written consent of McGraw-Hill Education.
D. 100 percent.
286.
Year
Units of Output
Price Per Unit
1
8
$2
2
10
3
3
15
4
4
18
5
5
20
6
The accompanying table gives price and output data over a five-year period for an
economy that produces only one good. Assume that year 2 is the base year. For the years
shown, the growth of
287.
Year
Nominal GDP
Price Index

1
$35
90
2
40
100
3
45
110
4
48
120
5
56
140
Consider the accompanying data for a nation. The country‘s real GDP declined between
years
288. Nominal GDP is less than real GDP in an economy in both year 1 and year 2. In year
3, nominal GDP is equal to real GDP. In year 4, nominal GDP is slightly greater than real
GDP. In year 5, nominal GDP is significantly greater than real GDP. Which year is the
base year being used to calculate the price index for this economy?