
27–61
Year
Units of Output
Price Per Unit
1
3
$3
2
4
4
3
6
5
4
7
7
5
8
8
Assume an economy that makes only one product and that year 3 is the base year. Output
and price data for a five-year period are shown in the table. In determining real GDP, the
nominal GDP for
121.
Year
Units of Output
Price Per Unit
1
3
$3
2
4
4
3
6
5
4
7
7
5
8
8
Assume an economy that makes only one product and that year 3 is the base year. Output
and price data for a five-year period are shown in the table. For the years shown, the
growth of

122. If nominal GDP rises,
123. Real GDP is

27–63
Copyright © 2018 McGraw-Hill Education. All rights reserved. No reproduction or distribution without the prior
written consent of McGraw-Hill Education.
Diff icu lty :
02 Medium
Learning Objective: 27-05 Discuss the nature and function of a GDP price index and
describe the difference between nominal GDP and real GDP.
Test Bank: I
Topic:
Nominal GDP versus Real GDP
124. In comparing GDP data over a period of years, a difference between nominal and real
GDP may arise because
125. Only three goods are produced in an economy in the following amounts: A = 10, B =
30, C = 5. The current year per-unit prices of these three goods are A = $2, B = $3, and C
= $1. Nominal GDP in the current year is
126. (Advanced analysis) Only three goods are produced in an economy in the following
amounts: A = 10, B = 30, C = 5. The current year per-unit prices of these three goods are A
= $2, B = $3, and C = $1. If the per-unit prices of the three goods were each $1 in a base

27–64
year used to construct a GDP price index, then the GDP price index in the current year is
127. (Advanced analysis) Only three goods are produced in an economy in the following
amounts: A = 10, B = 30, C = 5. The current year per-unit prices of these three goods are A
= $2, B = $3, and C = $1. If the per-unit prices of the three goods were each $1 in a base
year used to construct a GDP price index, then real GDP in the current year is
128.
Year
Units of Output
Price Per Unit
1
20
$4
2
25
4
3
30
6

Assume an economy that is producing only one product. Output and price data for a three-
year period are shown in the table. If year 2 is chosen as the base year, the price index for
year 1 is
129.
Year
Units of Output
Price Per Unit
1
20
$4
2
25
4
3
30
6
Assume an economy that is producing only one product. Output and price data for a three–
year period are shown in the table. The nominal GDP for year 3 is

27–66
Copyright © 2018 McGraw-Hill Education. All rights reserved. No reproduction or distribution without the prior
written consent of McGraw-Hill Education.
Type: Table
130.
Year
Units of Output
Price Per Unit
1
20
$4
2
25
4
3
30
6
Assume an economy that is producing only one product. Output and price data for a three–
year period are shown in the table. If year 2 is chosen as the base year, real GDP for year 1
is
131.
Year
Units of Output
Price Per Unit
1
20
$4
2
25
4
3
30
6
Assume an economy that is producing only one product. Output and price data for a three–
year period are shown in the table. If year 2 is chosen for the base year, in year 3 nominal
GDP and real GDP, respectively, are

132.
Year
Units of Output
Price Per Unit
1
20
$4
2
25
4
3
30
6
Assume an economy that is producing only one product. Output and price data for a three-
year period are shown in the table. If year 2 is chosen as the base year, in years 1 and 3 the
price index values are

27–68
Copyright © 2018 McGraw-Hill Education. All rights reserved. No reproduction or distribution without the prior
written consent of McGraw-Hill Education.
Type: Table
133.
Year
Nominal GDP
Price Index
1
$550
$140
2
560
135
3
576
120
4
586
117
5
604
108
The economy described in the table has experienced a
134.
Year
Nominal GDP
Price Index
1
$550
$140
2
560
135
3
576
120
4
586
117
5
604
108
In the economy described in the table,

135.
Year
Nominal GDP
Price Index
1
$550
$140
2
560
135
3
576
120
4
586
117
5
604
108
In the economy described in the table, real GDP for year 3 is

27–70
Copyright © 2018 McGraw-Hill Education. All rights reserved. No reproduction or distribution without the prior
written consent of McGraw-Hill Education.
Type: Table
136. Assume that in 2002 the nominal GDP was $350 billion and in 2003 it was $375
billion. On the basis of this information, we
137. If nominal GDP in some year is $280 and real GDP is $160, then the GDP price index
for that year is
138. If real disposable income fell during a particular year, we can conclude that
27–71
Copyright © 2018 McGraw-Hill Education. All rights reserved. No reproduction or distribution without the prior
written consent of McGraw-Hill Education.
AACSB: Knowledge Application
A c c e s s i b i l i t y :
Keyboard Navigation
Blooms: Understand
Diffi cult y:
02 Medium
Learning Objective: 27-05 Discuss the nature and function of a GDP price index and
describe the difference between nominal GDP and real GDP.
Test Bank: I
Topic:
Nominal GDP versus Real GDP
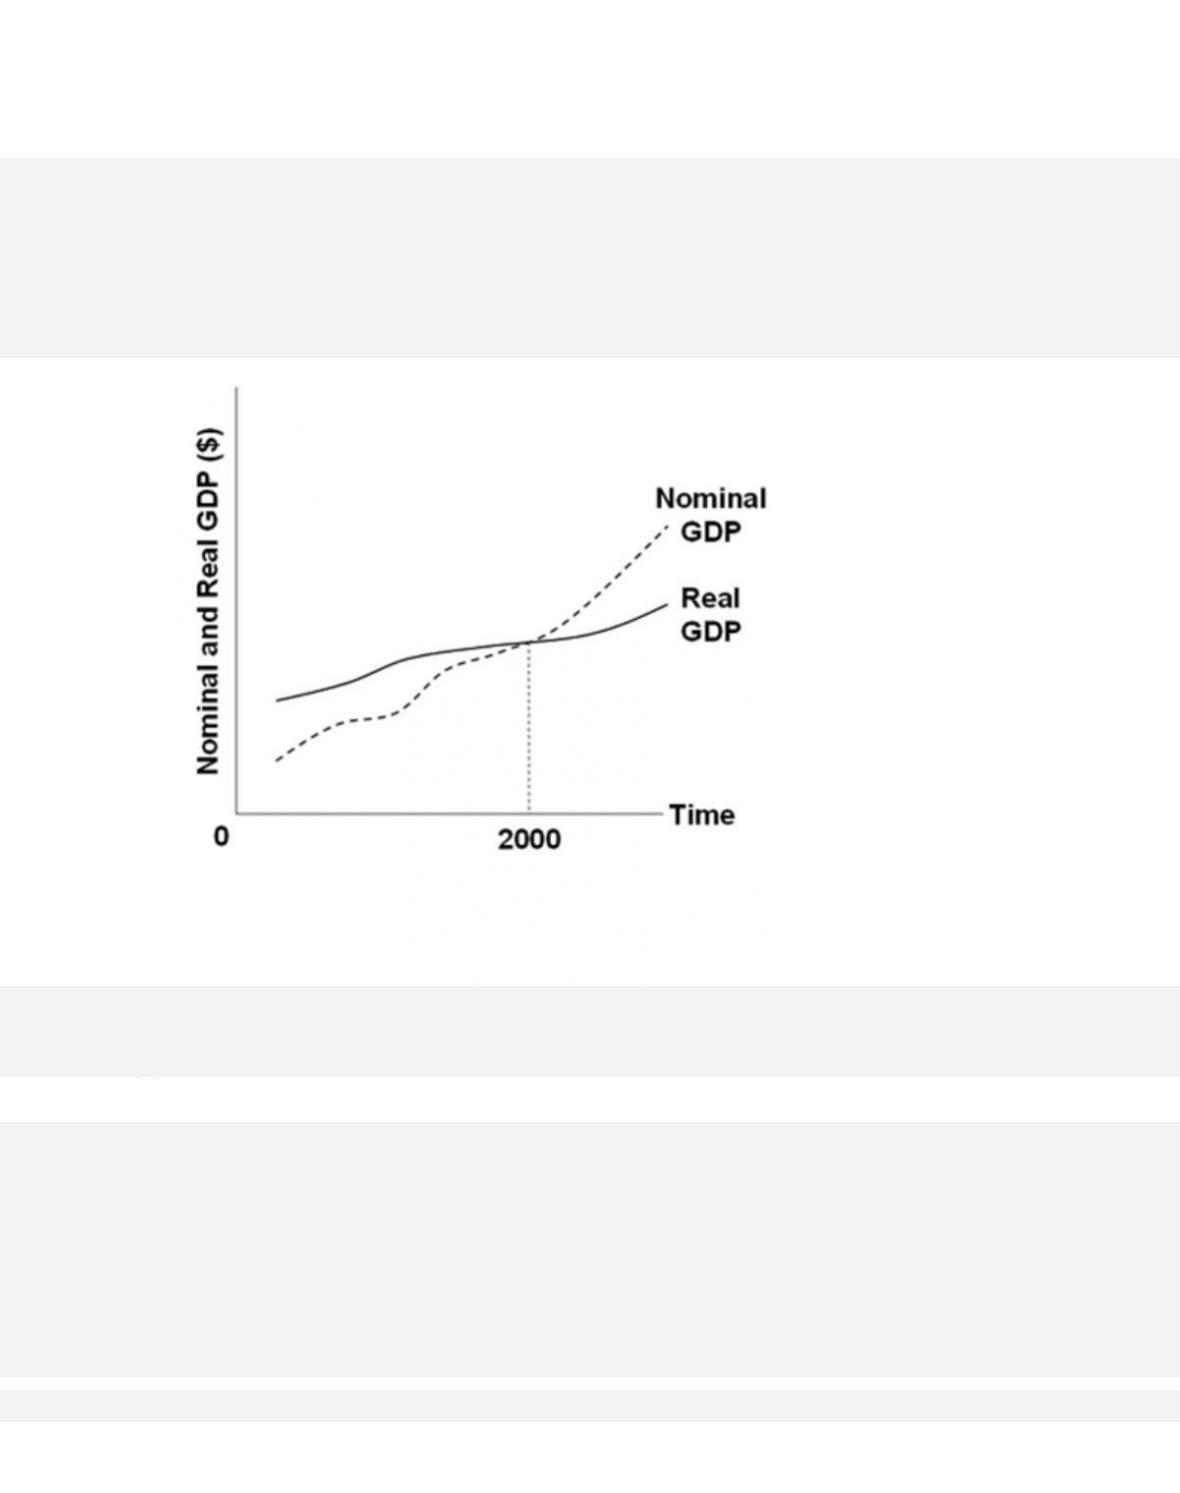
139.
Refer to the diagram. The base year used in determining the price indices for this economy
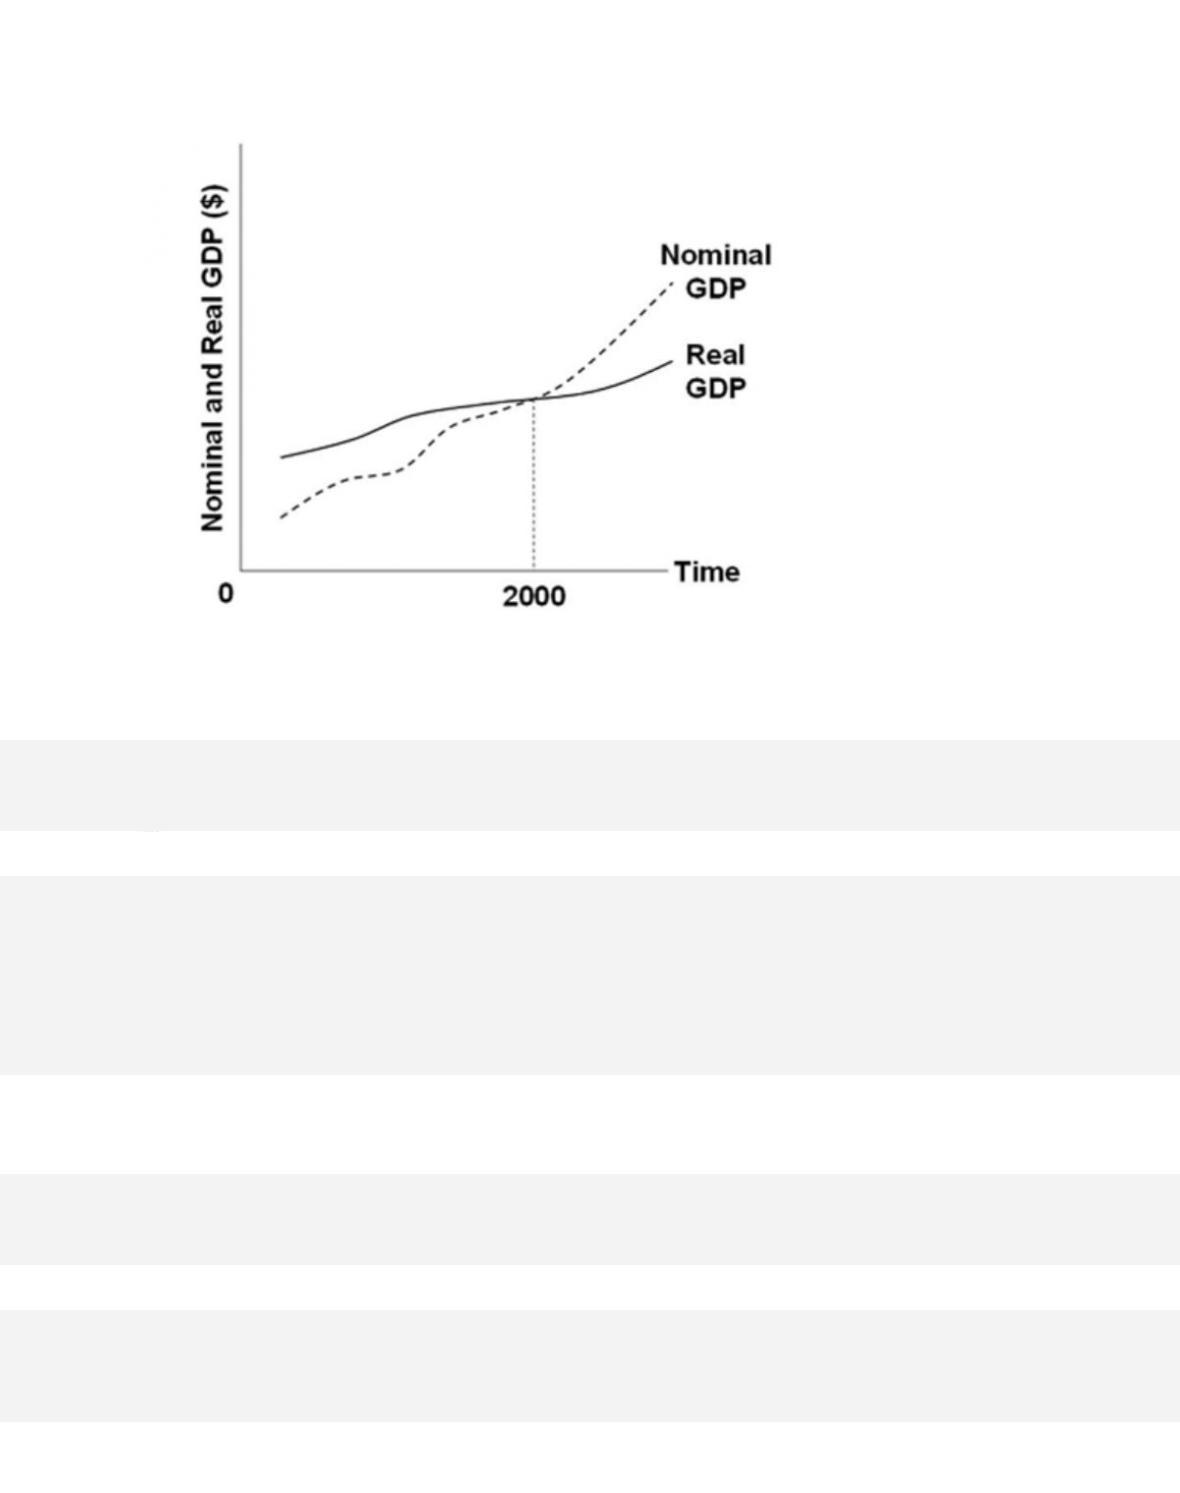
140.
Refer to the diagram. Which of the following statements is correct?
141. In an economy experiencing a persistently falling price level,

27–73
Copyright © 2018 McGraw-Hill Education. All rights reserved. No reproduction or distribution without the prior
written consent of McGraw-Hill Education.
Blooms: Understand
Diffi cult y:
02 Medium
Learning Objective: 27-05 Discuss the nature and function of a GDP price index and
describe the difference between nominal GDP and real GDP.
Test Bank: I
Topic:
Nominal GDP versus Real GDP
142. If real GDP rises and the GDP price index has increased,
143. In determining real GDP, economists adjust the nominal GDP by using the
144. The fact that nominal GDP has risen faster than real GDP

27–74
Copyright © 2018 McGraw-Hill Education. All rights reserved. No reproduction or distribution without the prior
written consent of McGraw-Hill Education.
C. suggests that the general price level has fallen.
D.
suggests that the general price level has risen.
145. Which of the following activities is excluded from GDP, causing GDP to understate a
nation’s well-being?
146. Which of the following activities is excluded from GDP, causing GDP to understate a
nation’s production?

147. A large underground economy results in an
148. The GDP tends to
149. GDP excludes

27–76
Copyright © 2018 McGraw-Hill Education. All rights reserved. No reproduction or distribution without the prior
written consent of McGraw-Hill Education.
Learning Objective: 27-06 List and explain some limitations of the GDP measure.
Test Bank: I
Topic:
Shortcomings of GDP
150. The growth of GDP may understate changes in the economy’s economic well-being
over time if the
151. Environmental pollution is accounted for in
152. Assume that the size of the underground economy increases both absolutely and
relatively over time. As a result,

27–77
Copyright © 2018 McGraw-Hill Education. All rights reserved. No reproduction or distribution without the prior
written consent of McGraw-Hill Education.
A c c e s s i b i l i t y :
Keyboard Navigation
Blooms: Remember
Di f fi c u lt y :
01 Easy
Learning Objective: 27-06 List and explain some limitations of the GDP measure.
Test Bank: I
Topic:
Shortcomings of GDP
153. Gross output (GO)
154. Gross output (GO) and GDP both measure
155. Gross output (GO) for an economy in a given year

27–78
Copyright © 2018 McGraw-Hill Education. All rights reserved. No reproduction or distribution without the prior
written consent of McGraw-Hill Education.
AACSB: Knowledge Application
A c c e s s i b i l i t y :
Keyboard Navigation
Blooms: Remember
Di f f i cu l t y :
01 Easy
Learning Objective: 27-06 List and explain some limitations of the GDP measure.
Test Bank: I
Topic:
Shortcomings of GDP
156. During the 2007–2009 recession,
157.
Answer this question on the basis of the given information for an economy in 2016.
Dollar value of resource extraction activity = $20 billion
Dollar value of production activity = $50 billion
Dollar value of distribution activity = $80 billion
Dollar value of final output = $110 billion
Gross output for this economy in 2016 equals

158.
Answer this question on the basis of the given information for an economy in 2016.
Dollar value of resource extraction activity = $20 billion
Dollar value of production activity = $50 billion
Dollar value of distribution activity = $80 billion
Dollar value of final output = $110 billion
Suppose that in 2017, the dollar value of distribution activity fell to $70 billion, but the
other values remained the same. Based on this, we could conclude that from 2016 to 2017,
159. (Consider This) When making a capital stock and reservoir analogy, the
160. (Consider This) When making a capital stock and reservoir analogy, the

161. (Consider This) Capital is a
162. (Last Word) The U.S. government agency responsible for compiling the national
income accounts is the
163. (Last Word) Which of the following is a source of data for the consumption