27–21
Copyright © 2018 McGraw-Hill Education. All rights reserved. No reproduction or distribution without the prior
written consent of McGraw-Hill Education.
summed to determine GDP.
Test Bank: I
Topic:
The Expenditures Approach
53. The value of U.S. imports is
54. In the treatment of U.S. exports and imports, national income accountants
55. In calculating the GDP, national income accountants

27–22
Copyright © 2018 McGraw-Hill Education. All rights reserved. No reproduction or distribution without the prior
written consent of McGraw-Hill Education.
D.
add increases in inventories or subtract decreases in inventories.
56. The ZZZ Corporation issued $25 million in new common stock in 2016. It used $18
million of the proceeds to replace obsolete equipment in its factory and $7 million to repay
bank loans. As a result, investment
57. In 2012, Trailblazer Bicycle Company produced a mountain bike that was delivered to
a retail outlet in November 2012. The bicycle was sold to E.Z. Ryder in March 2013. This
bicycle is counted as

27–23
Copyright © 2018 McGraw-Hill Education. All rights reserved. No reproduction or distribution without the prior
written consent of McGraw-Hill Education.
Test Bank: I
Topic:
The Expenditures Approach
58.
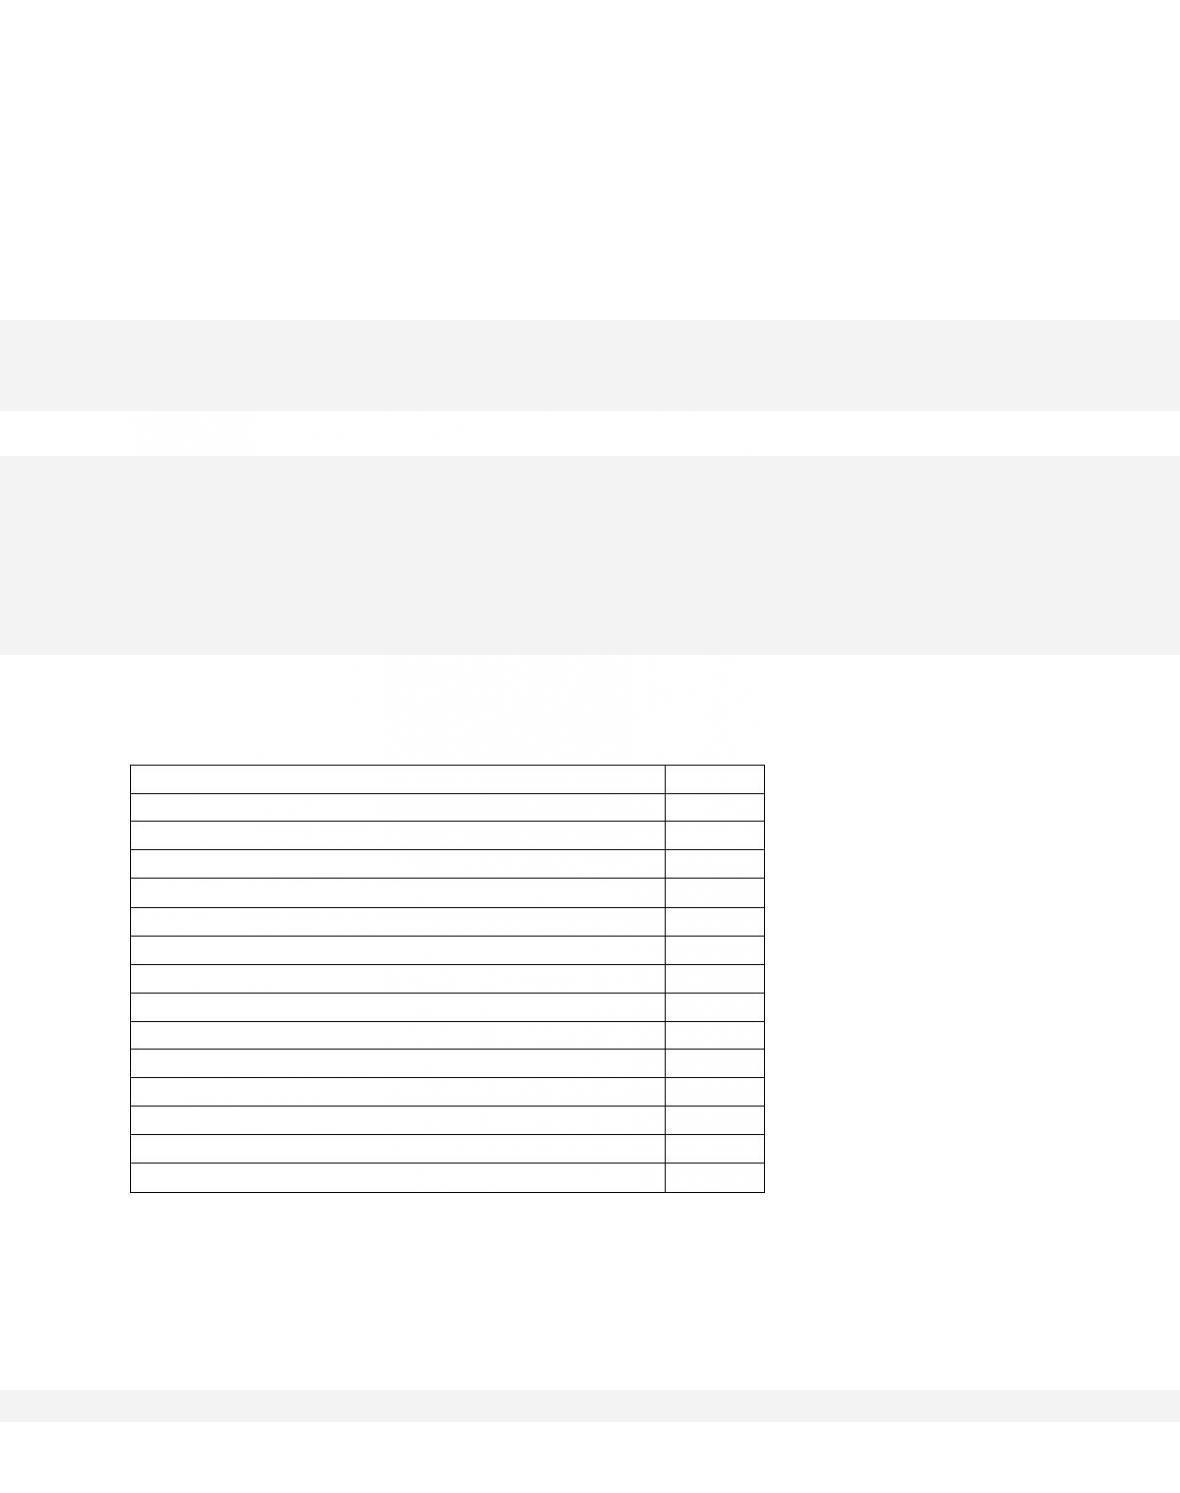
Government Purchases
$15
Consumption
90
Gross Investment
20
Consumption of Fixed Capital
5
Exports
8
Imports
12
Refer to the accompanying data (all figures in billions of dollars). GDP is
59.
Government Purchases
$15
Consumption
90
Gross Investment
20
Consumption of Fixed Capital
5
Exports
8
Imports
12
Refer to the accompanying data (all figures in billions of dollars). NDP (net domestic
product) is
60.
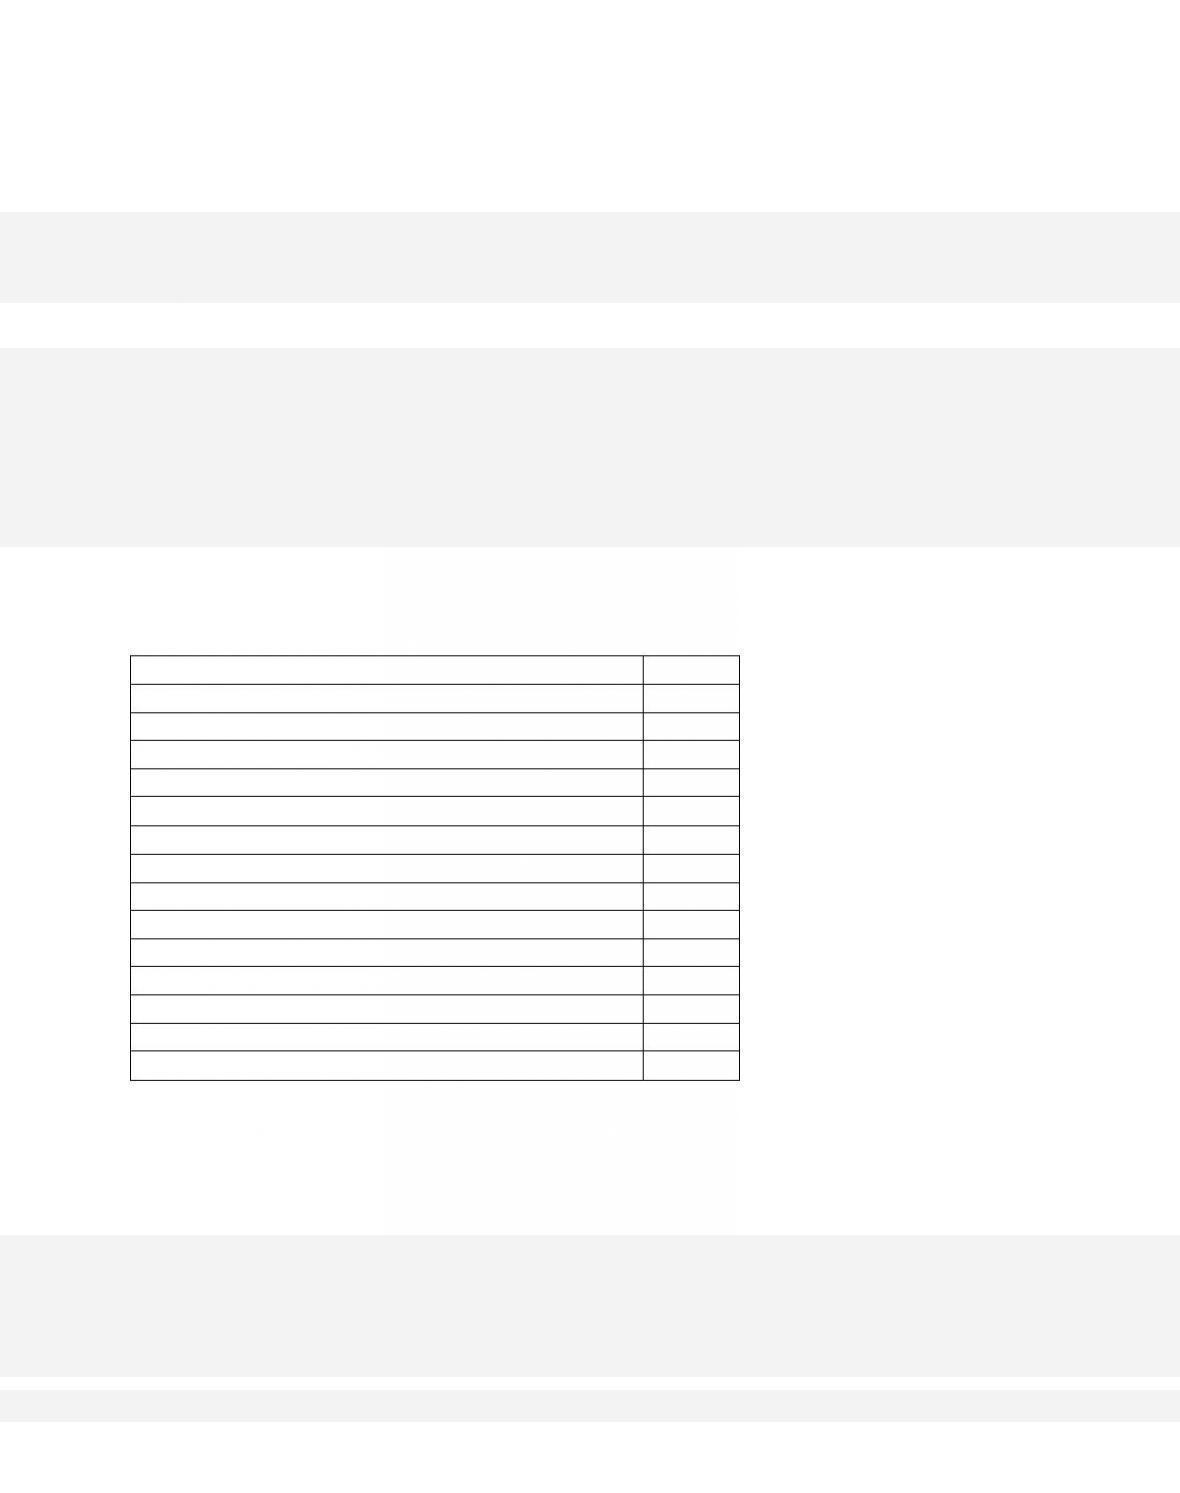
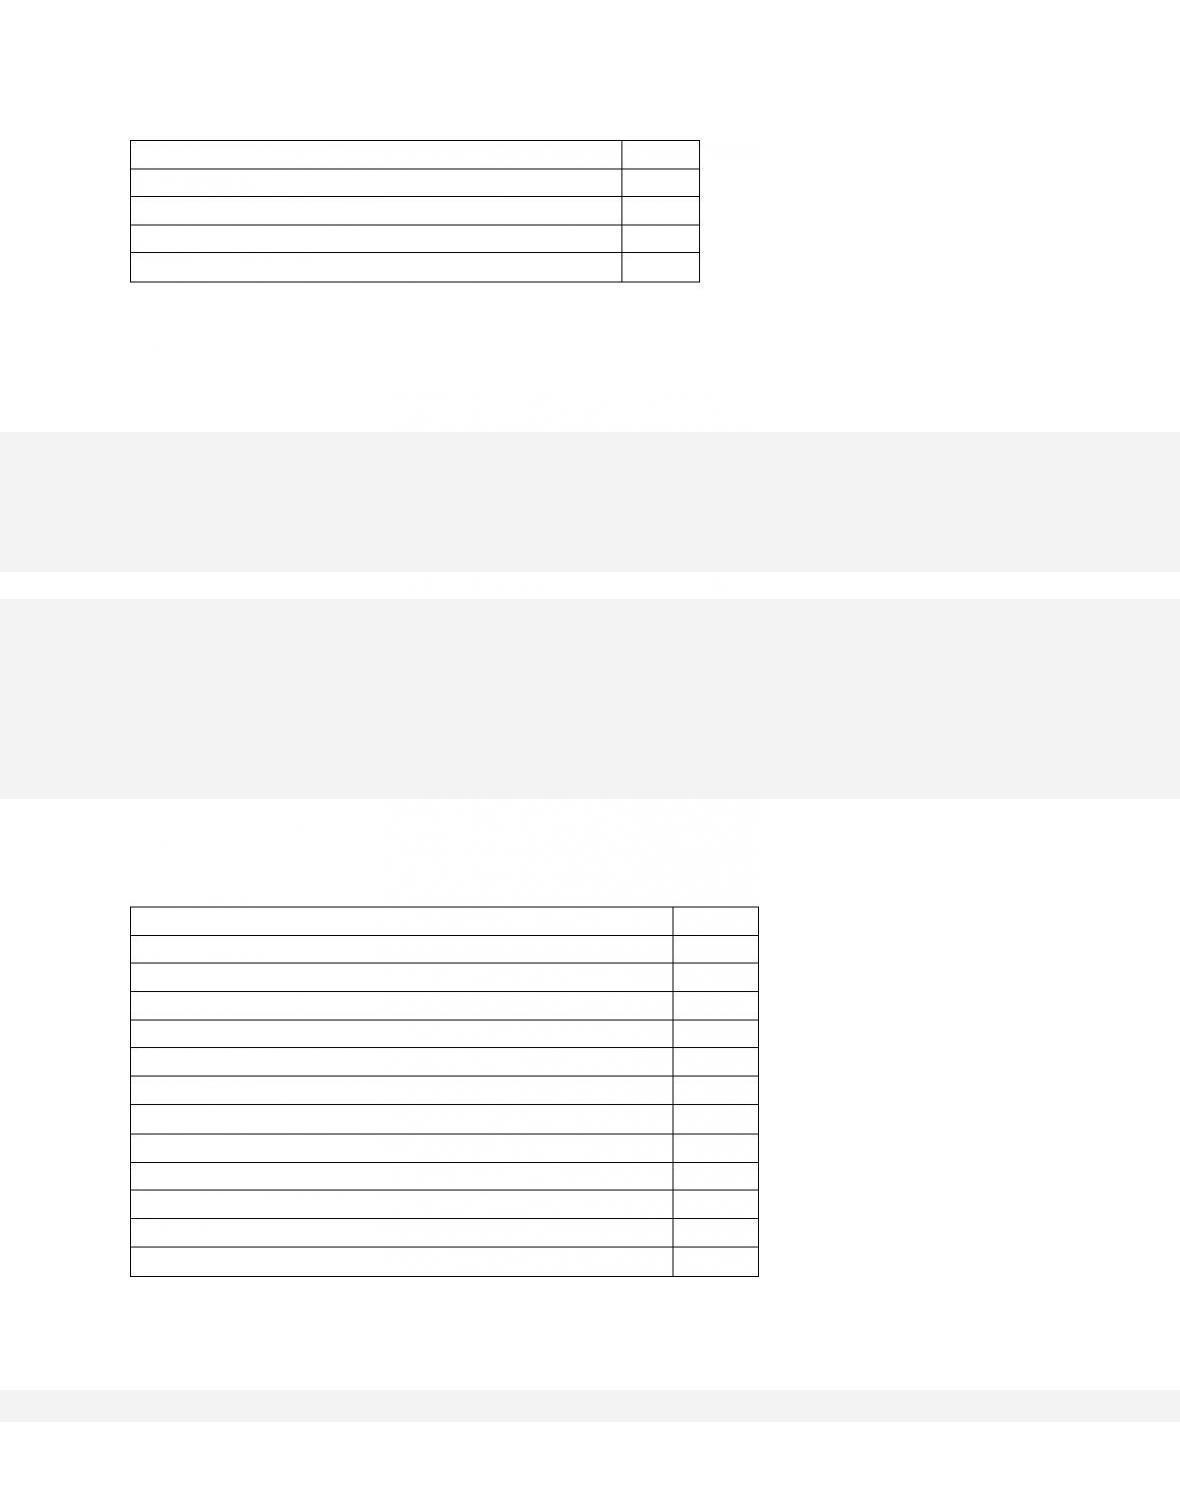
Personal Taxes
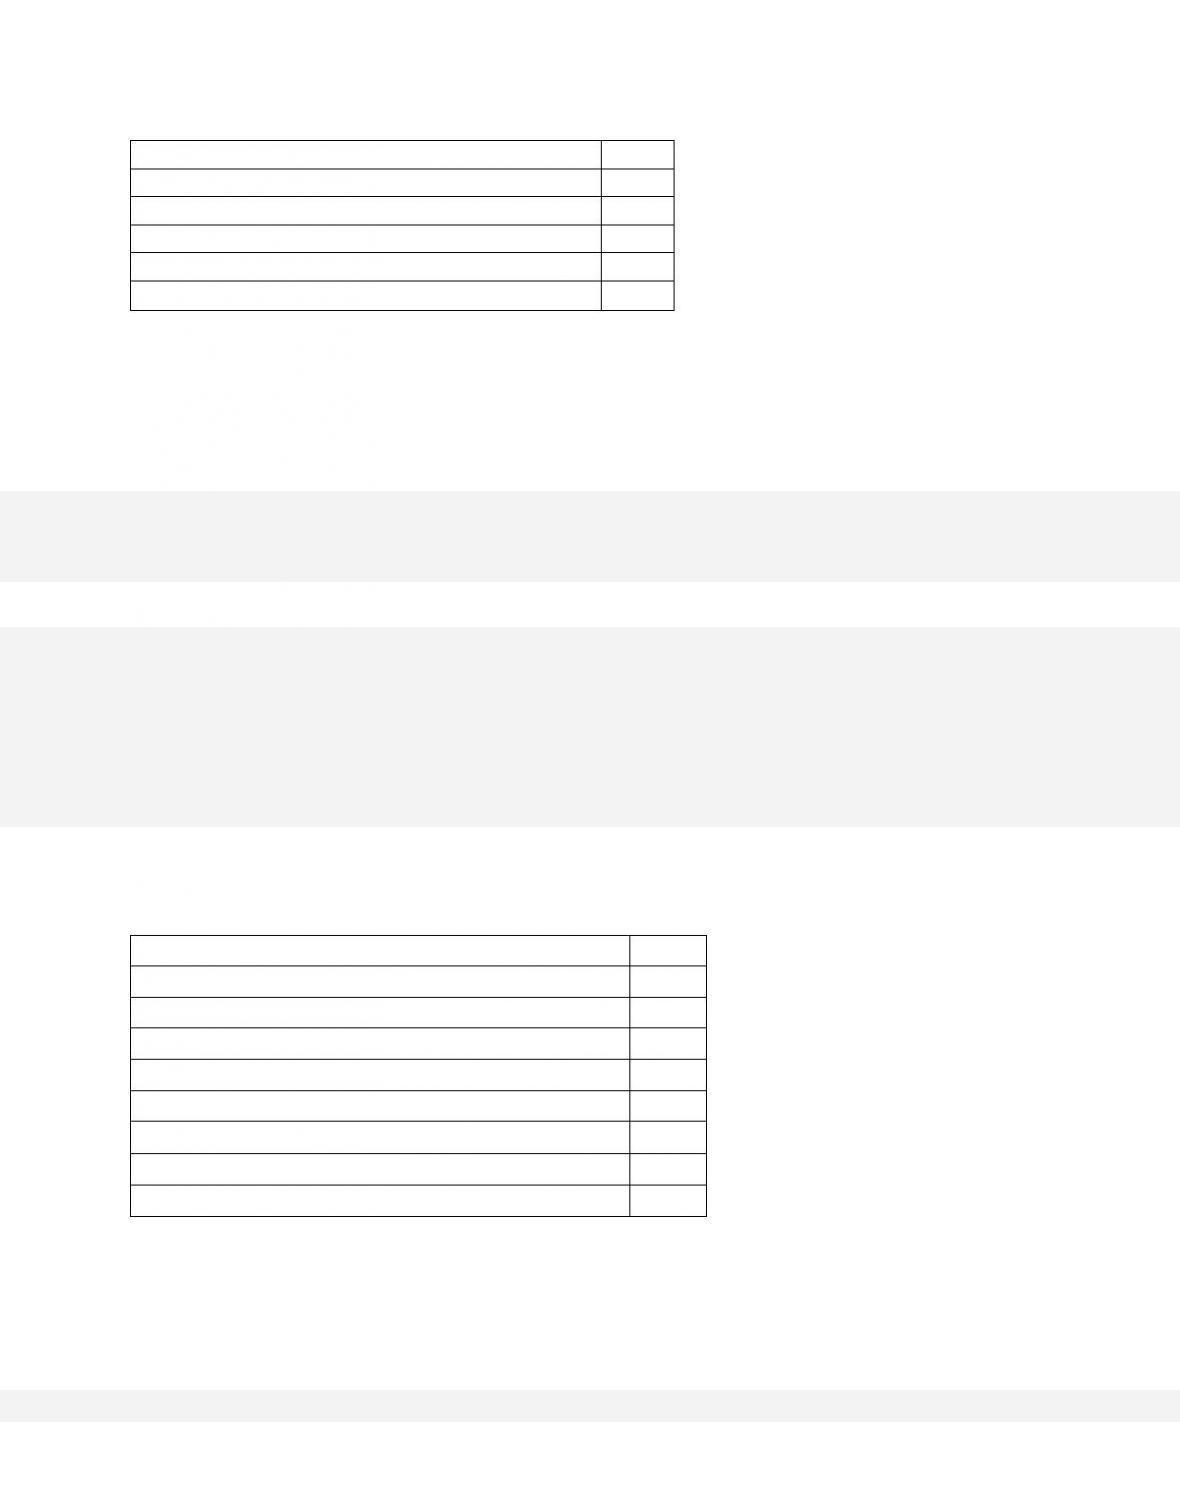
$40
Social Security Contributions
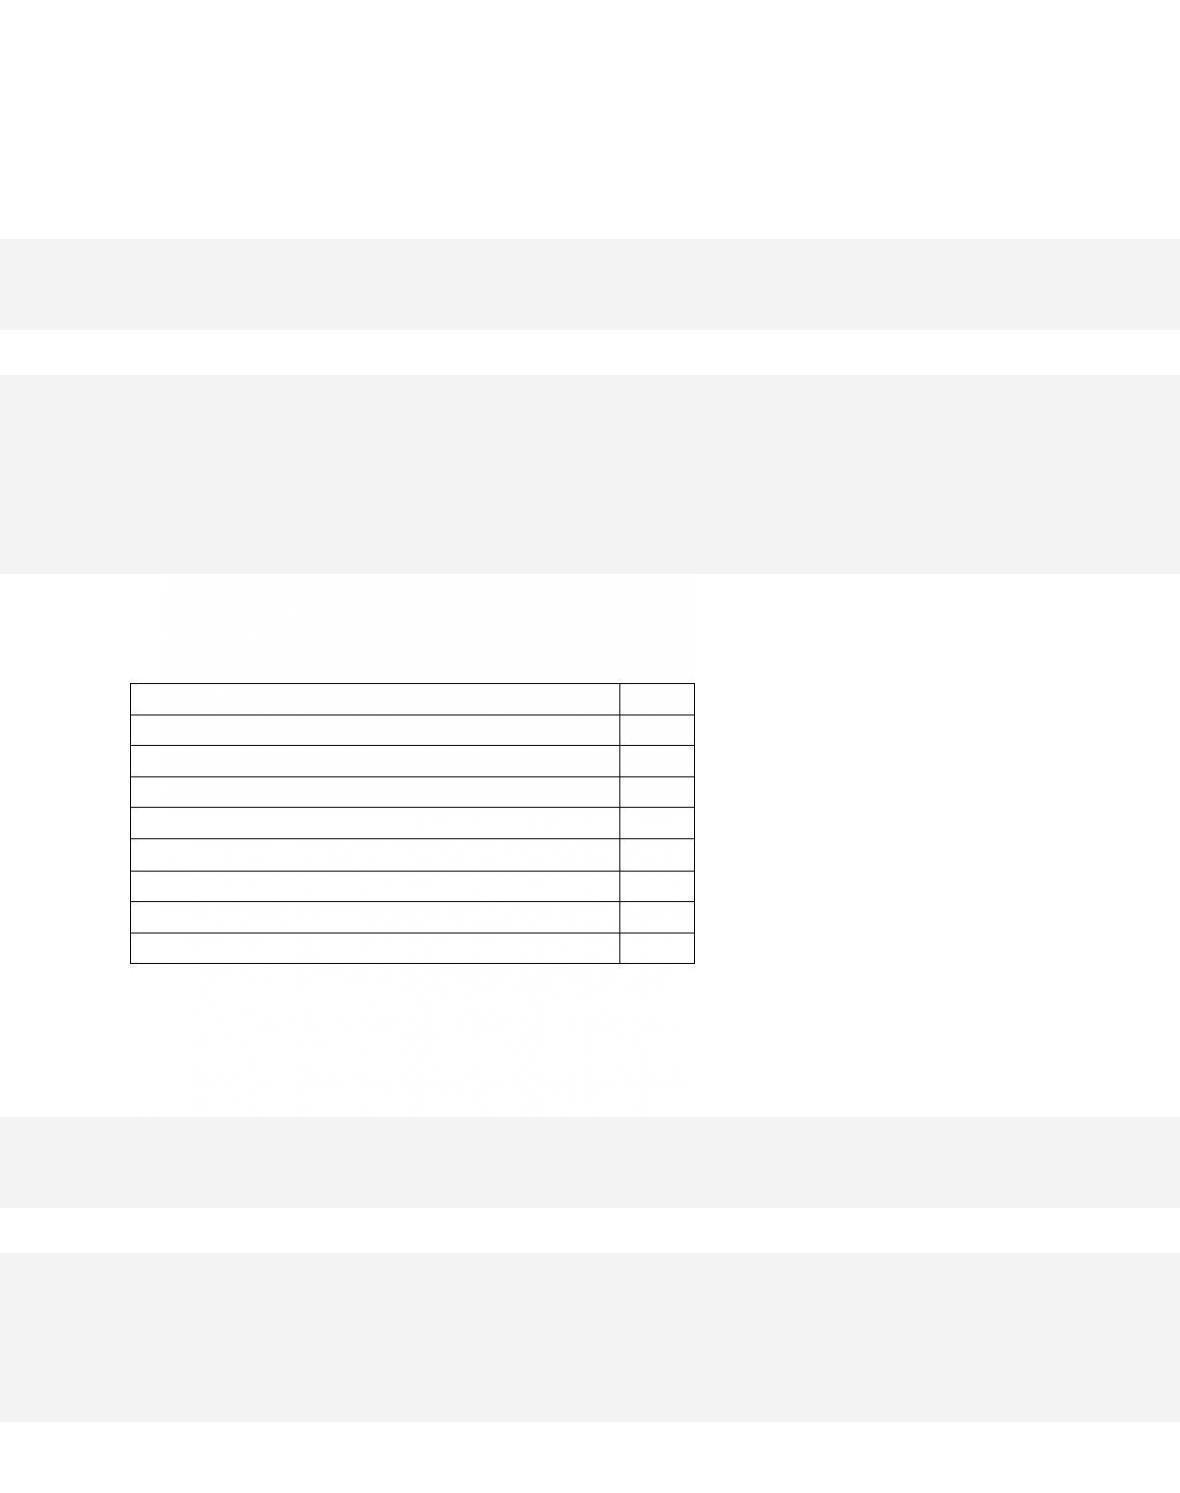
15
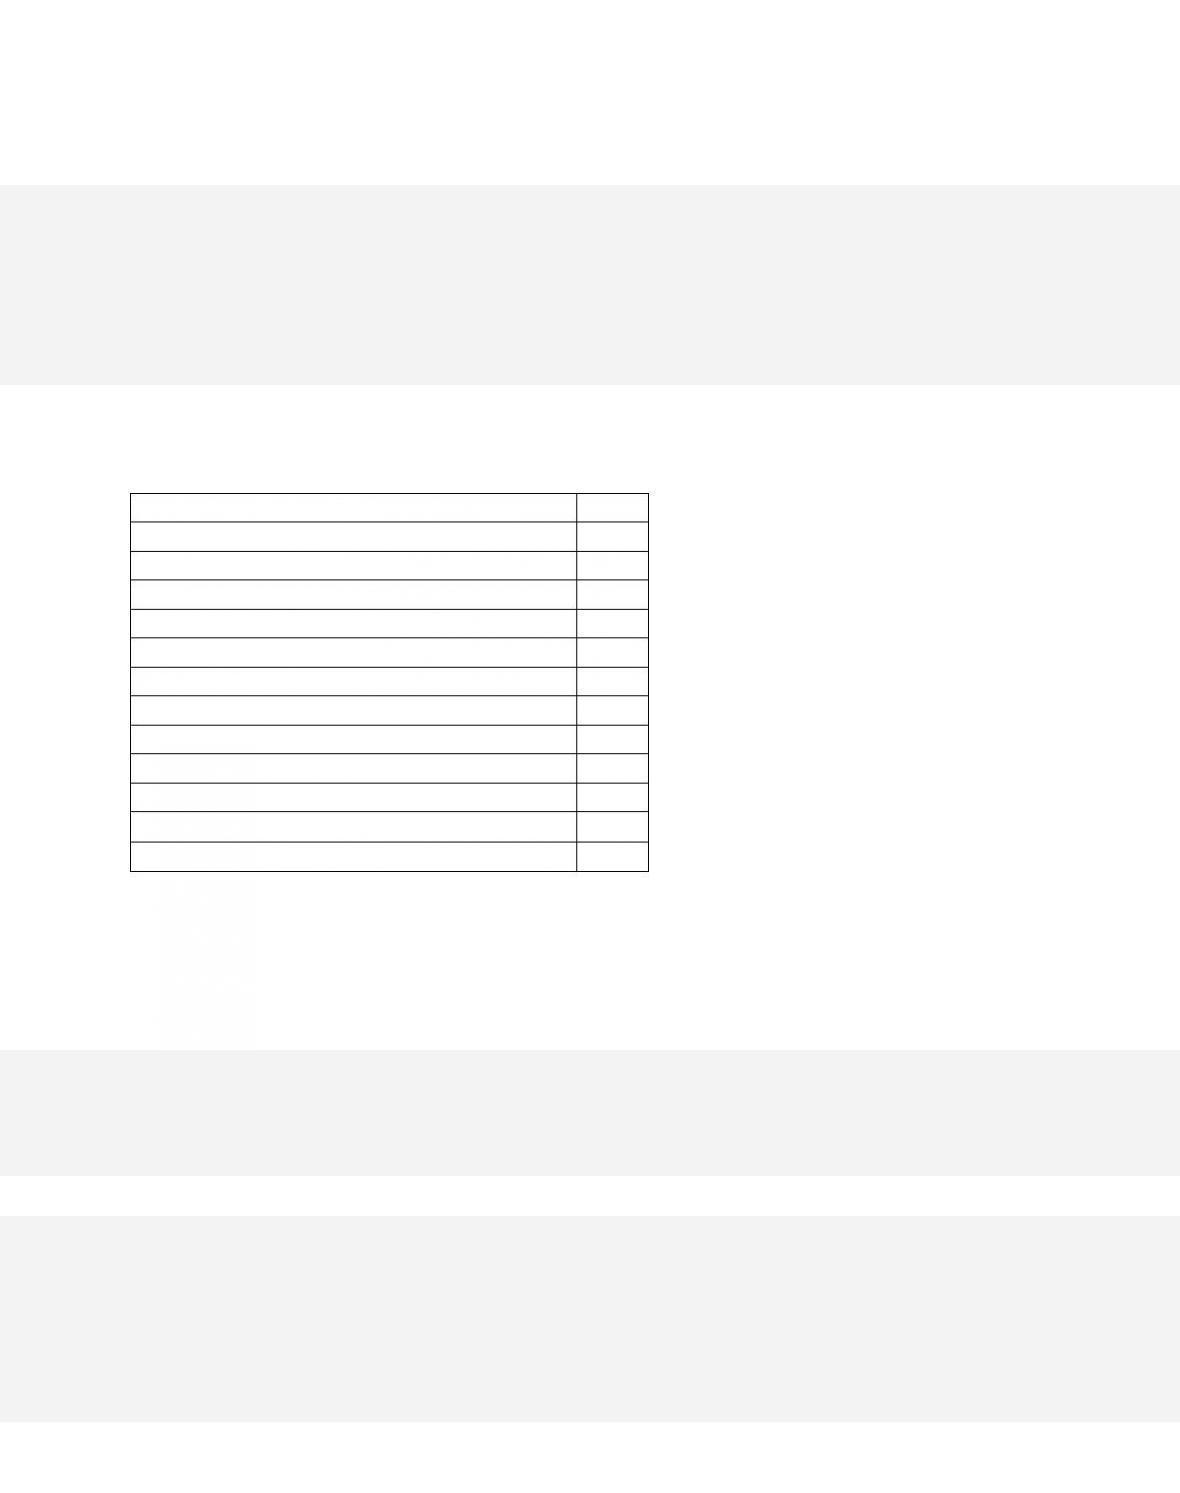
Taxes on Production and Imports
20
Corporate Income Taxes
40
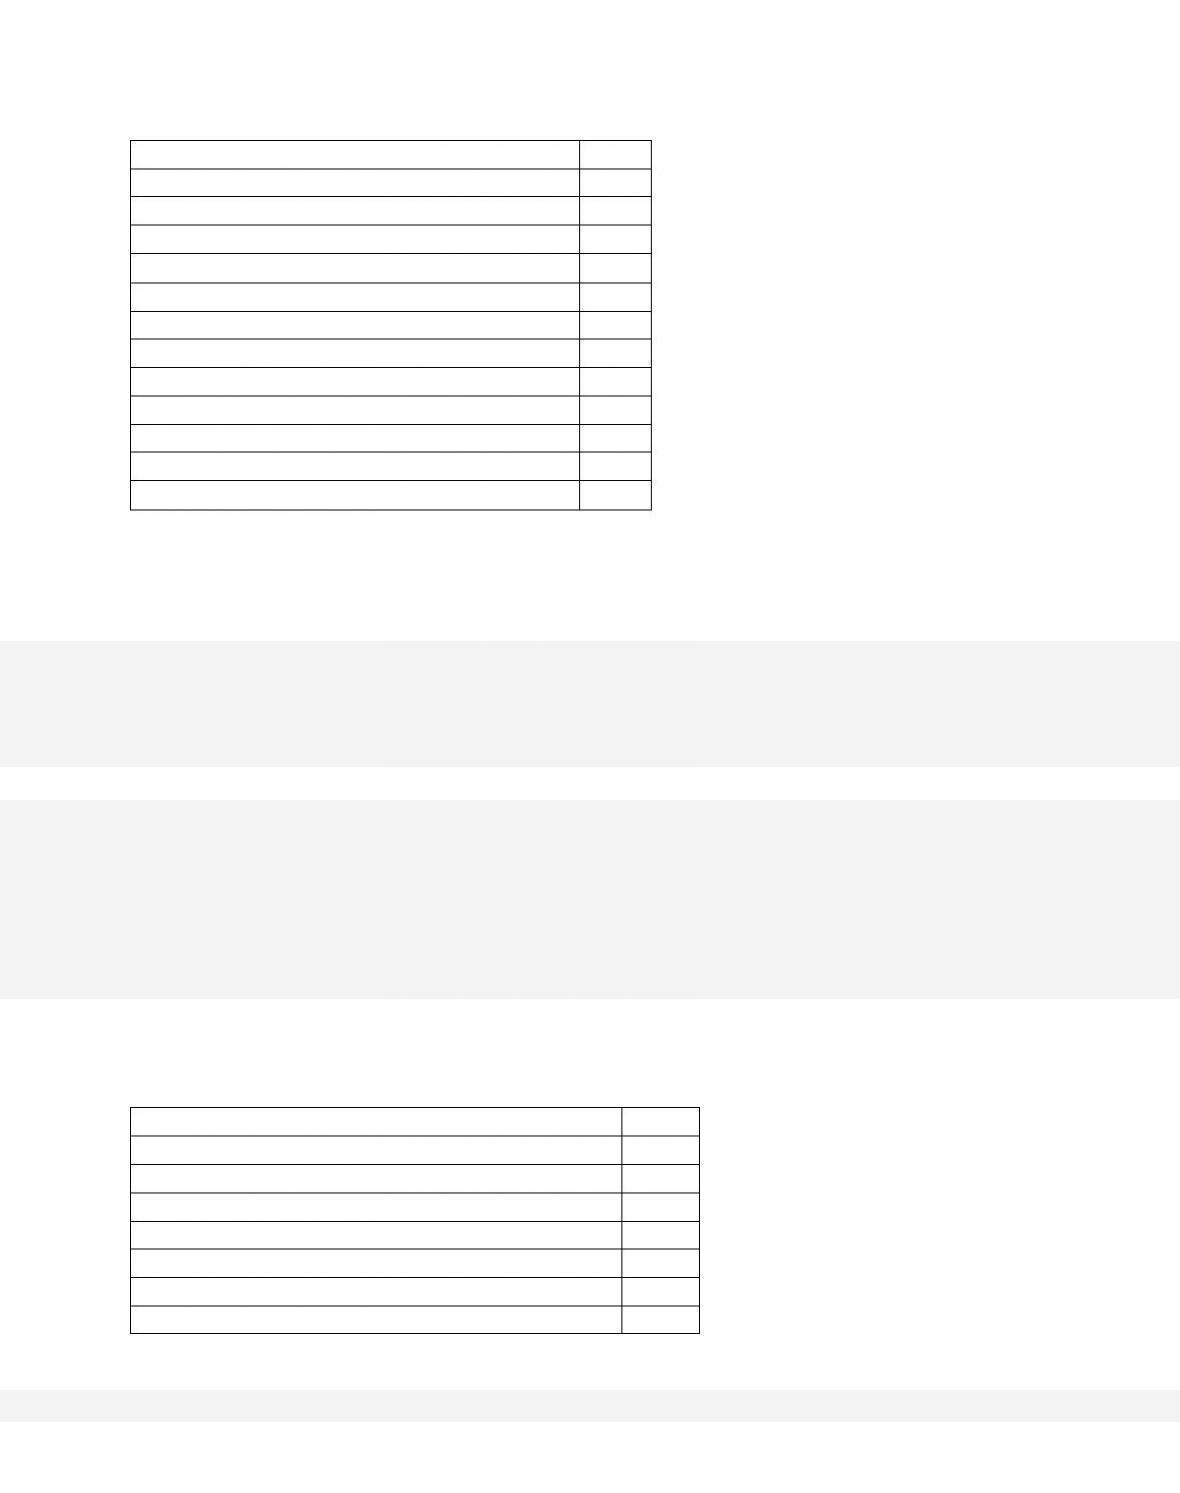
Transfer Payments
22
U.S. Exports
24
Undistributed Corporate Profits
35
Government Purchases
90
Gross Private Domestic Investment
75
U.S. Imports
22
Personal Consumption Expenditures
250
Consumption of Fixed Capital
25
Net Foreign Factor Income
10
Statistical Discrepancy
0
Refer to the accompanying data (all figures in billions of dollars). GDP is
27–25
Copyright © 2018 McGraw-Hill Education. All rights reserved. No reproduction or distribution without the prior
written consent of McGraw-Hill Education.
AACSB: Knowledge Application
Blooms: Understand
Diff icu lty:
02 Medium
Learning Objective: 27-02 Describe how expenditures on goods and services can be
summed to determine GDP.
Test Bank: I
Topic:
The Expenditures Approach
Type: Table
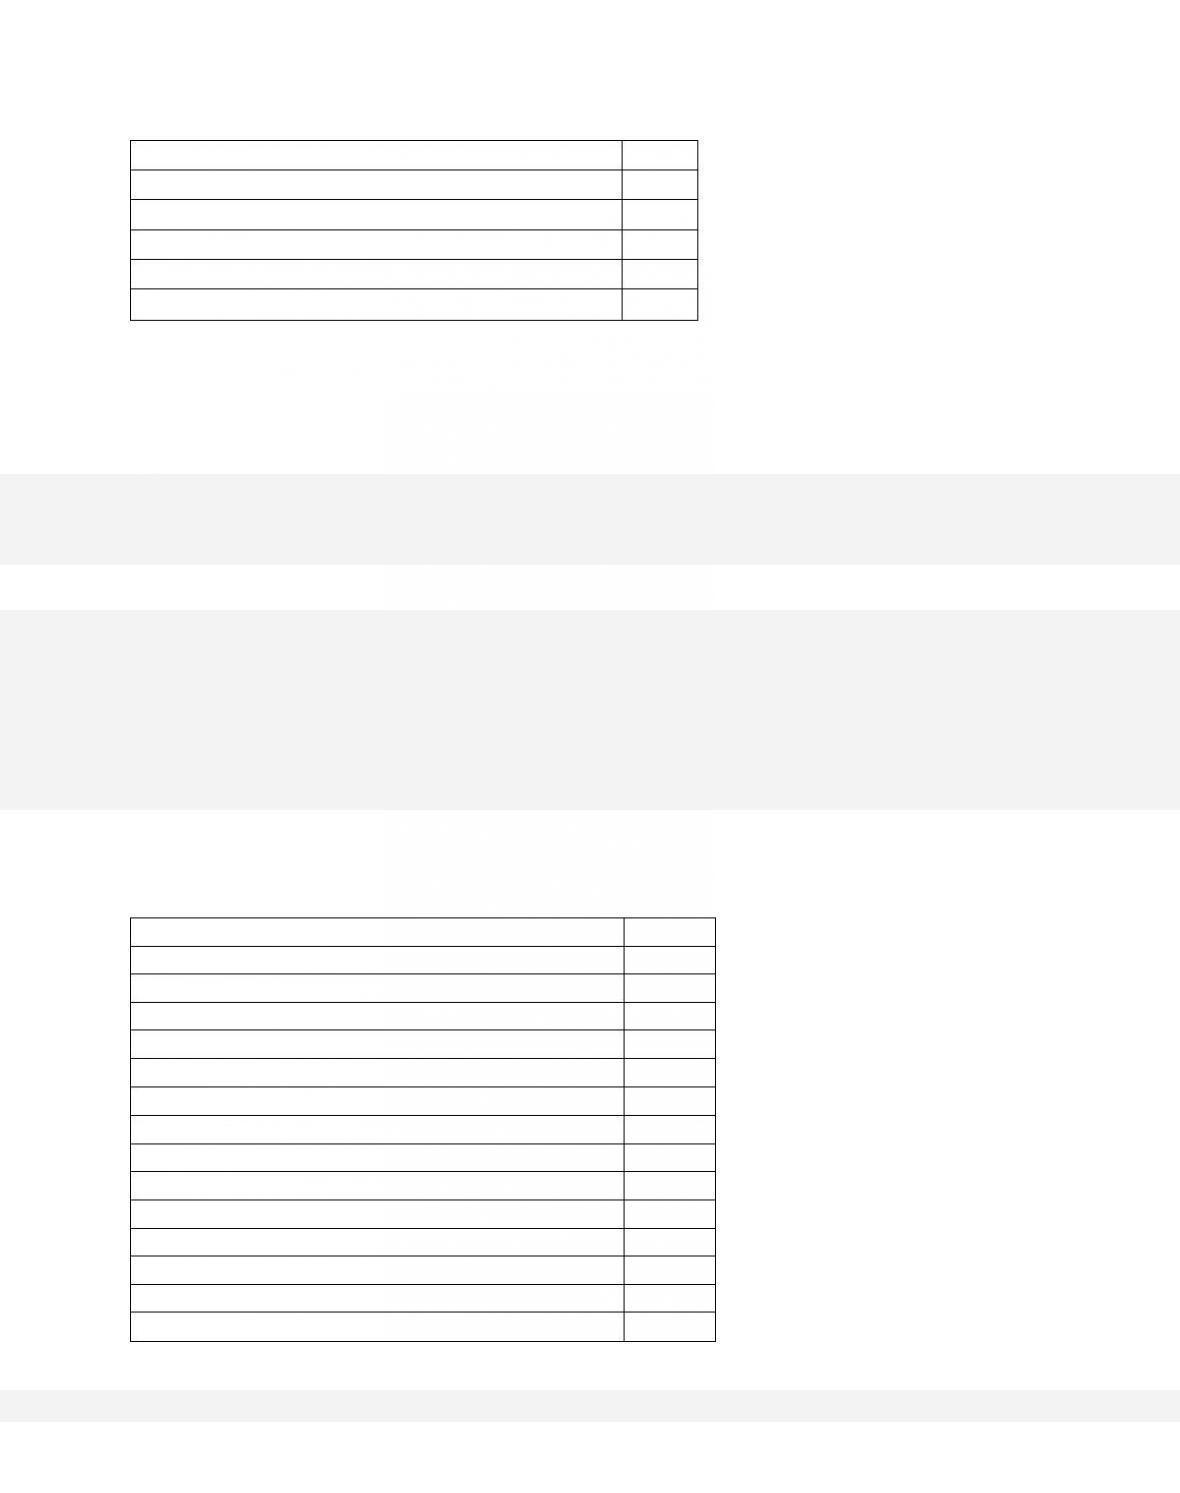
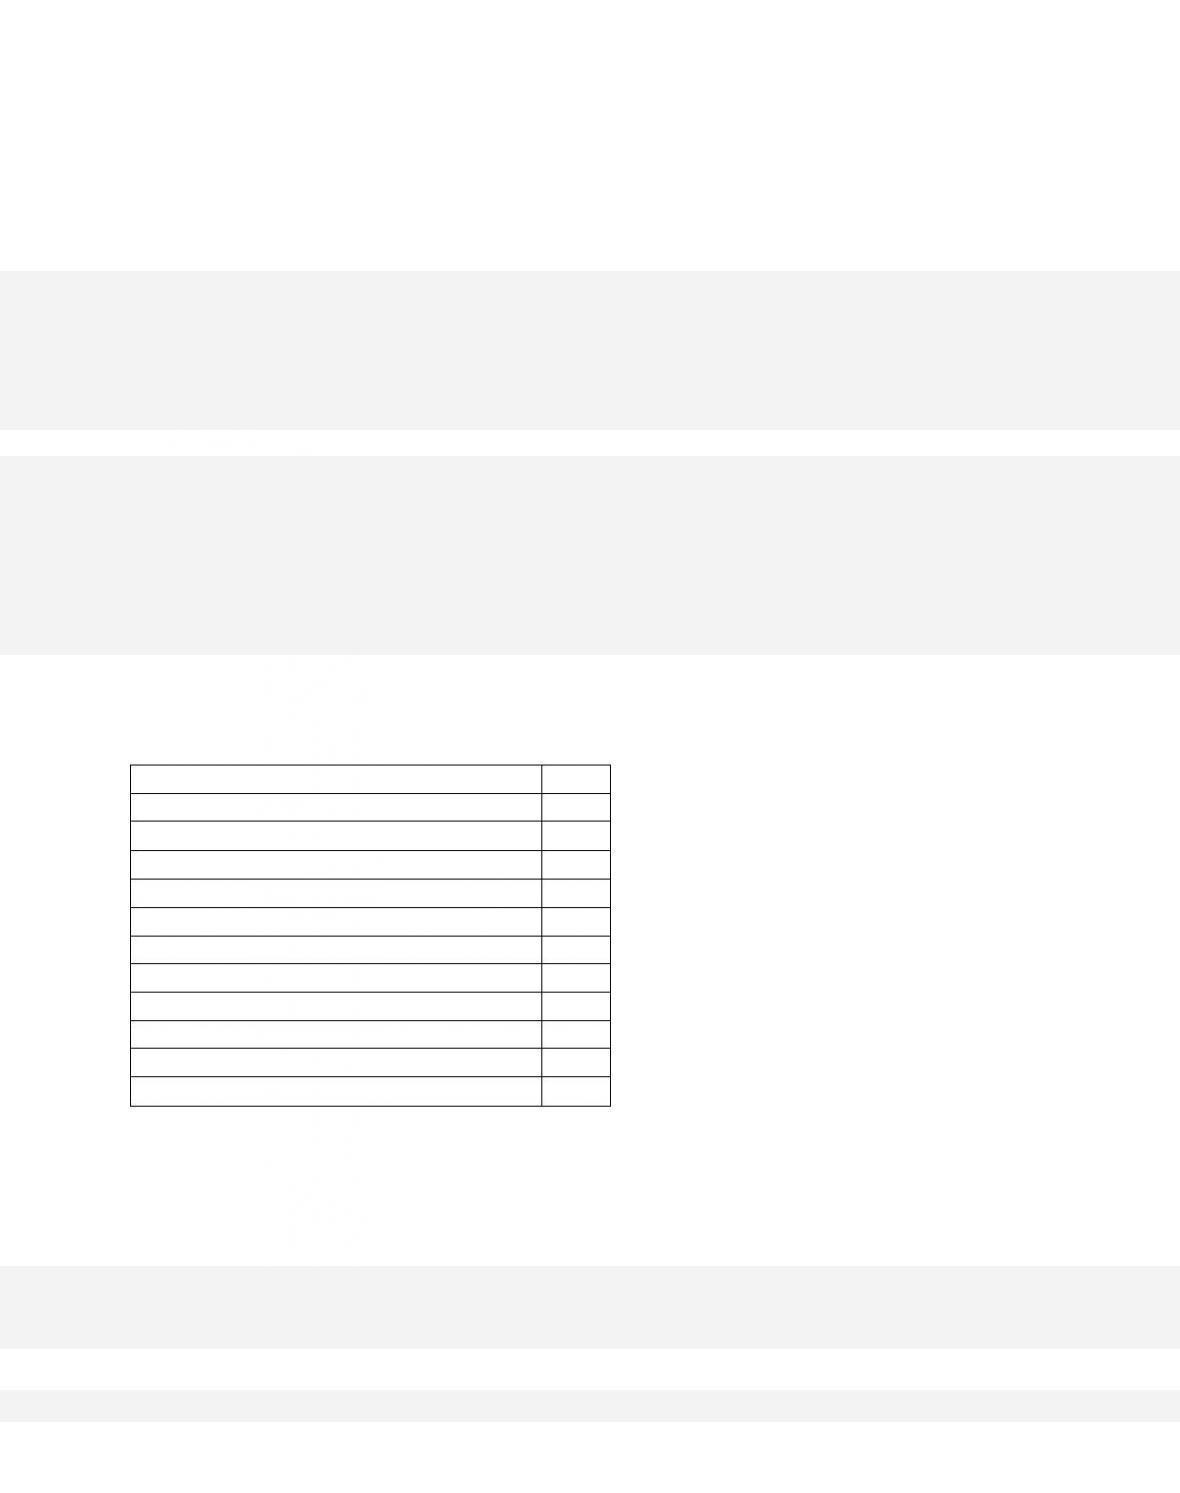
61.
Personal Taxes
$40
Social Security Contributions
15
Taxes on Production and Imports
20
Corporate Income Taxes
40
Transfer Payments
22
U.S. Exports
24
Undistributed Corporate Profits
35
Government Purchases
90
Gross Private Domestic Investment
75
U.S. Imports
22
Personal Consumption Expenditures
250
Consumption of Fixed Capital
25
Net Foreign Factor Income
10
Statistical Discrepancy
0
Refer to the accompanying data (all figures in billions of dollars). NDP is

27–26
Copyright © 2018 McGraw-Hill Education. All rights reserved. No reproduction or distribution without the prior
written consent of McGraw-Hill Education.
Topic:
Other National Accounts
Type: Table
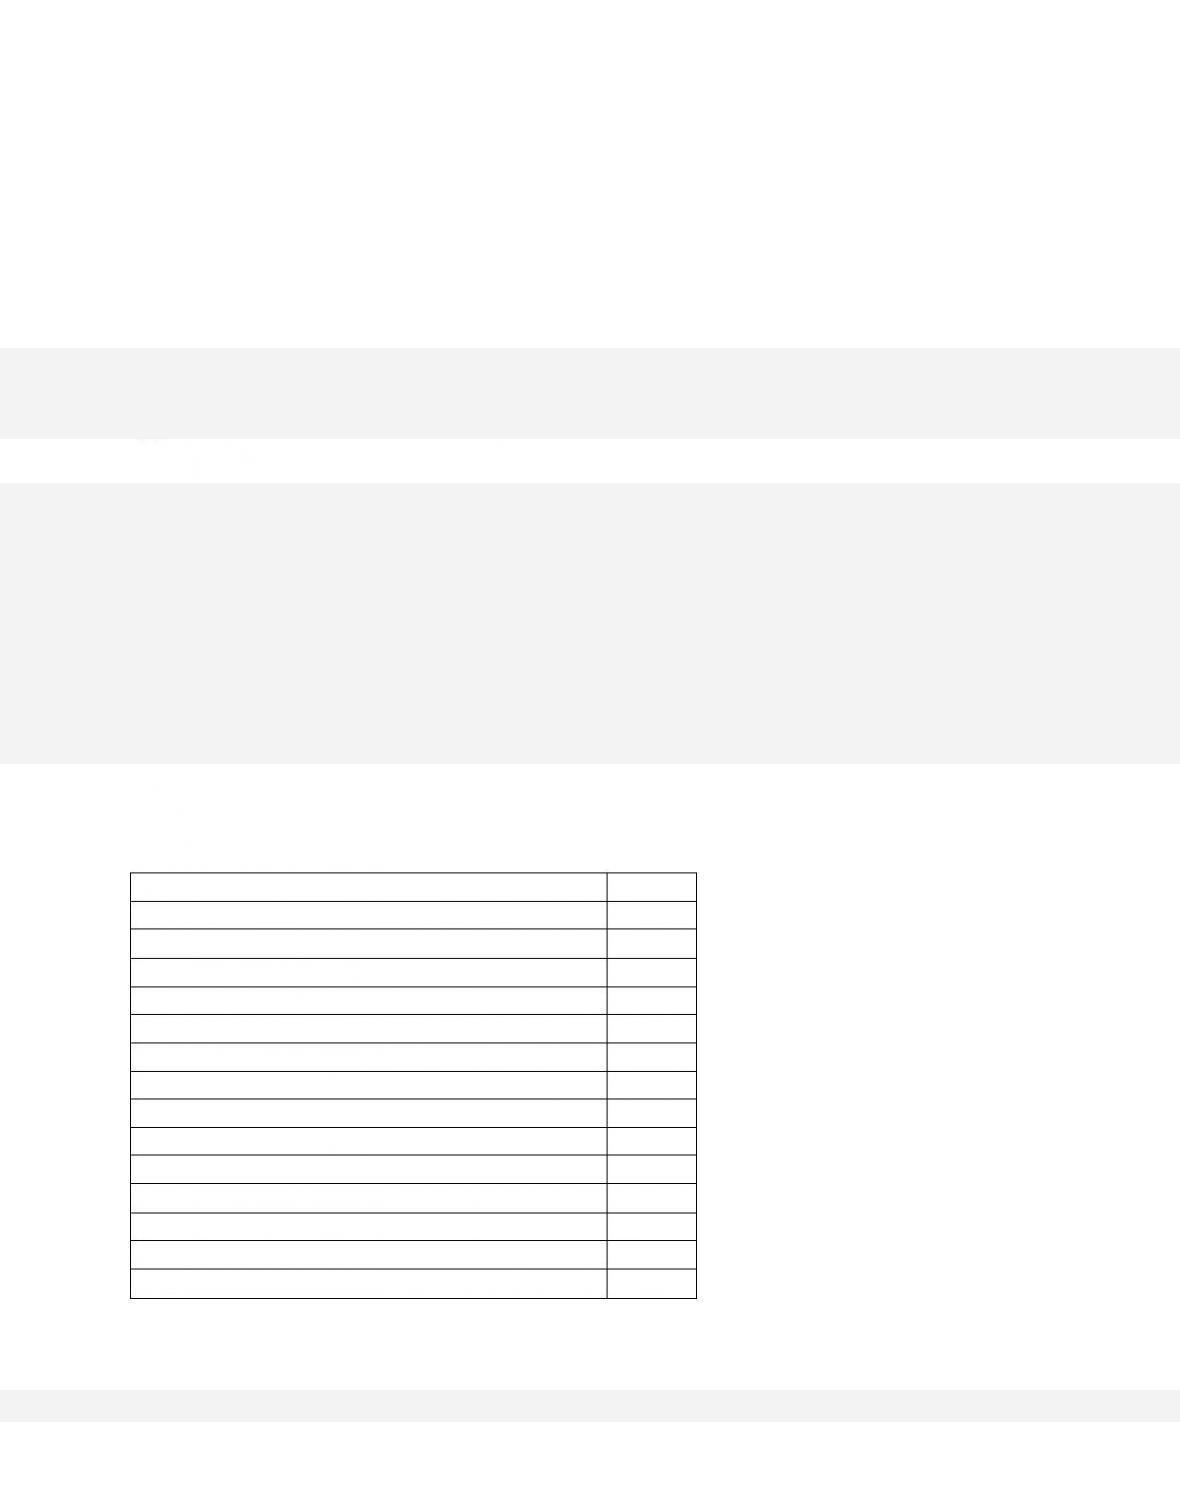
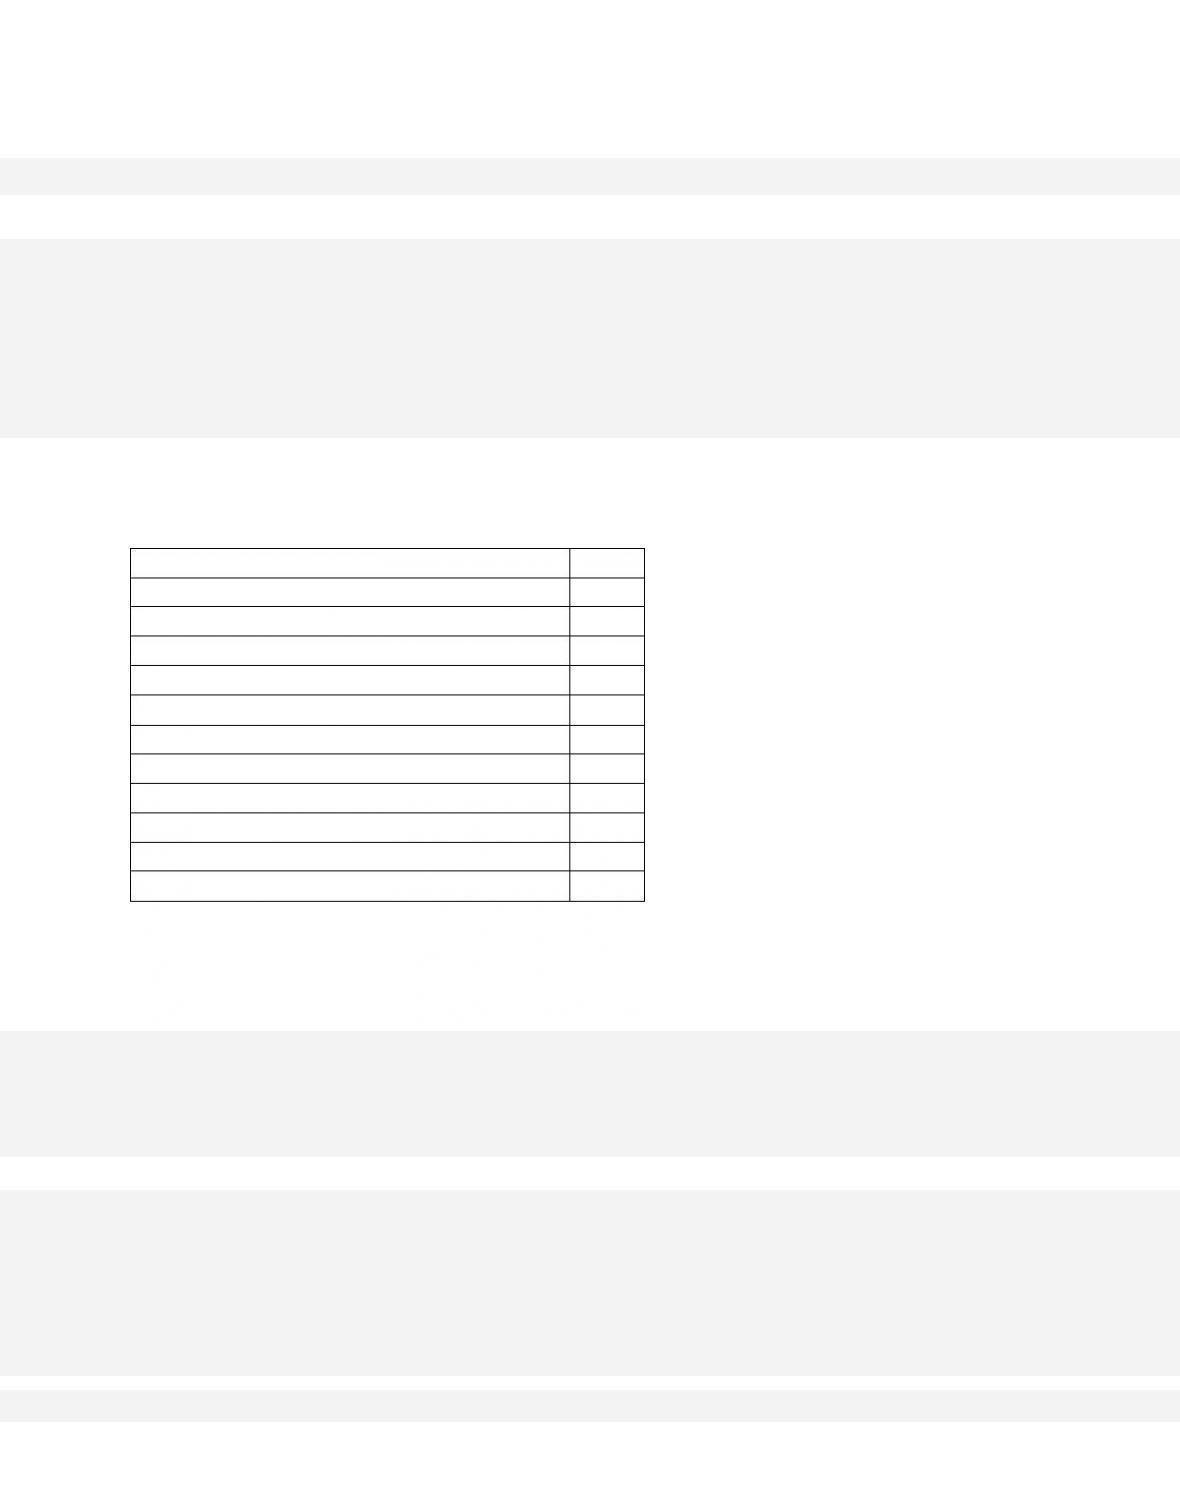
62.
Personal Taxes
$40
Social Security Contributions
15
Taxes on Production and Imports
20
Corporate Income Taxes
40
Transfer Payments
22
U.S. Exports
24
Undistributed Corporate Profits
35
Government Purchases
90
Gross Private Domestic Investment
75
U.S. Imports
22
Personal Consumption Expenditures
250
Consumption of Fixed Capital
25
Net Foreign Factor Income
10
Statistical Discrepancy
0
Refer to the accompanying data (all figures in billions of dollars). NI is
63.
27–27
Personal Taxes
$40
Social Security Contributions
15
Taxes on Production and Imports
20
Corporate Income Taxes
40
Transfer Payments
22
U.S. Exports
24
Undistributed Corporate Profits
35
Government Purchases
90
Gross Private Domestic Investment
75
U.S. Imports
22
Personal Consumption Expenditures
250
Consumption of Fixed Capital
25
Net Foreign Factor Income
10
Statistical Discrepancy
0
Refer to the accompanying data (all figures in billions of dollars). PI is
64.
Personal Taxes
$40
Social Security Contributions
15
Taxes on Production and Imports
20
Corporate Income Taxes
40
Transfer Payments
22
U.S. Exports
24
Undistributed Corporate Profits
35
Government Purchases
90
27–28
Gross Private Domestic Investment
75
U.S. Imports
22
Personal Consumption Expenditures
250
Consumption of Fixed Capital
25
Net Foreign Factor Income
10
Statistical Discrepancy
0
Refer to the accompanying data (all figures in billions of dollars). DI is
65.
Gross Investment
$18
National Income
100
Net Exports
2
Personal Income
85
Personal Consumption Expenditures
70
Saving
5
Government Purchases
20
Net Domestic Product
105
Statistical Discrepancy
0
Refer to the accompanying data (all figures in billions of dollars). The gross domestic
product for this economy is
66.
Gross Investment
$18
National Income
100
Net Exports
2
Personal Income
85
Personal Consumption Expenditures
70
Saving
5
Government Purchases
20
Net Domestic Product
105
Statistical Discrepancy
0
Refer to the accompanying data (all figures in billions of dollars). Consumption of fixed
capital is

27–30
Copyright © 2018 McGraw-Hill Education. All rights reserved. No reproduction or distribution without the prior
written consent of McGraw-Hill Education.
summed to determine GDP.
Test Bank: I
Topic:
The Expenditures Approach
Type: Table
67.
Gross Investment
$18
National Income
100
Net Exports
2
Personal Income
85
Personal Consumption Expenditures
70
Saving
5
Government Purchases
20
Net Domestic Product
105
Statistical Discrepancy
0
Refer to the accompanying data (all figures in billions of dollars). Disposable income is
68.
Gross Investment
$18
National Income
100
Net Exports
2
27–31
Personal Income
85
Personal Consumption Expenditures
70
Saving
5
Government Purchases
20
Net Domestic Product
105
Statistical Discrepancy
0
Refer to the accompanying data (all figures in billions of dollars). From this information
we can conclude that the net foreign factor income is
69.
Personal Consumption Expenditures
$400
Government Purchases
128
Gross Private Domestic Investment
88
Net Exports
7
Net Foreign Factor Income
0
Consumption of Fixed Capital
43
Taxes on Production and Imports
50
Compensation of Employees
369
Rents
12
Interest
15
Proprietors’ Income
52
Corporate Income Taxes
36
Dividends
24
Undistributed Corporate Profits
22
Statistical Discrepancy
0
27–32
Refer to the accompanying national income data for the economy. All figures are in
billions of dollars. The gross domestic product for this economy is
70.
Personal Consumption Expenditures
$400
Government Purchases
128
Gross Private Domestic Investment
88
Net Exports
7
Net Foreign Factor Income
0
Consumption of Fixed Capital
43
Taxes on Production and Imports
50
Compensation of Employees
369
Rents
12
Interest
15
Proprietors’ Income
52
Corporate Income Taxes
36
Dividends
24
Undistributed Corporate Profits
22
Statistical Discrepancy
0
27–33
Refer to the accompanying national income data for the economy. All figures are in
billions of dollars. Net domestic product is
71.
Personal Consumption Expenditures
$400
Government Purchases
128
Gross Private Domestic Investment
88
Net Exports
7
Net Foreign Factor Income
0
Consumption of Fixed Capital
43
Taxes on Production and Imports
50
Compensation of Employees
369
Rents
12
Interest
15
Proprietors’ Income
52
Corporate Income Taxes
36
Dividends
24
Undistributed Corporate Profits
22
Statistical Discrepancy
0
Refer to the accompanying national income data for the economy. All figures are in
billions of dollars. The national income is
72.
Personal Consumption Expenditures
$400
Government Purchases
128
Gross Private Domestic Investment
88
Net Exports
7
Net Foreign Factor Income
0
Consumption of Fixed Capital
43
Taxes on Production and Imports
50
Compensation of Employees
369
Rents
12
Interest
15
Proprietors’ Income
52
Corporate Income Taxes
36
Dividends
24
Undistributed Corporate Profits
22
Statistical Discrepancy
0
Refer to the accompanying national income data for the economy. All figures are in
billions of dollars. Disposable income
73.
Gross Private Domestic Investment
$46
Exports of the U.S.
9
Disposable Income
190
Personal Saving
10
Government Purchases
84
Net Foreign Factor Income
10
Consumption of Fixed Capital
52
Dividends
13
Imports of the U.S.
12
Taxes on Production and Imports
22
Personal Taxes
38
Social Security Contributions
23
Statistical Discrepancy
0
Refer to the accompanying data. All figures are in billions of dollars. The gross domestic
product is

27–36
Copyright © 2018 McGraw-Hill Education. All rights reserved. No reproduction or distribution without the prior
written consent of McGraw-Hill Education.
Test Bank: I
Topic:
The Expenditures Approach
Type: Table
74.
Gross Private Domestic Investment
$46
Exports of the U.S.
9
Disposable Income
190
Personal Saving
10
Government Purchases
84
Net Foreign Factor Income
10
Consumption of Fixed Capital
52
Dividends
13
Imports of the U.S.
12
Taxes on Production and Imports
22
Personal Taxes
38
Social Security Contributions
23
Statistical Discrepancy
0
Refer to the accompanying data. All figures are in billions of dollars. The net domestic
product is
75.
27–37
Gross Private Domestic Investment
$46
Exports of the U.S.
9
Disposable Income
190
Personal Saving
10
Government Purchases
84
Net Foreign Factor Income
10
Consumption of Fixed Capital
52
Dividends
13
Imports of the U.S.
12
Taxes on Production and Imports
22
Personal Taxes
38
Social Security Contributions
23
Statistical Discrepancy
0
Refer to the accompanying data. All figures are in billions of dollars. The national income
is
76.
Gross Private Domestic Investment
$46
Exports of the U.S.
9
Disposable Income
190
Personal Saving
10
Government Purchases
84
Net Foreign Factor Income
10
Consumption of Fixed Capital
52
Dividends
13
27–38
Imports of the U.S.
12
Taxes on Production and Imports
22
Personal Taxes
38
Social Security Contributions
23
Statistical Discrepancy
0
Refer to the accompanying data. All figures are in billions of dollars. Personal income is
77.
Gross Private Domestic Investment
$46
Exports of the U.S.
9
Disposable Income
190
Personal Saving
10
Government Purchases
84
Net Foreign Factor Income
10
Consumption of Fixed Capital
52
Dividends
13
Imports of the U.S.
12
Taxes on Production and Imports
22
Personal Taxes
38
Social Security Contributions
23
Statistical Discrepancy
0
27–39
Refer to the accompanying data. All figures are in billions of dollars. The economy
characterized by the data is
78.
Proprietors’ Income
$20
Compensation of Employees
300
Consumption of Fixed Capital
15
Gross Investment
80
Rents
10
Interest
20
Exports
30
Imports
50
Corporate Profits
25
Taxes on Production and Imports
5
Net Foreign Factor Income
0
Statistical Discrepancy
0
Refer to the accompanying data. All figures are in billions of dollars. National income is
27–40
Copyright © 2018 McGraw-Hill Education. All rights reserved. No reproduction or distribution without the prior
written consent of McGraw-Hill Education.
C. $375.
D. $360.
79.
Proprietors’ Income
$20
Compensation of Employees
300
Consumption of Fixed Capital
15
Gross Investment
80
Rents
10
Interest
20
Exports
30
Imports
50
Corporate Profits
25
Taxes on Production and Imports
5
Net Foreign Factor Income
0
Statistical Discrepancy
0
Refer to the accompanying data. All figures are in billions of dollars. Gross domestic
product is