Unlock document.
This document is partially blurred.
Unlock all pages and 1 million more documents.
Get Access
23-81
Copyright © 2018 McGraw-Hill Education. All rights reserved. No reproduction or distribution without the prior
written consent of McGraw-Hill Education.
Blooms: Understand
Diffic ulty: 02 Medium
Learning Objective: 23-01 Explain how income inequality in the United States is
measured and described.
Test Bank: II
Topic:
Facts about Income Inequality
178.
The Gini ratio is calculated by dividing the area between the Lorenz curve and the diagonal
by the
179.
As the area between the Lorenz curve and diagonal gets larger, the Gini ratio
180.
Perfect income equality would yield a Gini ratio of
23-82
Copyright © 2018 McGraw-Hill Education. All rights reserved. No reproduction or distribution without the prior
written consent of McGraw-Hill Education.
C. 0.
D. 0.5.
181.
A kingdom where only the king earns all income would have a Gini ratio of
182.
Which of the following Gini ratios would indicate the least amount of income inequality?
183.
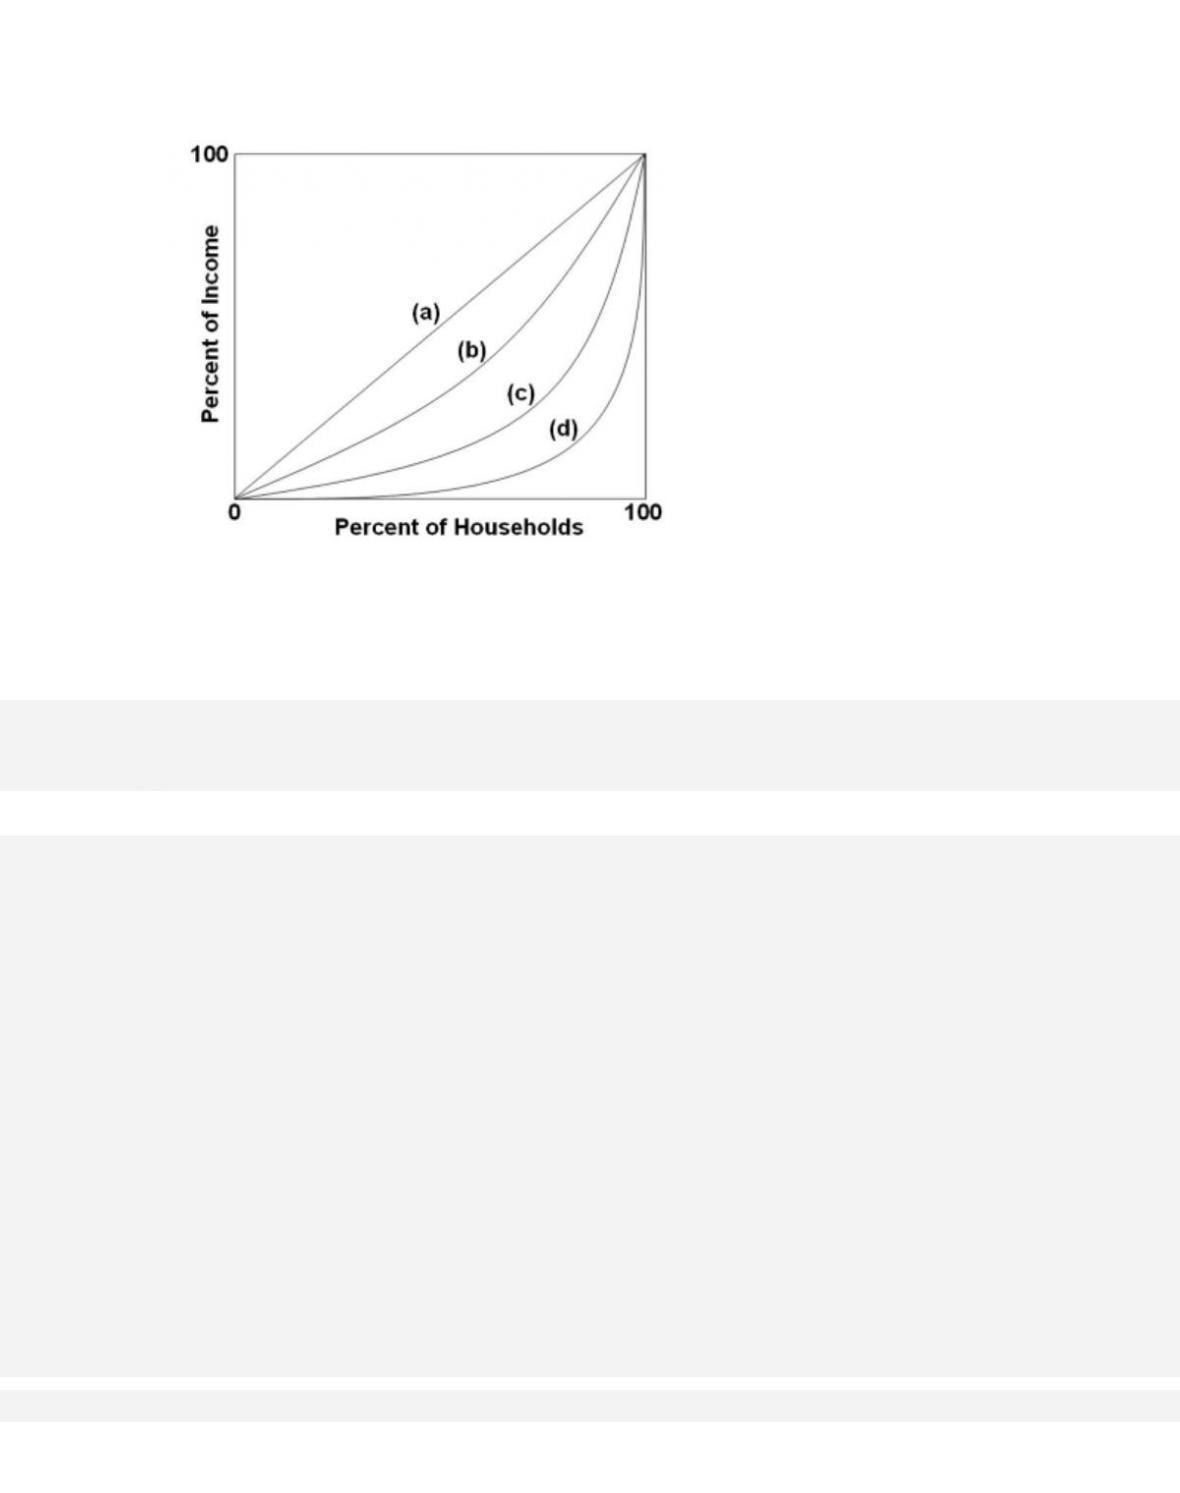
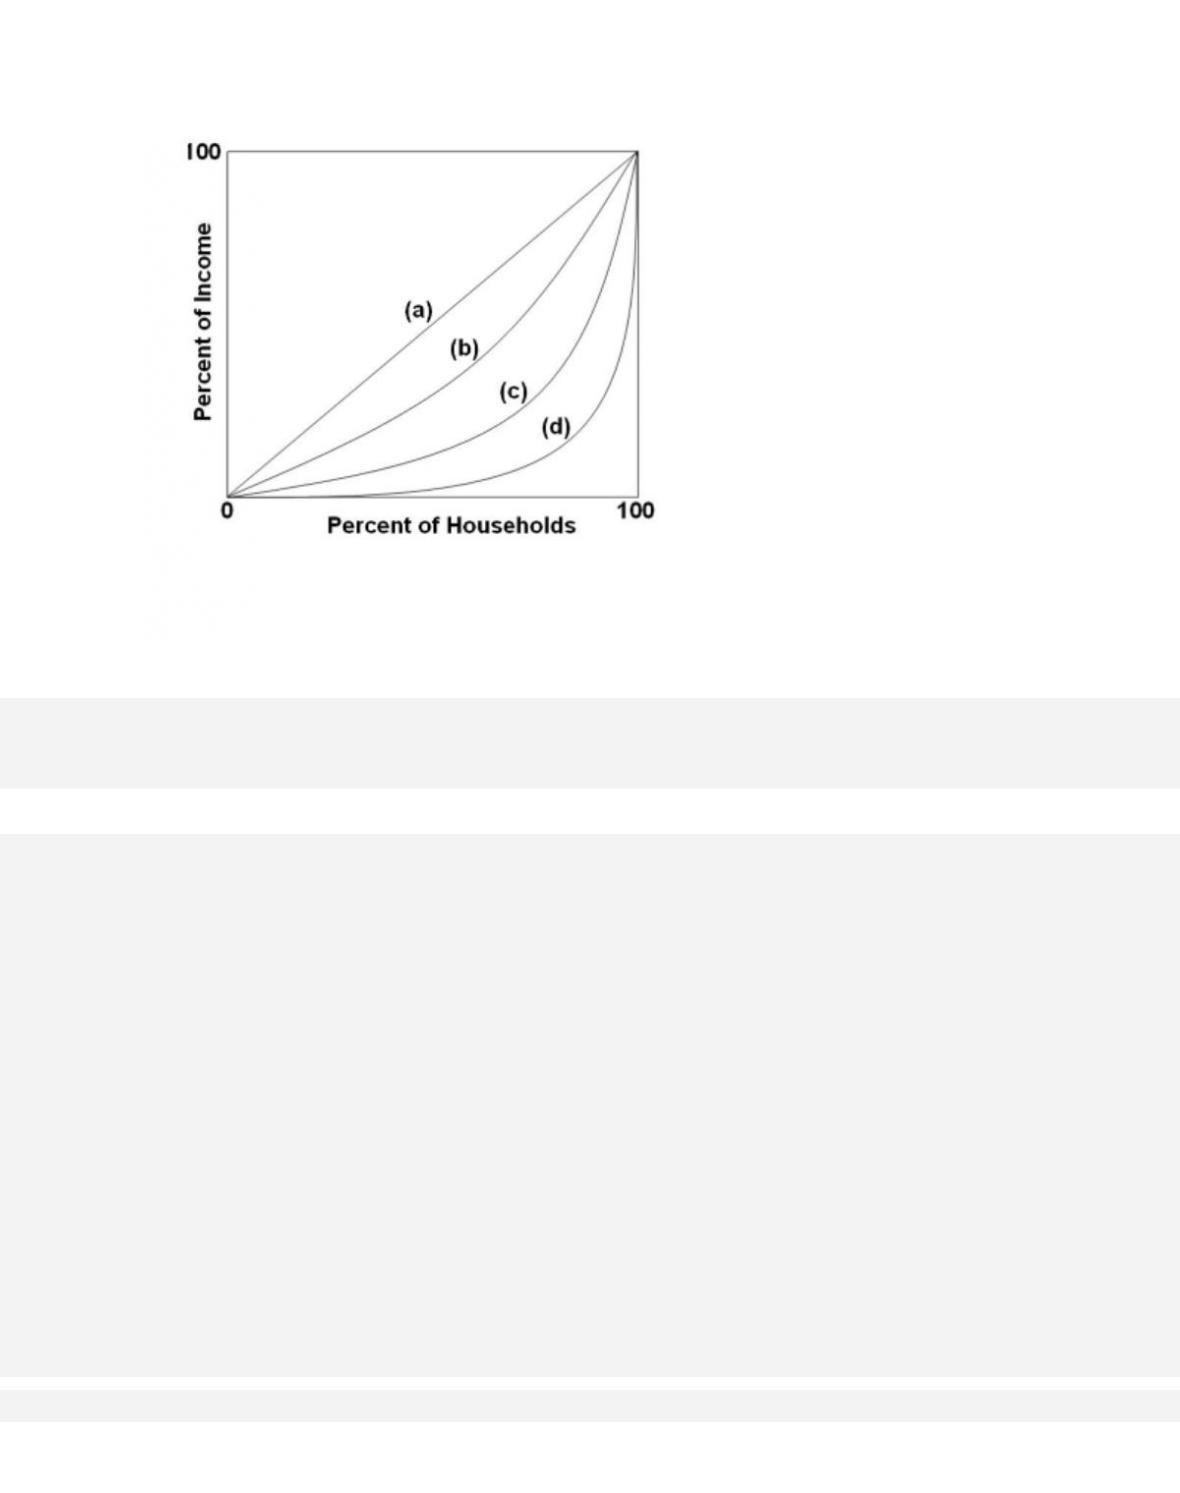
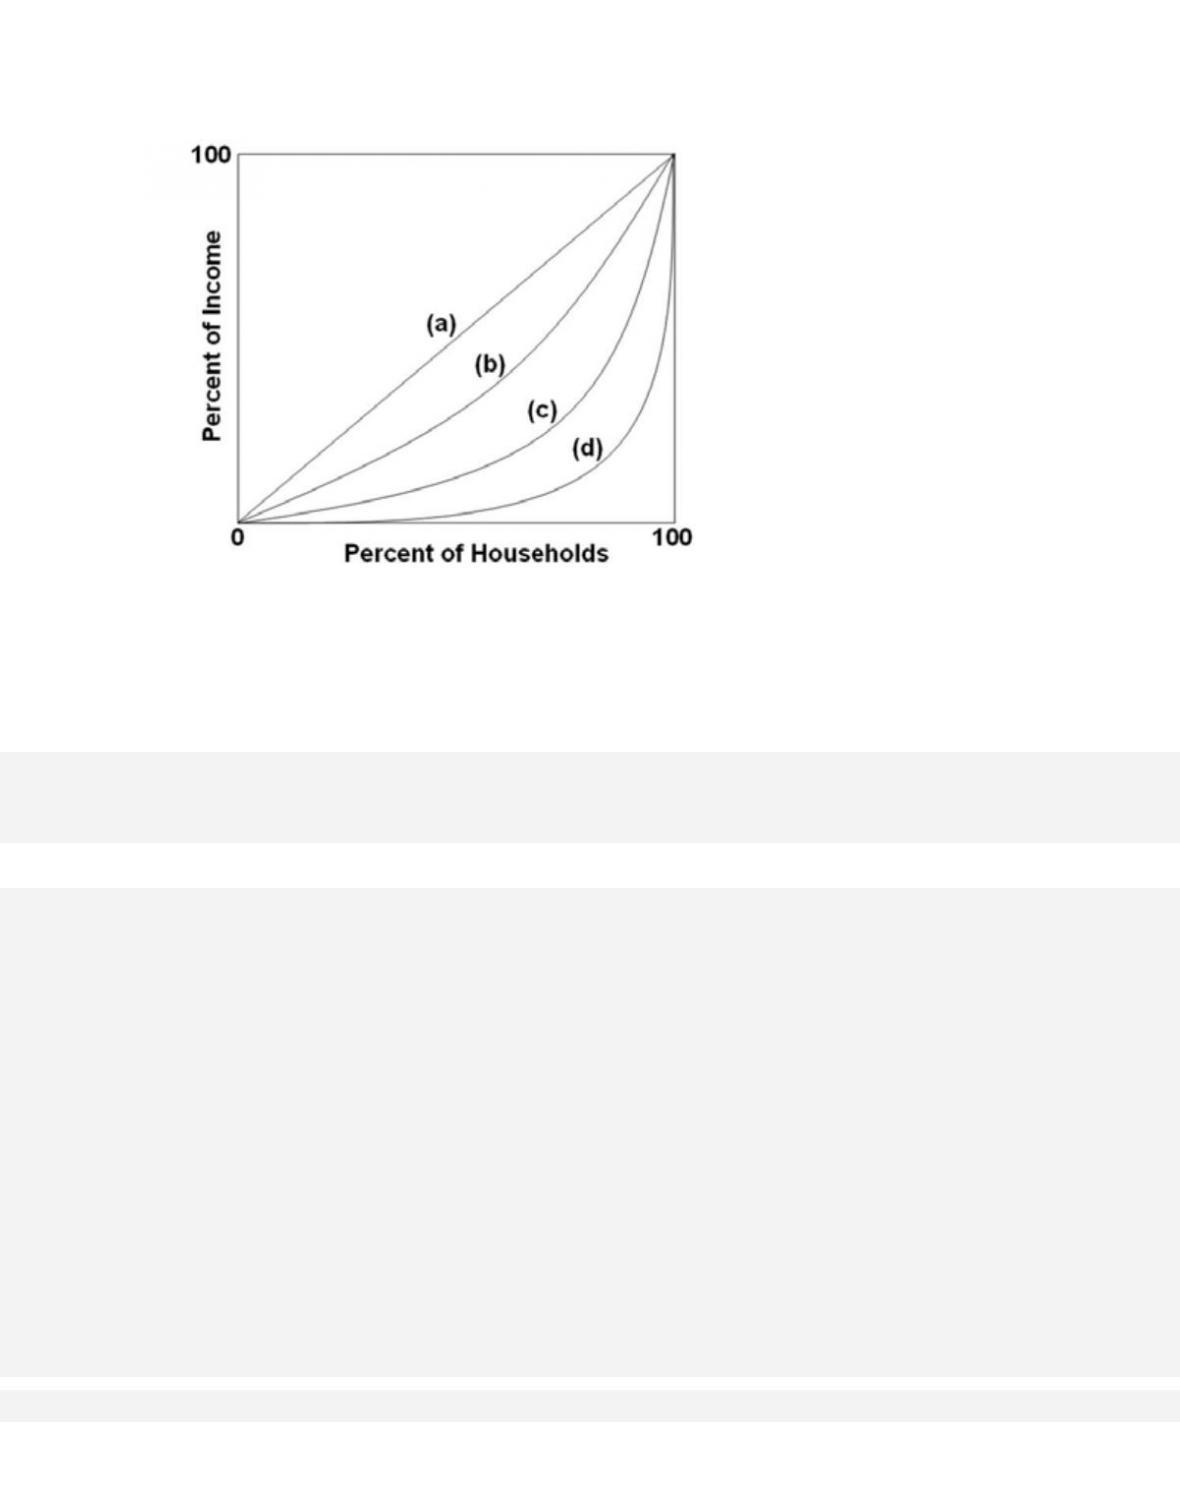
A progressive income tax would cause the after-tax Lorenz curve, compared with the
before-tax Lorenz curve, to be
184.
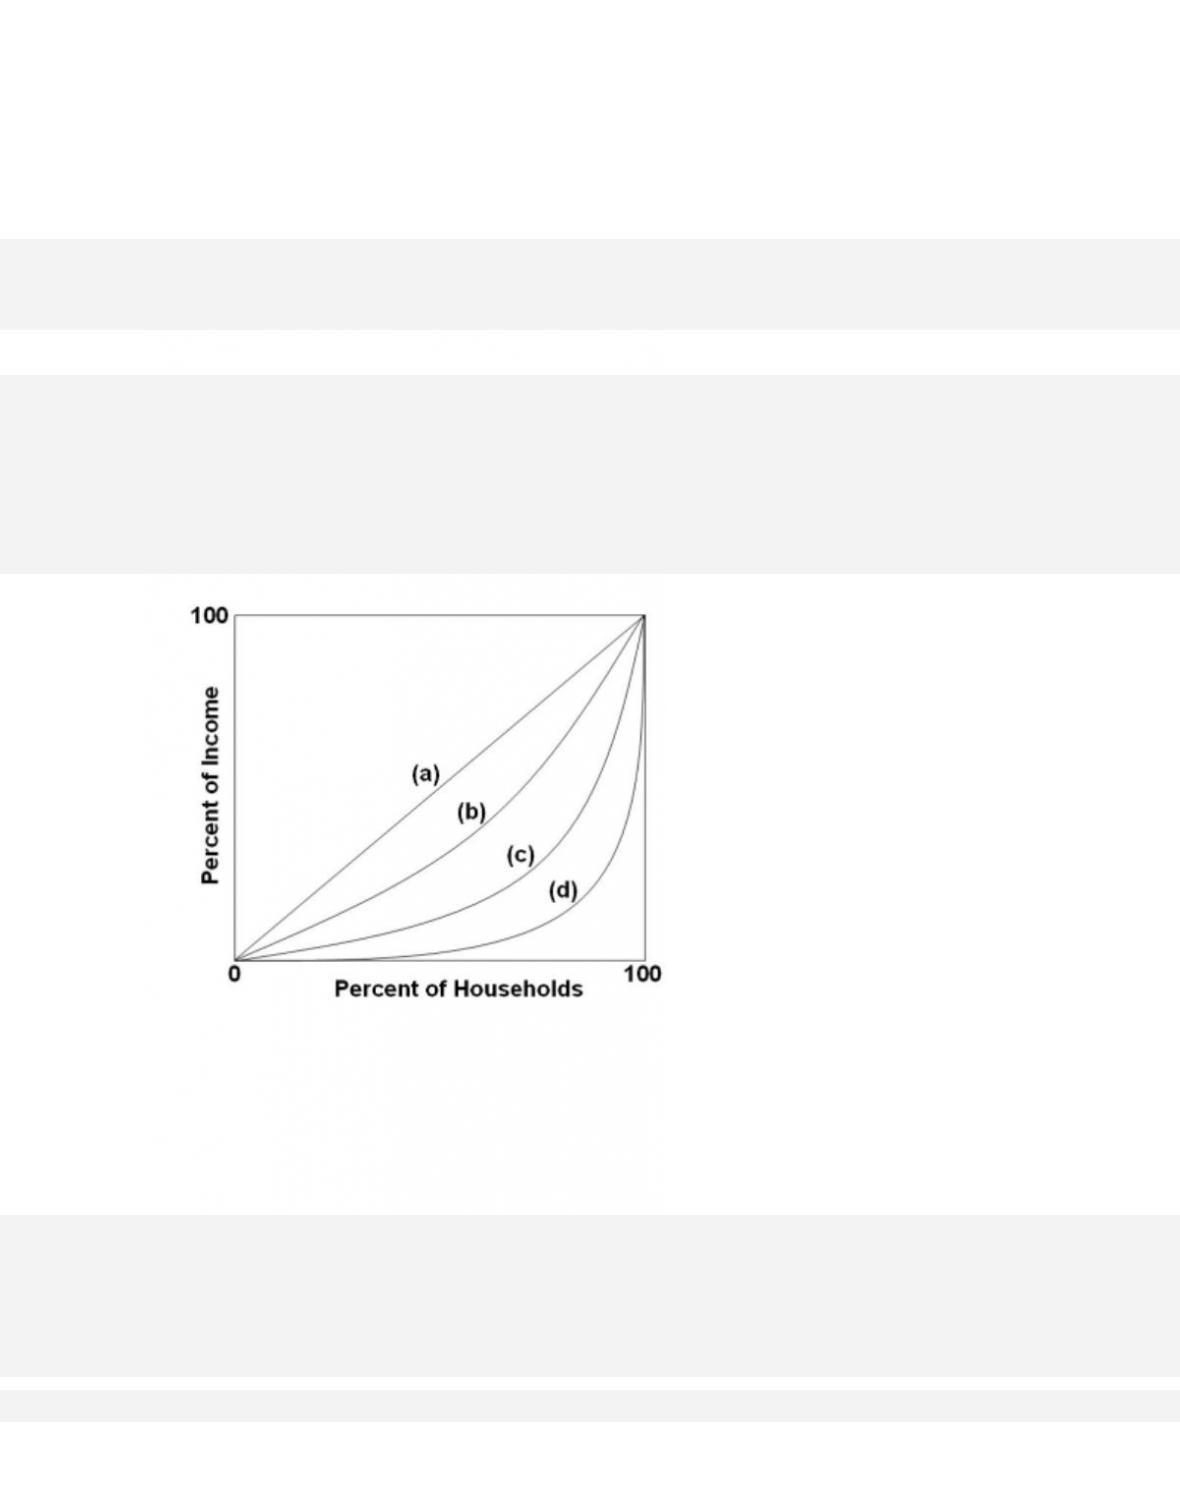
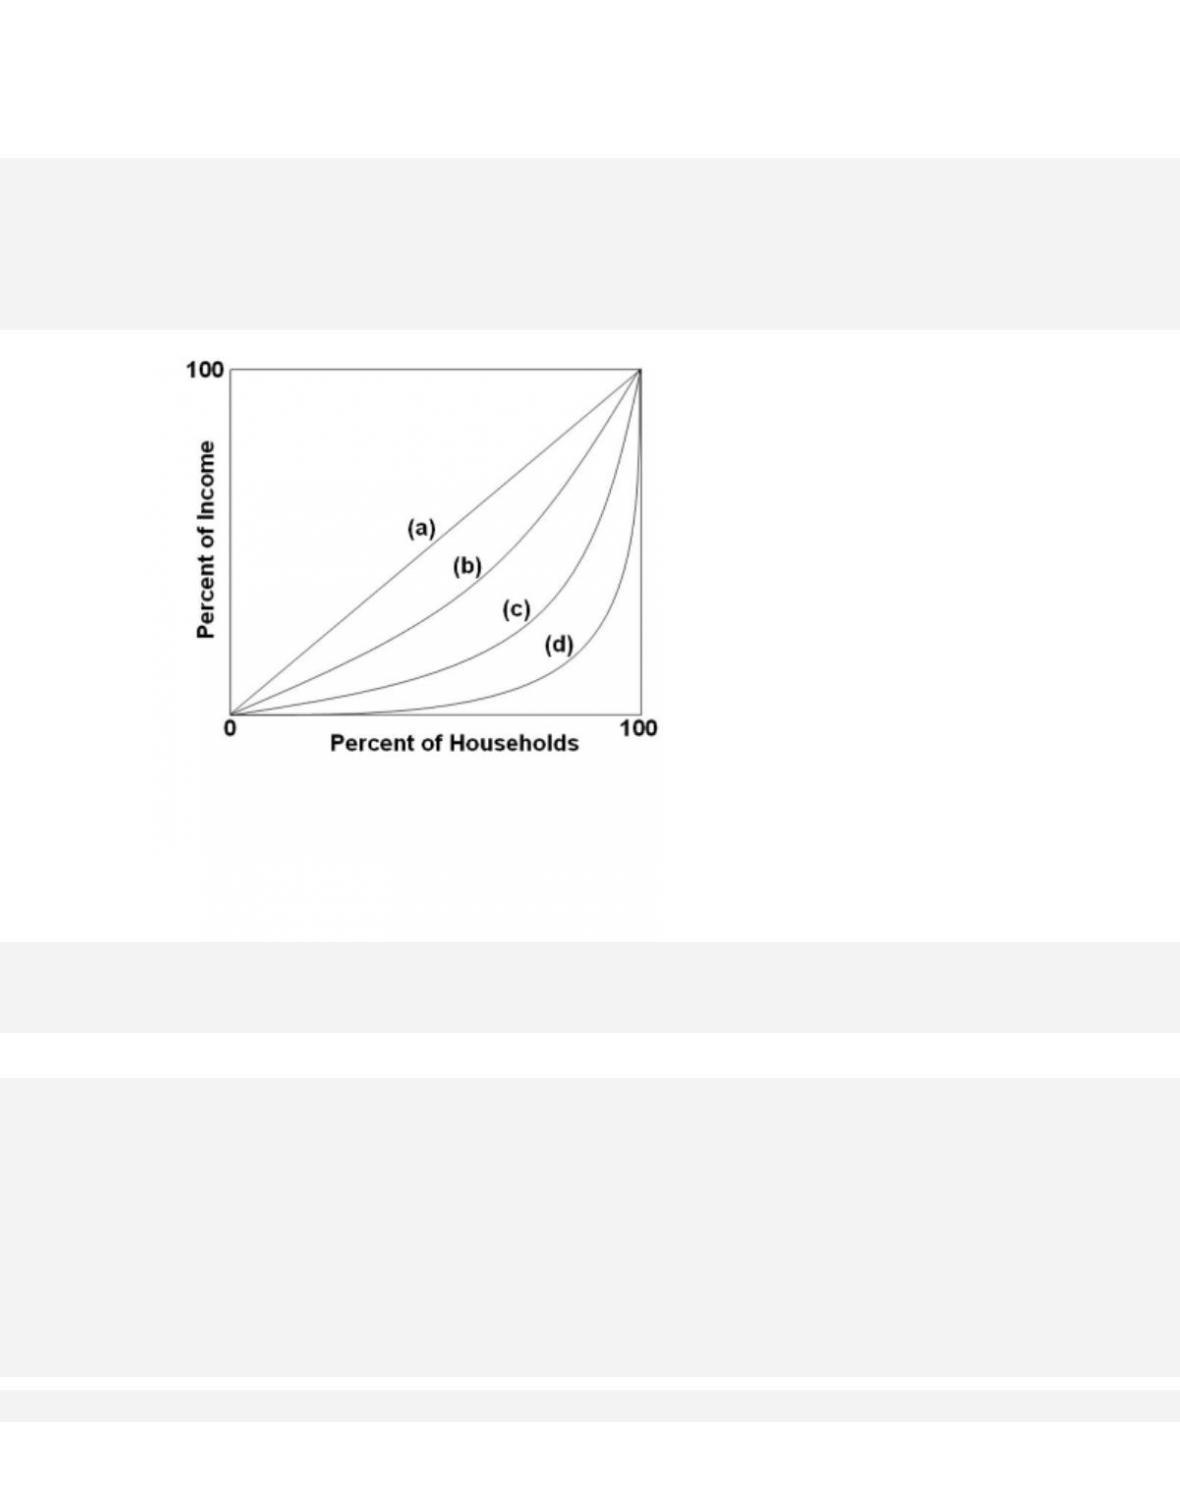
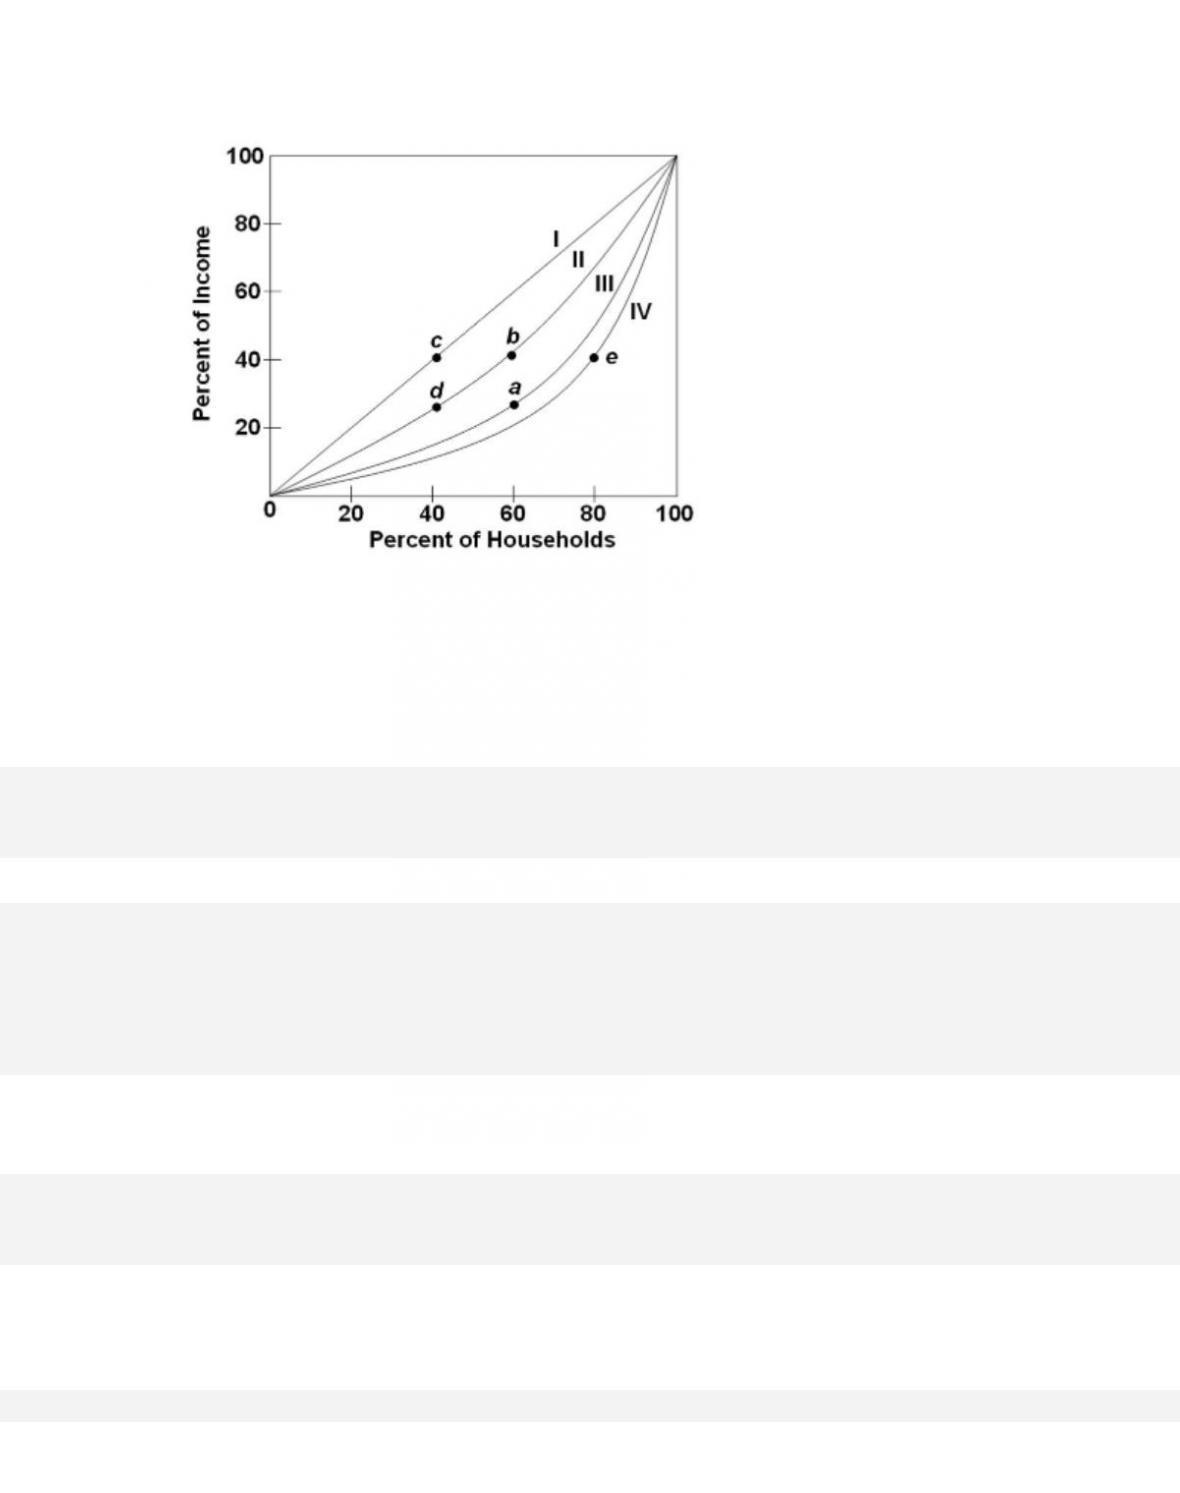
In Venezuela, there are a small number of extremely wealthy households and an extremely large
number of very poor households. If the United States were
represented in the figure by Lorenz
curve c, which curve would represent Venezuela?
23-84
Copyright © 2018 McGraw-Hill Education. All rights reserved. No reproduction or distribution without the prior
written consent of McGraw-Hill Education.
AACSB: Knowledge Application
Blooms: Understand
Diffic ul ty: 02 Medium
Learning Objective: 23-01 Explain how income inequality in the United States is measured
and described.
Test Bank: II
Topic: Facts about Income Inequality
185.
Refer to the figure. A nation that has an income distribution of perfect equality would be
represented by curve
186.
Refer to the graph. The Gini ratio would be greatest for which curve?
187.
Refer to the figure. The Gini ratio would be 0 for which curve?
188.
Refer to the graph. If the Lorenz curve shifted from (d) to (b), then the Gini ratio and the degree
of income inequality would
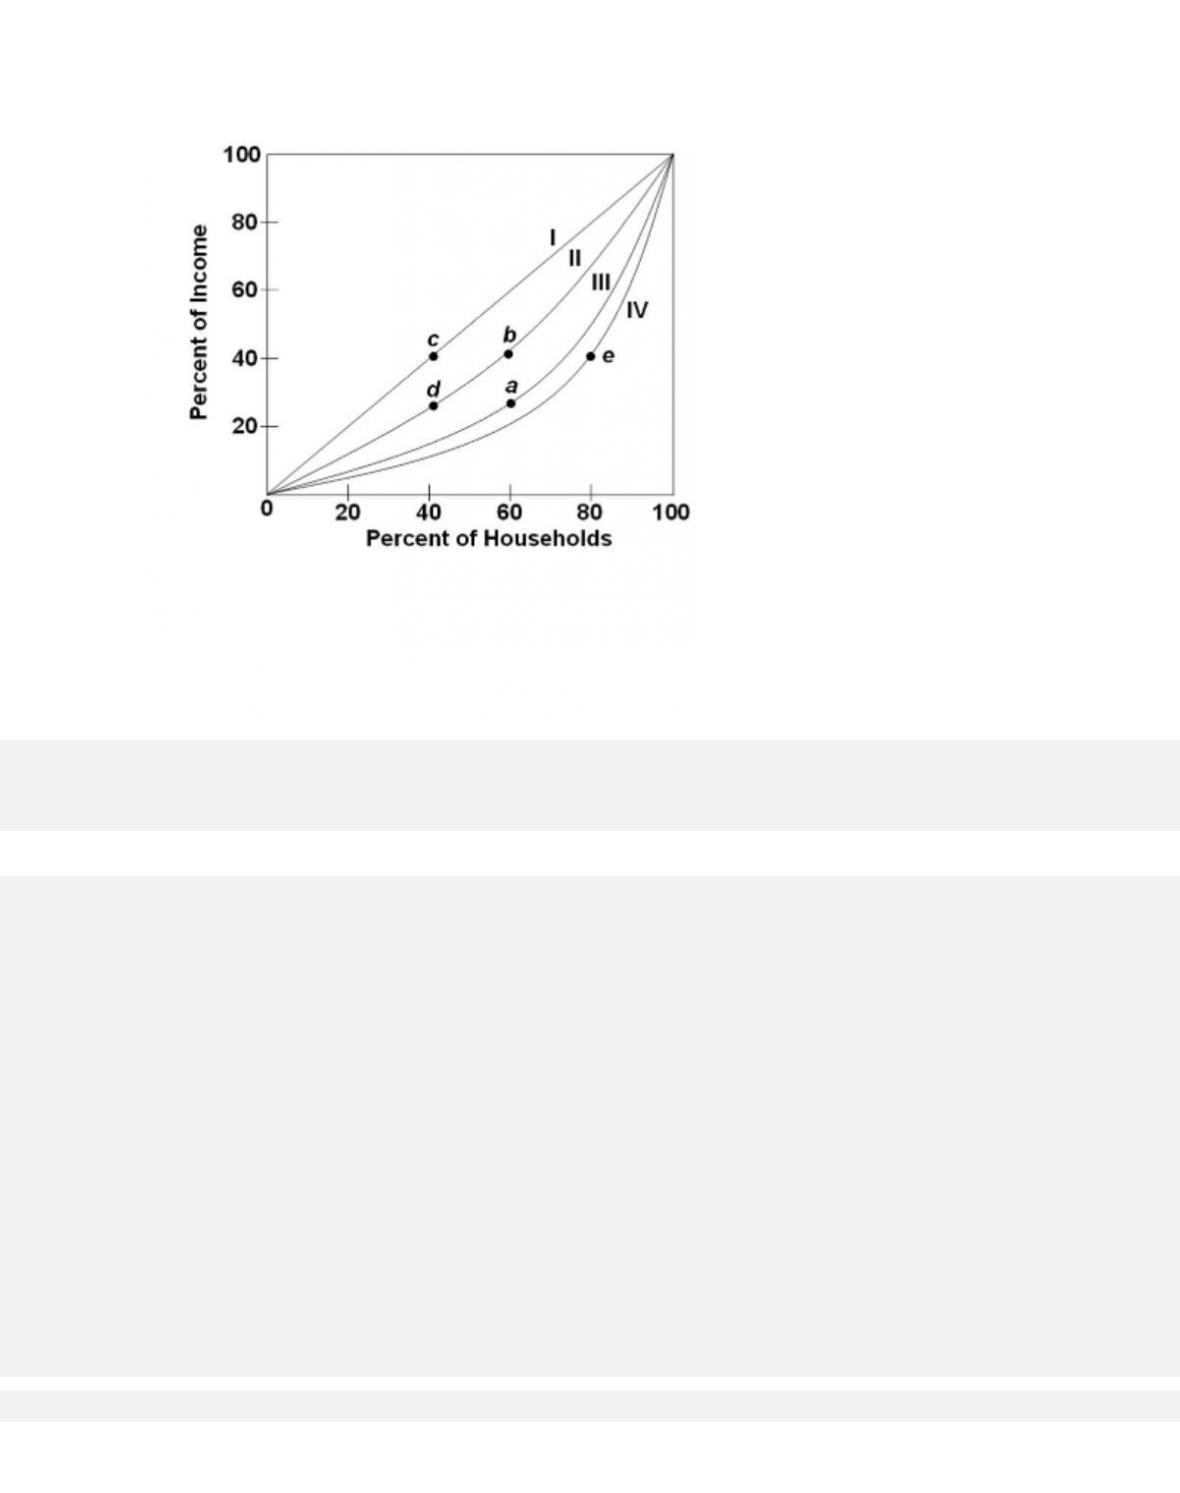
189.
Refer to the figure, which shows four different Lorenz curves (I, II, III, and IV). The greatest
increase in income inequality would occur with a shift in a Lorenz
curve from

190.
Refer to the figure, which shows four different Lorenz curves (I, II, III, and IV). What point
indicates that the lower 60 percent of the households receive only 40
percent of the nation's total
income?

191.
Refer to the figure, which shows four different Lorenz curves (I, II, III, and IV). The movement
from point b to point a in the graph would indicate that the
23-91
192.
Refer to the figure, which shows four different Lorenz curves (I, II, III, and IV). Which point
would indicate that the top 40 percent of households earned 60 percent
of the nation's total
income?
193.
The degree of inequality in income distribution based on single-year data is
AACSB: Knowledge Application
Ac ce s si b il it y :
Keyboard Navigation
23-92
Copyright © 2018 McGraw-Hill Education. All rights reserved. No reproduction or distribution without the prior
written consent of McGraw-Hill Education.
Blooms: Understand
Diffic ul ty: 02 Medium
Learning Objective: 23-01 Explain how income inequality in the United States is
measured and described.
Test Bank: II
Topic: Facts about Income Inequality
194.
Suppose that Jane earns $10,000 in year 1 and $15,000 in year 2, while Jim earns $15,000
in year 1 and $10,000 in year 2. Is there income equality for the two
individuals?
195.
Two major criticisms of the Bureau of Census data as a portrayal of the degree of income
inequality are that the income concept employed is too
196.
Which of the following is an example of a noncash transfer that is typically not included in
the income-distribution data?
23-93
Copyright © 2018 McGraw-Hill Education. All rights reserved. No reproduction or distribution without the prior
written consent of McGraw-Hill Education.
A.
Social Security benefits
B.
welfare assistance
C.
unemployment compensation
D. Medicare
197.
When the distribution of income is adjusted for noncash transfers, the income distribution
shows
198.
Which of the following contributes most to the reduction in income inequality?
23-94
Copyright © 2018 McGraw-Hill Education. All rights reserved. No reproduction or distribution without the prior
written consent of McGraw-Hill Education.
Test Bank: II
Topic:
Facts about Income Inequality
199.
The empirical data indicate that the tax system and the transfer programs of the government
200.
When taxes and transfer payments are taken into account, the distribution of income in the
United States
201.
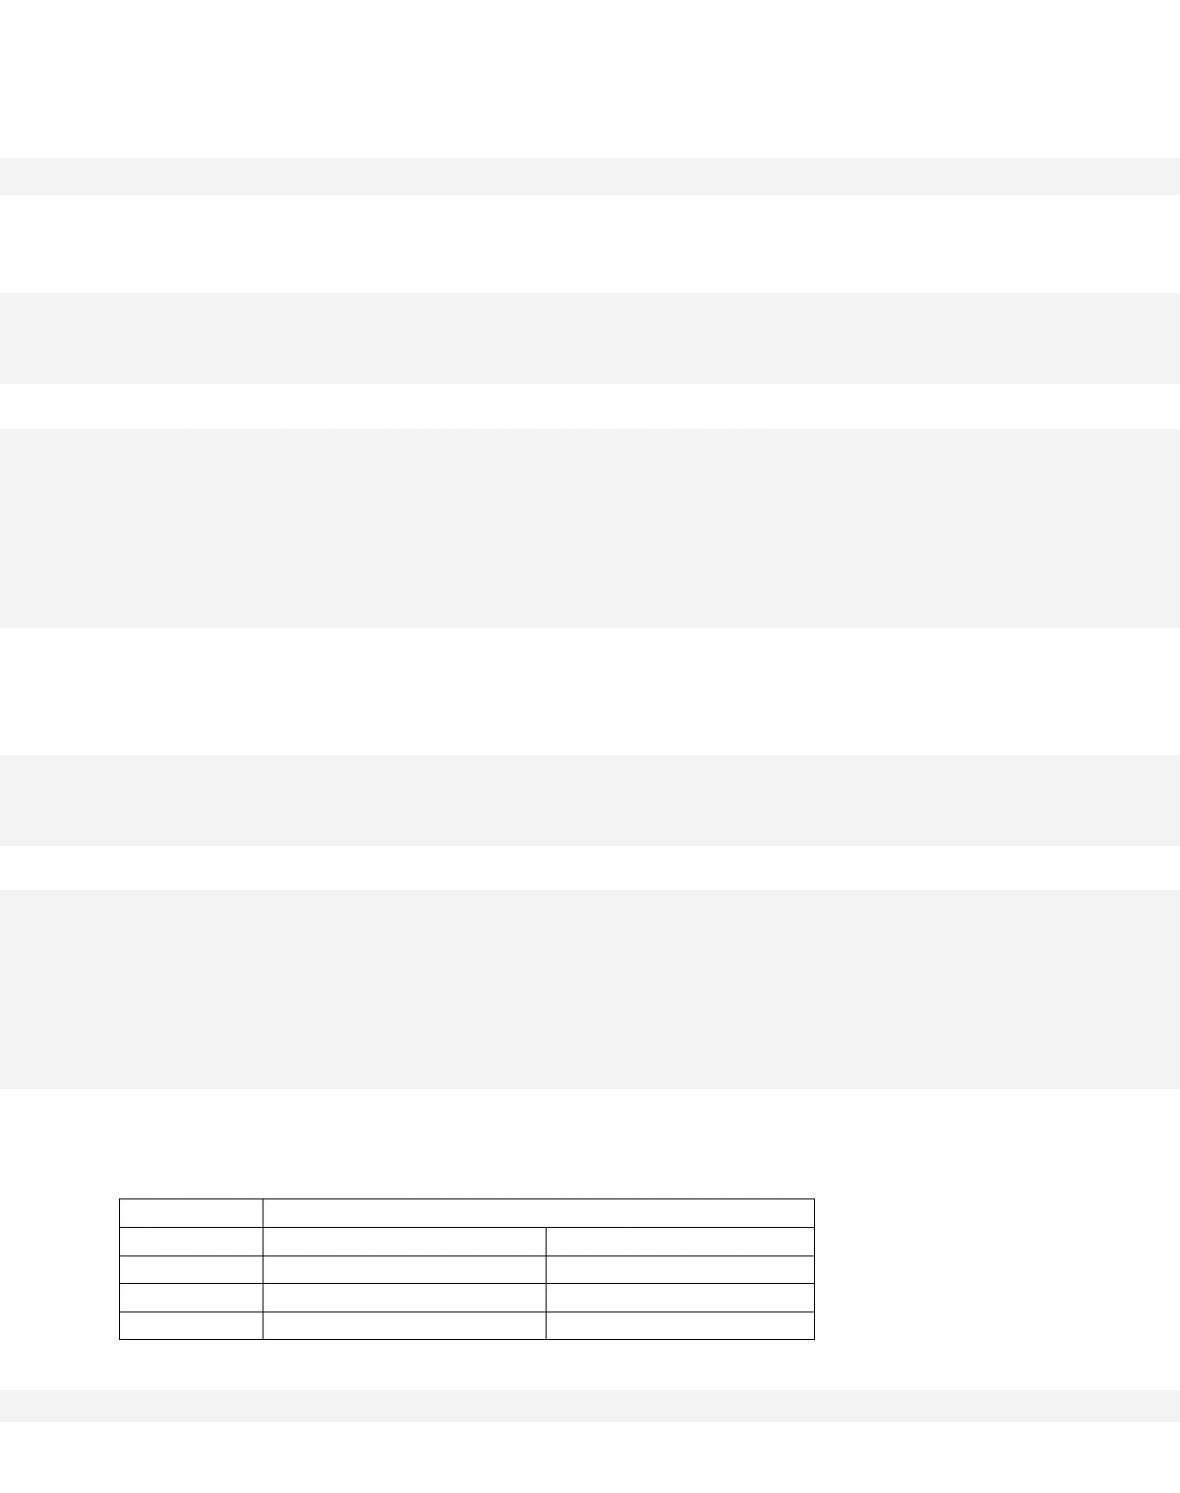
Households
Percentage of Income Received
Quintile
Before Taxes and Transfers
After Taxes and Transfers
Lowest 20%
1.1
4.9
Second 20%
7.0
10.5
Third 20%
14.0
15.9
Fourth 20%
23.0
22.8
Highest 20%
54.8
46.0
Refer to the table. The decline in percentage of income received from before taxes and transfers
to after taxes and transfers is greatest for the
202.
Households
Percentage of Income Received
Quintile
Before Taxes and Transfers
After Taxes and Transfers
Lowest 20%
1.1
4.9
Second 20%
7.0
10.5
Third 20%
14.0
15.9
Fourth 20%
23.0
22.8
Highest 20%
54.8
46.0
Refer to the table. The rise in percentage of income received from before taxes and transfers to
after taxes and transfers is greatest for the
23-96
Copyright © 2018 McGraw-Hill Education. All rights reserved. No reproduction or distribution without the prior
written consent of McGraw-Hill Education.
Blooms: Understand
Diffic ul ty: 02 Medium
Learning Objective: 23-01 Explain how income inequality in the United States is measured
and described.
Test Bank: II
Topic: Facts about Income Inequality
203.
One of the major causes of income inequality is differences in
204.
A cause of the unequal distribution of income in the United States is
205.
Which of the following would be a significant cause of income inequality in the United
States?

206.
Earnings received from wealth
207.
The wages and salaries that people earn differ partly because of differences in
208.
Which of the following would be an example of how pure luck contributes to income
inequality?
23-98
Copyright © 2018 McGraw-Hill Education. All rights reserved. No reproduction or distribution without the prior
written consent of McGraw-Hill Education.
C. selection as winner of a state lottery
D. admission to a state university
209.
Which of the following is not one of the causes of the unequal distribution of income in the
United States?
210.
The difference between income and wealth is that income
211.
Which of the following would be considered part of income?

23-99
Copyright © 2018 McGraw-Hill Education. All rights reserved. No reproduction or distribution without the prior
written consent of McGraw-Hill Education.
A. wages and salaries
B.
the value of a house
C.
corporate stock holdings
D.
money in a bank account
212.
Which of the following would be considered part of wealth?
213.
Since 1975, the distribution of household income in the United States has
214.
Which of the following is a cause of growing income inequality in the United States since
1975?
215.
Which of the following is a major reason for the growing income inequality in the United
States since 1975?
216.
Reasons for the growing income inequality in the United States since 1975 include the
following, except


