
23–61
Copyright © 2018 McGraw-Hill Education. All rights reserved. No reproduction or distribution without the prior
written consent of McGraw-Hill Education.
A. may either increase or reduce real domestic output, depending on what happens to the level of
wages.
B. will increase real domestic output.
C.
will have no effect on real domestic output.
D.
will reduce real domestic output.
130.
As applied to gender discrimination, the crowding model of occupational segregation
131.
Discrimination creates a
23–62
Copyright © 2018 McGraw-Hill Education. All rights reserved. No reproduction or distribution without the prior
written consent of McGraw-Hill Education.
hiring decisions and wages.
Test Bank: I
Topic:
Economic Analysis of Discrimination
132.
Discrimination
133.
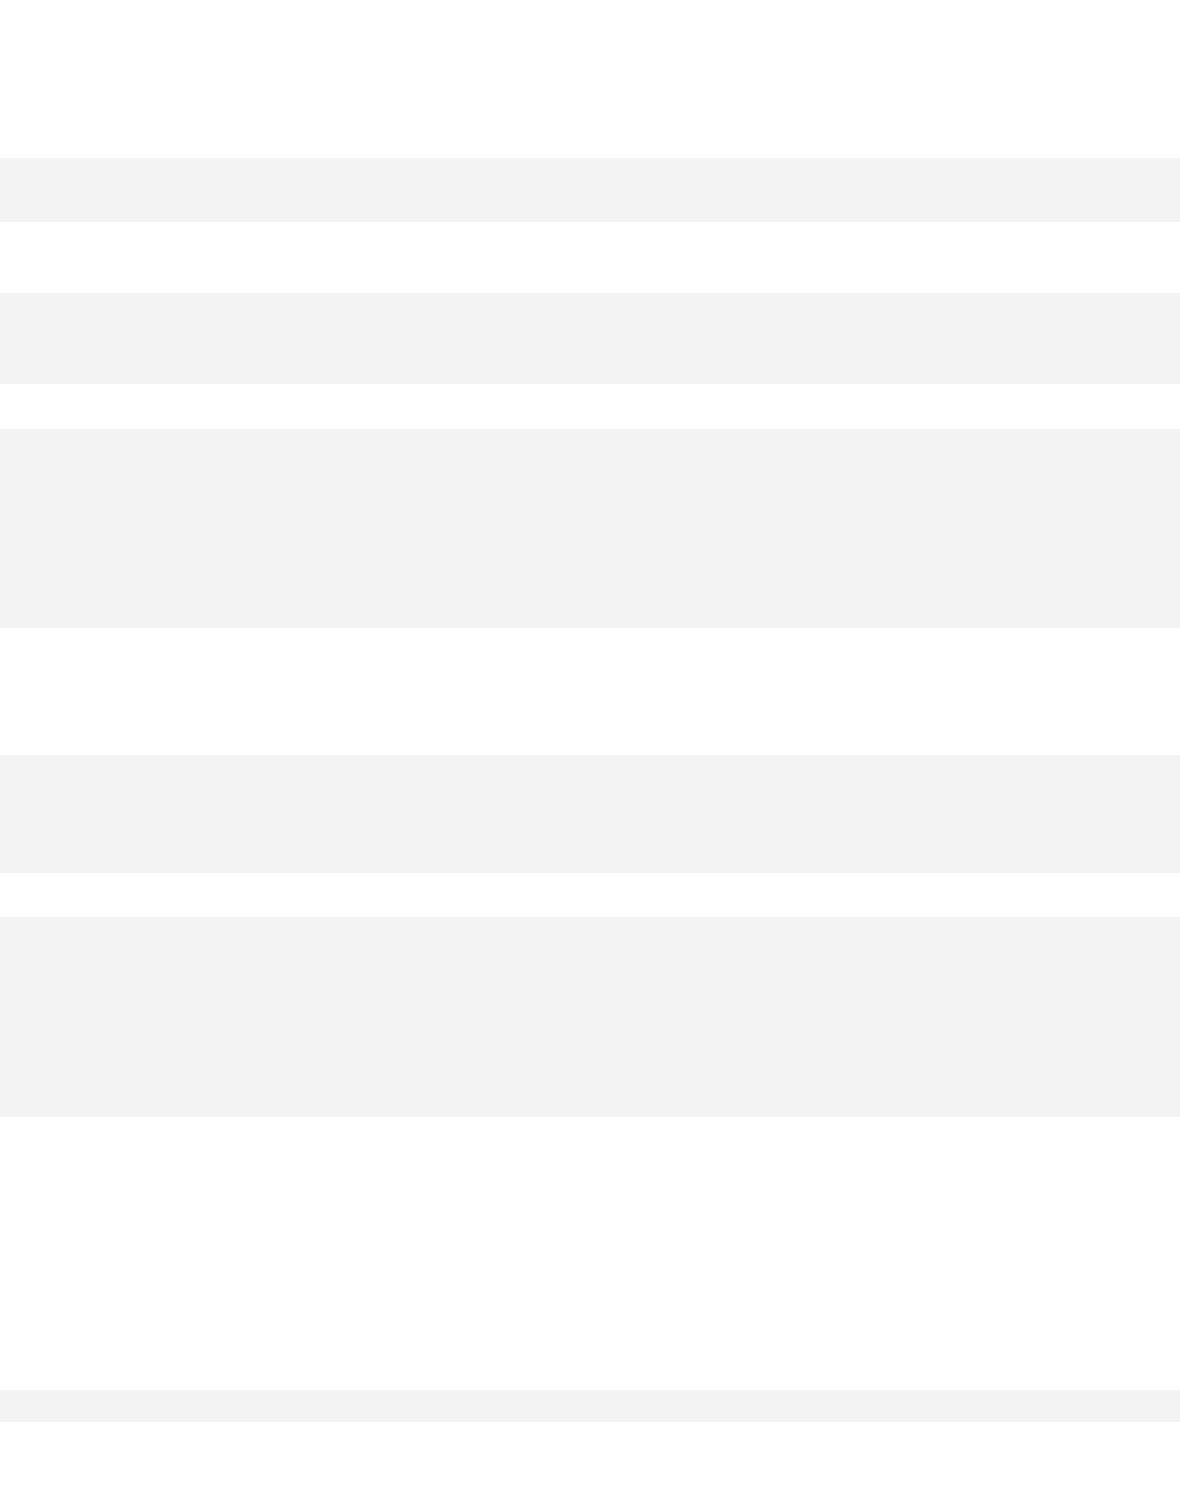
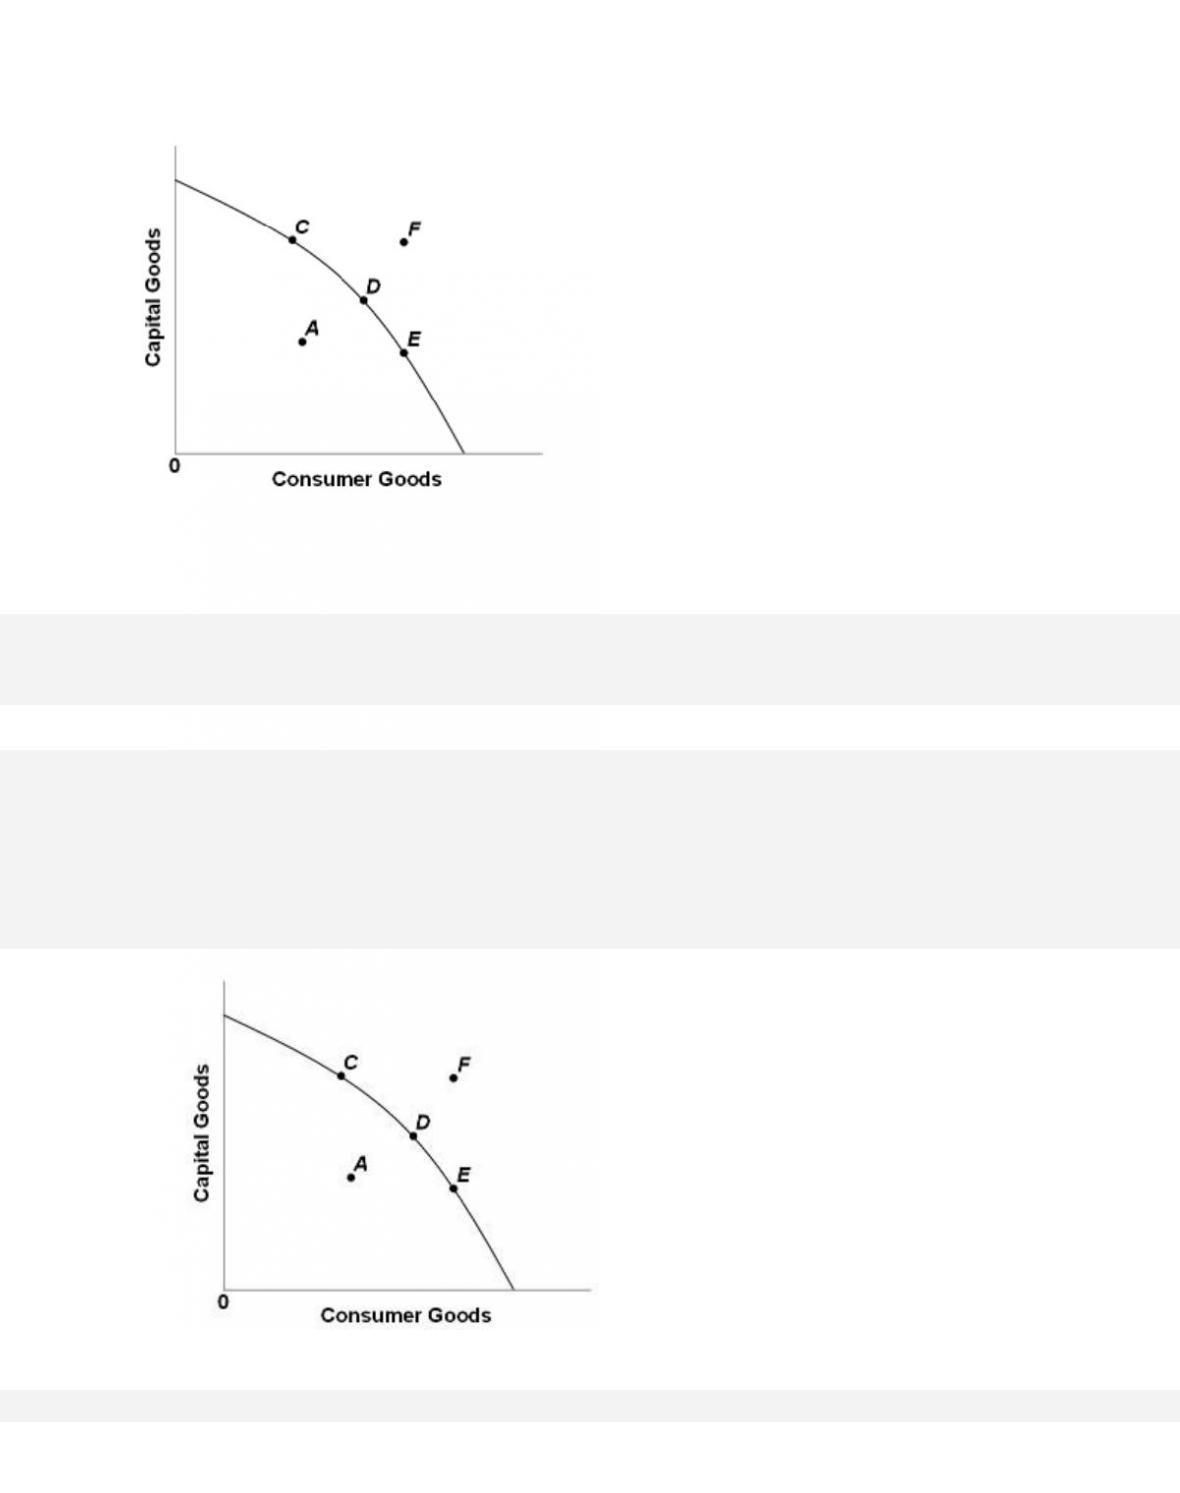
Economic discrimination puts the economy inside its production possibilities curve because
discrimination
134.
23–63
In the diagram, economic discrimination is best represented by point
135.
In the diagram, the elimination of discrimination is best represented by
136.
(Consider This) According to economists Krueger and Perri,
137.
(Consider This) According to The Economist magazine, growing income inequality is less
of a concern because
138.
(Consider This) In “Slicing the Pizza,” the shrinkage of the pizza refers to the
139.
(Consider This) The main focus of the vignette “Slicing the Pizza” is the
140.
(Consider This) A “welfare cliff” refers to a situation where

23–66
Copyright © 2018 McGraw-Hill Education. All rights reserved. No reproduction or distribution without the prior
written consent of McGraw-Hill Education.
B. a welfare recipient’s total income falls if they earn more money from work.
C.
government support for income assistance falls when the unemployment rate falls below a
preset value.
D.
welfare benefits are withdrawn when a recipient hits the five-year program limit.
141.
(Consider This) The main problem with welfare cliffs is that they
142.
(Consider This) Sandy currently earns wages of $20,000 per year. In her state, that qualifies
her for $5,000 worth of housing credits, but those credits are withdrawn
for anyone earning
$22,000 per year or more. If Sandy were to find a part-time job that earned her $3,000 per year,
23–67
Copyright © 2018 McGraw-Hill Education. All rights reserved. No reproduction or distribution without the prior
written consent of McGraw-Hill Education.
Learning Objective: 23–06 Identify the major components of the income-maintenance
program in the United States.
Test Bank: I
Topic: The U.S. Income-Maintenance System
143.
(Last Word) Between 1995 and 2007 in the United States,
144.
(Last Word) In 2010, the wealthiest 1 percent of U.S. households held about percent of U.S.
household wealth.
145.
(Last Word) Median wealth in the United States in 2013
23–68
Copyright © 2018 McGraw-Hill Education. All rights reserved. No reproduction or distribution without the prior
written consent of McGraw-Hill Education.
Ac ces si bil ity :
Keyboard Navigation
Blooms: Understand
Diffic ulty: 02 Medium
Learning Objective: 23–02 Discuss the extent and sources of income inequality.
Test Bank: I
Topic:
Causes of Income Inequality
True / False Questions
146.
Government transfer programs result in a U.S. Lorenz curve that is closer to the diagonal
line than would be the case without the programs.
147.
The closer the Lorenz curve is to the diagonal, the greater is the degree of income inequality.
148.
The standard data on income distribution do not include the value of noncash transfers as
income.
23–69
Copyright © 2018 McGraw-Hill Education. All rights reserved. No reproduction or distribution without the prior
written consent of McGraw-Hill Education.
Ac ces si bil ity :
Keyboard Navigation
Blooms: Understand
Diffic ulty: 02 Medium
Learning Objective: 23–01 Explain how income inequality in the United States is measured
and described.
Test Bank: I
Topic: Facts about Income Inequality
149.
A curve showing the quintile distribution of a nation’s income is called the Gini curve.
150.
In the United States since 1975, the poor have gotten poorer and the rich have gotten richer
in both relative and absolute terms.
151.
The top 20 percent of U.S. income earners receive nearly 80 percent of total U.S. income.
23–70
Copyright © 2018 McGraw-Hill Education. All rights reserved. No reproduction or distribution without the prior
written consent of McGraw-Hill Education.
Learning Objective: 23–02 Discuss the extent and sources of income inequality.
Test Bank: I
Topic:
Causes of Income Inequality
T op ic :
Facts about Income Inequality
152.
Currently over 90 percent of all workers in the United States are covered by Social Security.
153.
Unemployment compensation is financed by taxes levied on employers.
154.
TANF stands for Temporary Assistance for Needy Families.

155.
After the implementation of TANF, the U.S. welfare rolls fell by more than one-half
between 1996 and 2007.
156.
The U.S. poverty rate for the elderly (65 and over) is higher than for the general population.
157.
The U.S. poverty rate was considerably lower in 2014 than in 1960.
158.
Labor market discrimination increases the size of the nation‘s GDP by promoting
specialization on the basis of race.

159.
An employer (biased against African Americans) whose discrimination coefficient is $5
will hire only whites if the actual African-American–white wage gap is $7.
160.
A reduction in the collective discrimination coefficients of employers will increase the wage
rate of those discriminated against but reduce their employment.
161.
Statistical discrimination is also known as occupational discrimination.
23–73
Copyright © 2018 McGraw-Hill Education. All rights reserved. No reproduction or distribution without the prior
written consent of McGraw-Hill Education.
Blooms: Understand
Diffic ulty: 02 Medium
Learning Objective: 23–07 Discuss labor market discrimination and how it might affect
hiring decisions and wages.
Test Bank: I
Topic: Economic Analysis of Discrimination
162.
The crowding model of occupational segregation predicts that domestic output will increase
if occupational segregation is ended.
Multiple Choice Questions
163.
The average household income in the United States in 2014 was close to
164.
In 2014, the portion of the U.S. population that lived in poverty was
23–74
Copyright © 2018 McGraw-Hill Education. All rights reserved. No reproduction or distribution without the prior
written consent of McGraw-Hill Education.
D. about 25 percent.
165.
Based on annual before-tax incomes data from the Bureau of Census, about what percentage
of U.S. households had annual incomes of $100,000 or more in 2014?
166.
In 2014, about what percentage of U.S. households had annual before-tax incomes of less
than $15,000?

167.
The percentage of total before-tax household income received by the lowest 20 percent of
households in 2014 was about percent, while the top 20 percent
received about percent.
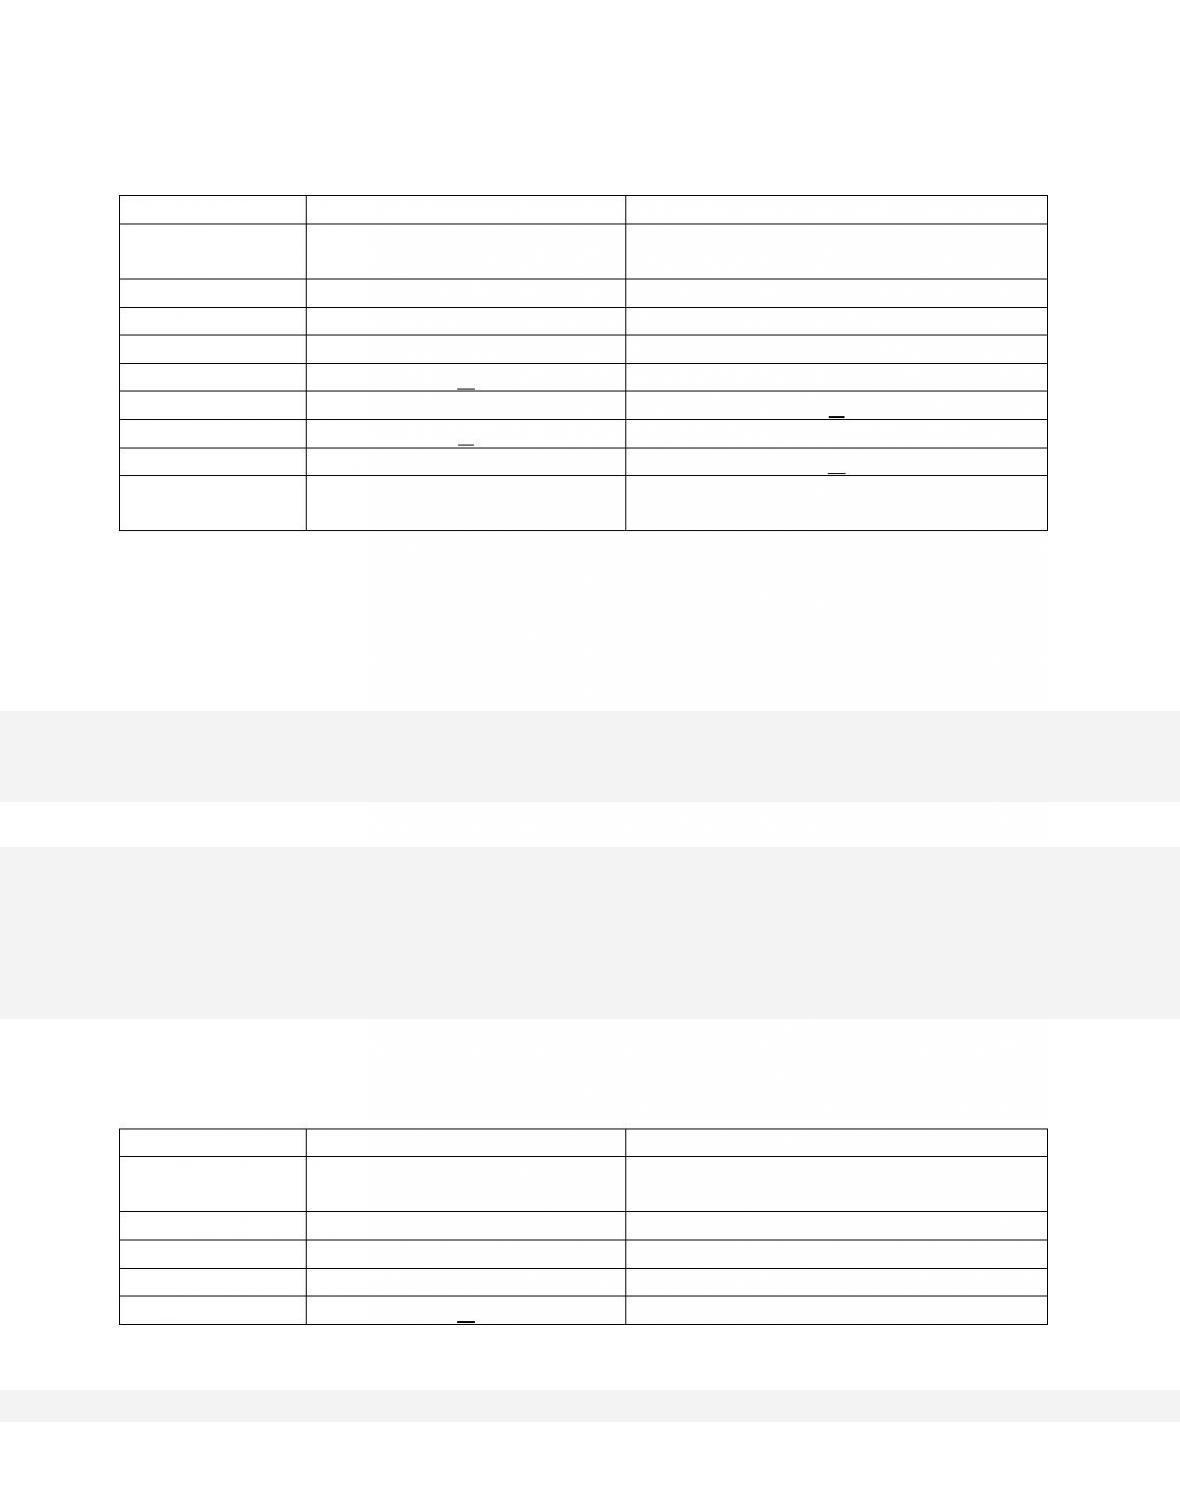
168.
(1)
(2)
(3)
Personal Income
Class
Percentage Of All Households
In This Class
Percentage Of All Households In This
And All Lower Classes
Under $10,000
6
6
$10,000-$14,999
5
11
$15,000-$24,999
12
23
$25,000-$34,999
A
35
$35,000-$49,999
16
C
$50,000-$74,999
B
72
$75,000-$99,999
13
D
$100,000 and
over
15
100
Refer to the table. What percentage of households made less than $15,000?

23–76
Copyright © 2018 McGraw-Hill Education. All rights reserved. No reproduction or distribution without the prior
written consent of McGraw-Hill Education.
AACSB: Knowledge Application
Blooms: Understand
Diffic ulty: 02 Medium
Learning Objective: 23–01 Explain how income inequality in the United States is
measured and described.
Test Bank: II
Topic: Facts about Income Inequality
169.
(1)
(2)
(3)
Personal Income
Class
Percentage Of All Households
In This Class
Percentage Of All Households In This
And All Lower Classes
Under $10,000
6
6
$10,000-$14,999
5
11
$15,000-$24,999
12
23
$25,000-$34,999
A
35
$35,000-$49,999
16
C
$50,000-$74,999
B
72
$75,000-$99,999
13
D
$100,000 and
over
15
100
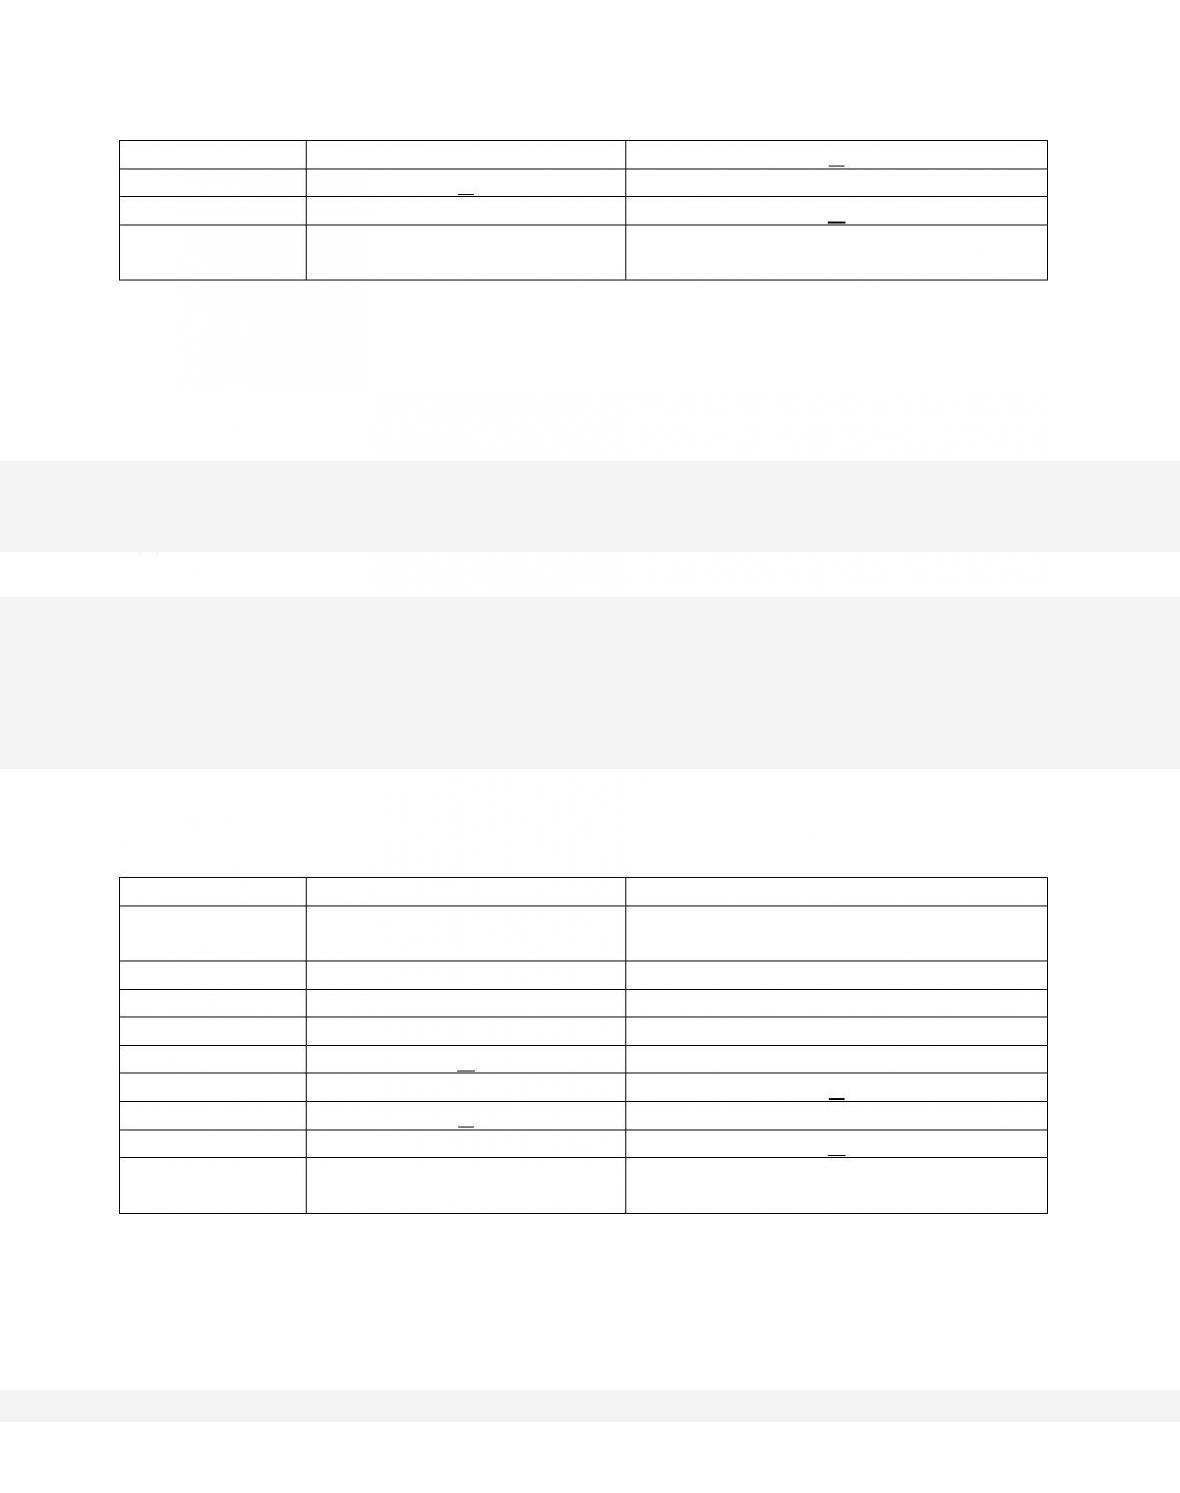
Refer to the table. What percentage of households made $35,000 or more?
170.
23–77
(1)
(2)
(3)
Personal Income
Class
Percentage Of All Households
In This Class
Percentage Of All Households In This
And All Lower Classes
Under $10,000
6
6
$10,000-$14,999
5
11
$15,000-$24,999
12
23
$25,000-$34,999
A
35
$35,000-$49,999
16
C
$50,000-$74,999
B
72
$75,000-$99,999
13
D
$100,000 and
over
15
100
Refer to the table. What percentage should be reported in blank A of column 2?
171.
(1)
(2)
(3)
Personal Income
Class
Percentage Of All Households
In This Class
Percentage Of All Households In This
And All Lower Classes
Under $10,000
6
6
$10,000-$14,999
5
11
$15,000-$24,999
12
23
$25,000-$34,999
A
35
23–78
$35,000-$49,999
16
C
$50,000-$74,999
B
72
$75,000-$99,999
13
D
$100,000 and
over
15
100
Refer to the table. What percentage should be reported in blank C of column 3?
172.
(1)
(2)
(3)
Personal Income
Class
Percentage Of All Households
In This Class
Percentage Of All Households In This
And All Lower Classes
Under $10,000
6
6
$10,000-$14,999
5
11
$15,000-$24,999
12
23
$25,000-$34,999
A
35
$35,000-$49,999
16
C
$50,000-$74,999
B
72
$75,000-$99,999
13
D
$100,000 and
over
15
100
Refer to the table. What percentage of households made $50,000 or more?

173.
A Lorenz curve is a graph that shows
174.
A Lorenz curve showing perfect equality in the distribution of income
23–80
Copyright © 2018 McGraw-Hill Education. All rights reserved. No reproduction or distribution without the prior
written consent of McGraw-Hill Education.
Topic:
Facts about Income Inequality
175.
The greater the degree of inequality in the distribution of income, the more bowed will be
the Lorenz curve toward the
176.
The degree of inequality in the distribution of income in an economy is depicted in a(n)
177.
The Gini ratio, or Gini coefficient, is a measure of the