Unlock document.
This document is partially blurred.
Unlock all pages and 1 million more documents.
Get Access

23-41
Copyright © 2018 McGraw-Hill Education. All rights reserved. No reproduction or distribution without the prior
written consent of McGraw-Hill Education.
AACSB: Knowledge Application
Accessibility:
Keyboard Navigation
Blooms: Remember
Di f f i c u l t y : 01 Easy
Learning Objective: 23-06 Identify the major components of the income-maintenance
program in the United States.
Test Bank: I
Topic:
The U.S. Income-Maintenance System
90.
The earned-income tax credit
91.
Which one of the following is not a cash transfer program?
92.
Which one of the following would increase income inequality as measured by official census
data and the quintile distribution?

93.
Which of the following would move the Lorenz curve closer to the diagonal?
94.
The TANF program

23-43
Copyright © 2018 McGraw-Hill Education. All rights reserved. No reproduction or distribution without the prior
written consent of McGraw-Hill Education.
program in the United States.
Test Bank: I
Topic:
The U.S. Income-Maintenance System
95.
The TANF program is designed to
96.
Since its inception in 1996, the Temporary Assistance for Needy Families (TANF) program
has
97.
By December 2009, the recession that began in December 2007

23-44
Copyright © 2018 McGraw-Hill Education. All rights reserved. No reproduction or distribution without the prior
written consent of McGraw-Hill Education.
AACSB: Knowledge Application
Ac c e ssi b i lit y: Keyboard Navigation
Blooms: Remember
Di f f i c u l t y : 01 Easy
Learning Objective: 23-06 Identify the major components of the income-maintenance
program in the United States.
Test Bank: I
Topic:
The U.S. Income-Maintenance System
98.
The Supplemental Nutrition Assistance Program (SNAP)
99.
African-American worker Jackson earns $30,000 per year; white worker Johnson earns
$40,000 per year. On the basis of this information, we can conclude that
100.
For an employer biased against African Americans, the discrimination coefficient d

101.
Which of the following employers is the most prejudiced? Employer
102.
In the taste-for-discrimination model,

23-46
Copyright © 2018 McGraw-Hill Education. All rights reserved. No reproduction or distribution without the prior
written consent of McGraw-Hill Education.
hiring decisions and wages.
Test Bank: I
Topic:
Economic Analysis of Discrimination
103.
Assume that all workers are equally productive, but the wage rate for men is $12, compared
to $9 for women. An employer who employs only male workers must
have a discrimination
coefficient of
104.
An employer whose discrimination coefficient is $4 will
105.
Suppose an employer is biased against African Americans. If his discrimination coefficient
is $2, the employer will

23-47
Copyright © 2018 McGraw-Hill Education. All rights reserved. No reproduction or distribution without the prior
written consent of McGraw-Hill Education.
wage differential is more than $2.
B.
randomly hire African-American and white workers if the actual African-American–white
wage differential is less than $2.
C.
hire only African Americans if the actual African-American–white wage differential is less
than $2.
D. hire only whites if the actual African-American–white wage differential is less than $2.
106.
If there is a widespread bias against African-American workers, an increase in the
collective discrimination coefficients of employers will
107.
In a labor market generally biased against Hispanics, a reduction in the collective
discrimination coefficients of employers will
23-48
Copyright © 2018 McGraw-Hill Education. All rights reserved. No reproduction or distribution without the prior
written consent of McGraw-Hill Education.
C. increase the Hispanic wage rate, increase Hispanic employment, and increase the actual
Hispanic-white wage ratio.
D. increase the Hispanic wage rate, reduce Hispanic employment, and increase the actual
Hispanic-white wage ratio.
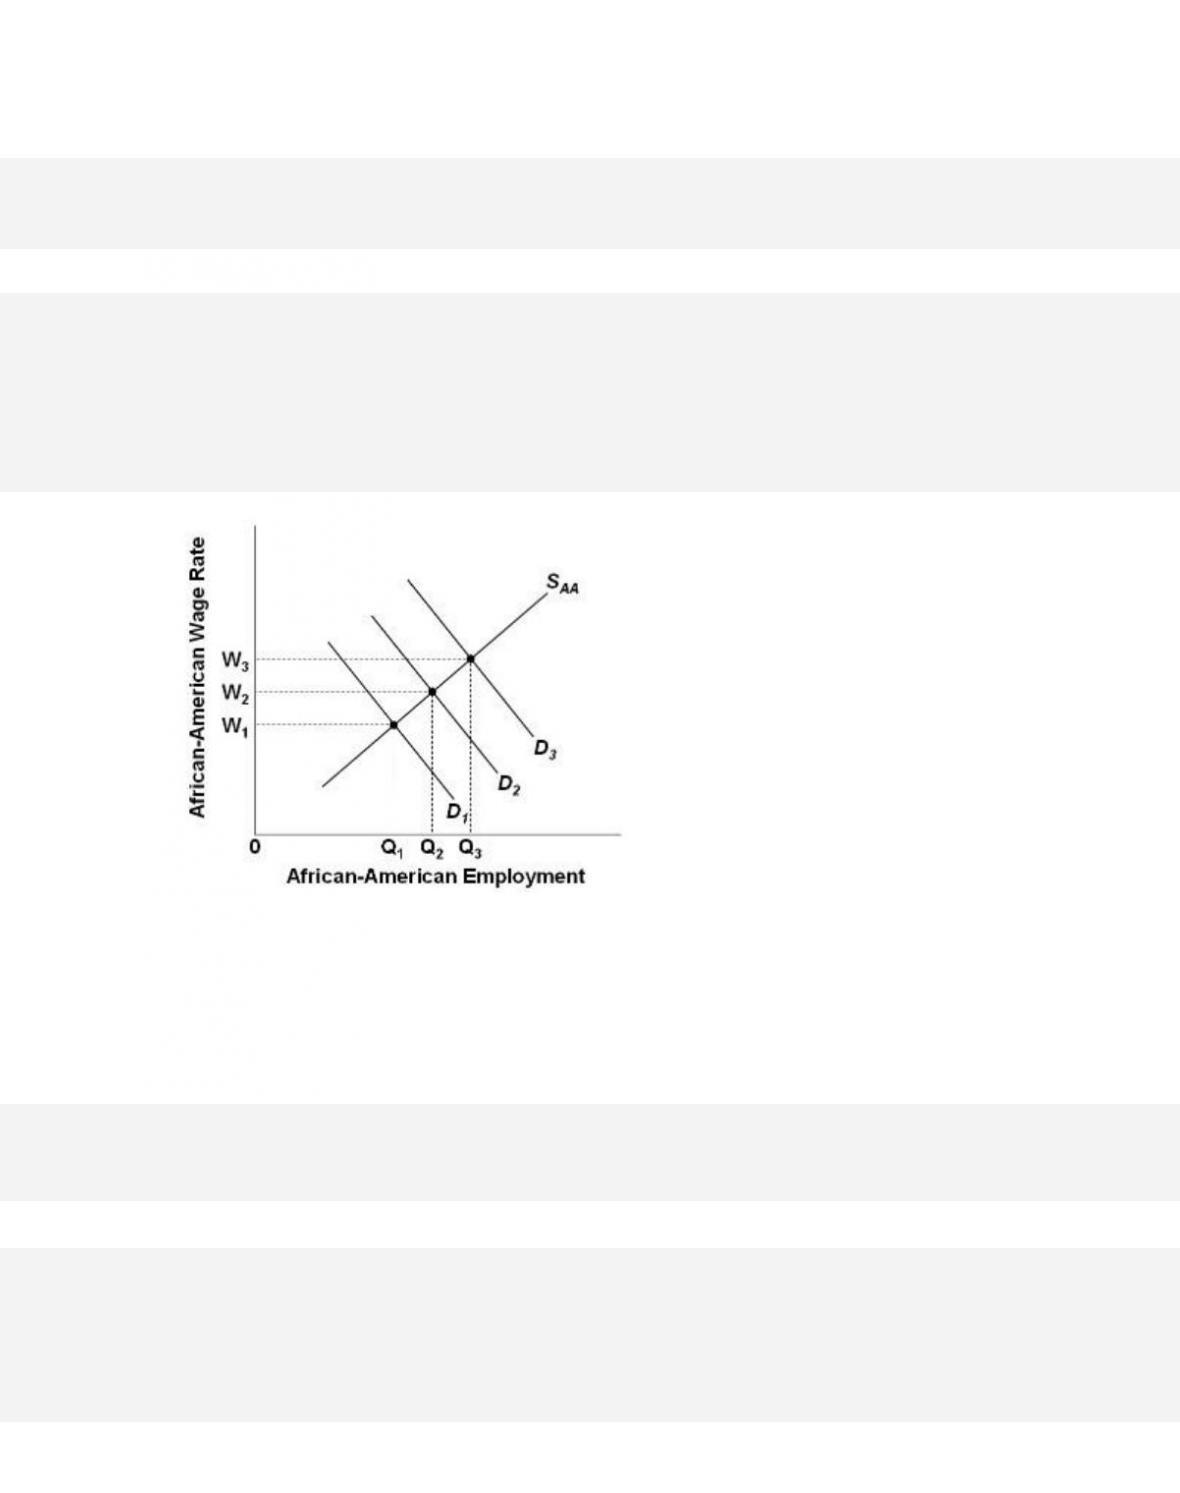
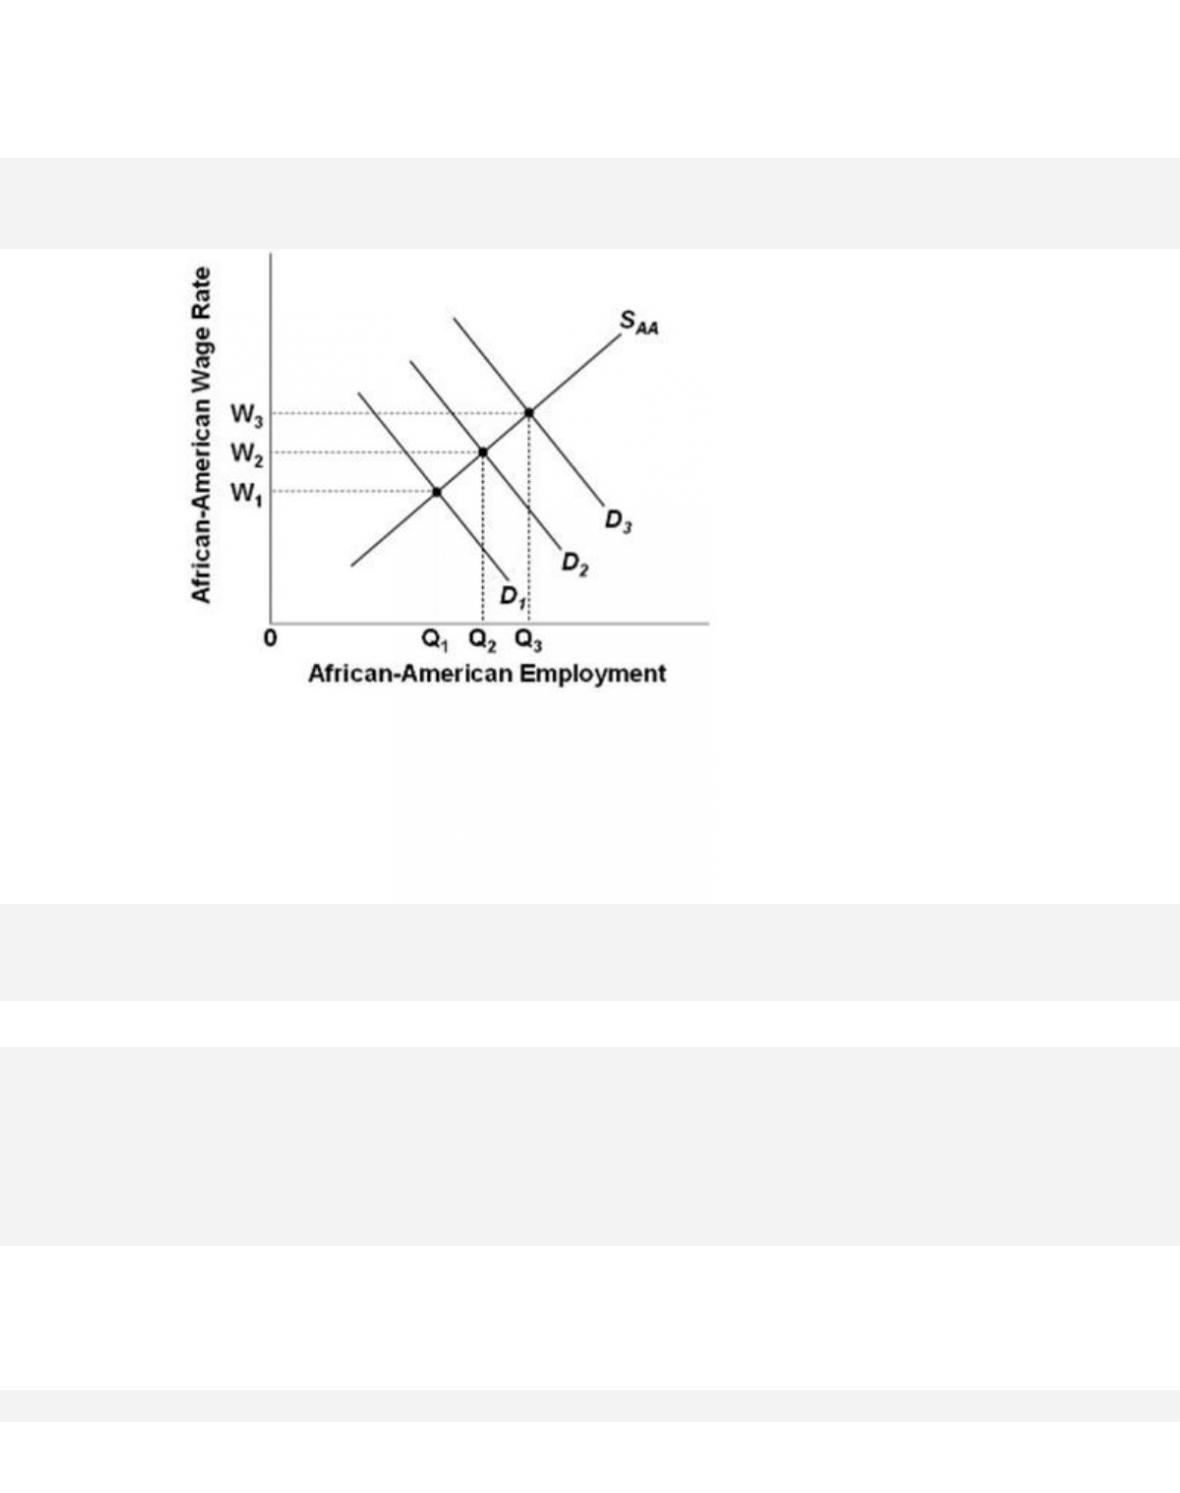
108.
Refer to the diagram. Which of the following would be consistent with an increase in racial
prejudice against African Americans and thus an increase in the
discrimination coefficients of
employers, taken as a group?
23-49
Copyright © 2018 McGraw-Hill Education. All rights reserved. No reproduction or distribution without the prior
written consent of McGraw-Hill Education.
hiring decisions and wages.
Test Bank: I
Topic: Economic Analysis of Discrimination
Type: Graph
109.
Refer to the diagram. Which of the following would be consistent with a decrease in racial
prejudice against African Americans and thus a decrease in the
discrimination coefficients of
employers, taken as a group?
110.
In the taste-for-discrimination model,

23-50
Copyright © 2018 McGraw-Hill Education. All rights reserved. No reproduction or distribution without the prior
written consent of McGraw-Hill Education.
A.
a decline in discrimination will reduce the actual African-American–white wage ratio.
B.
an increase in collective discrimination coefficients of employers will reduce the demand for
African-American workers, decrease the African-American wage, and
increase African-
American employment.
C.
firms that discriminate will have lower costs than firms that do not discriminate.
D. competitive forces will tend to reduce discrimination in the very long run.
111.
An implication of the taste-for-discrimination model is that
112.
An employer is prejudiced, prefers to hire white rather than Hispanic workers, and is
willing to pay higher wages to obtain white workers. This illustrates

23-51
Copyright © 2018 McGraw-Hill Education. All rights reserved. No reproduction or distribution without the prior
written consent of McGraw-Hill Education.
Blooms: Understand
Dif fi cul ty: 02 Medium
Learning Objective: 23-07 Discuss labor market discrimination and how it might affect
hiring decisions and wages.
Test Bank: I
Topic:
Economic Analysis of Discrimination
113.
Statistical discrimination refers to
114.
Statistical discrimination
115.
Insurance companies require male drivers under age 25 to pay higher insurance rates than
female drivers under age 25. Craig Raymond, however, is a safer driver
than the average female

driver under age 25. Craig's higher insurance rate reflects
116.
Statistical discrimination
117.
Which of the following is an example of statistical discrimination?

23-53
Copyright © 2018 McGraw-Hill Education. All rights reserved. No reproduction or distribution without the prior
written consent of McGraw-Hill Education.
AACSB: Knowledge Application
Acc e s s i b ility:
Keyboard Navigation
Blooms: Understand
Dif fi cul ty: 02 Medium
Learning Objective: 23-07 Discuss labor market discrimination and how it might affect
hiring decisions and wages.
Test Bank: I
Topic:
Economic Analysis of Discrimination
118.
Suppose Gigantic Health Cooperative doesn't hire Mandy Morrison solely because she is a
graduate of a particular foreign medical school, which is not known for
the high quality of its
graduates. Yet Mandy is actually more qualified than the average graduate of American medical
schools. This is an example of
119.
Suppose Copernicus Corporation hires Damon Danielson rather than Elmer Ellison, simply
because Damon is a graduate of an Ivy League school, while Elmer is a
graduate of a small
public university. Elmer is actually more qualified than Damon. This is an example of

23-54
Copyright © 2018 McGraw-Hill Education. All rights reserved. No reproduction or distribution without the prior
written consent of McGraw-Hill Education.
Topic: Economic Analysis of Discrimination
120.
A particular woman is denied on-the-job training because women on average are more
likely to drop out of the workforce than men. This illustrates
121.
The crowding model of discrimination suggests that
122.
The crowding of women and minorities into a restricted number of occupations

23-55
Copyright © 2018 McGraw-Hill Education. All rights reserved. No reproduction or distribution without the prior
written consent of McGraw-Hill Education.
D. will increase the size of the domestic output but make its distribution less equal.
123.
Minority workers are underrepresented and have less access to certain high-paying
occupations. This illustrates
124.
The crowding model is primarily concerned with explaining
125.
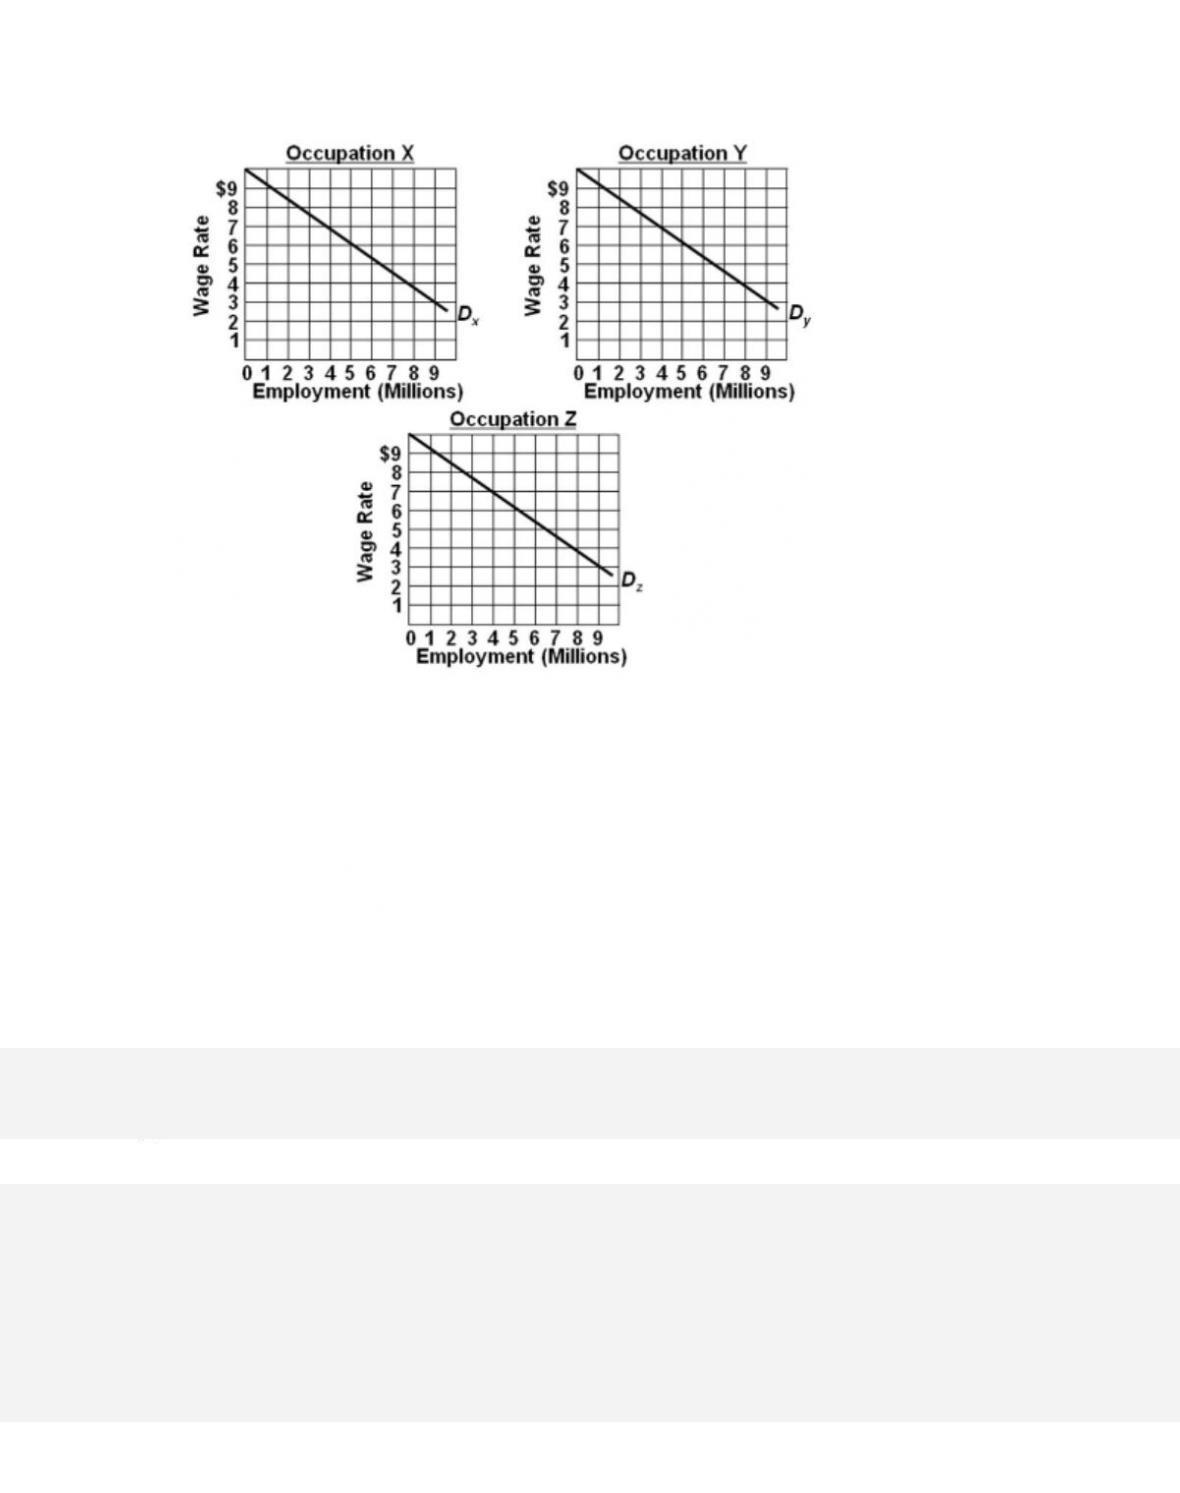
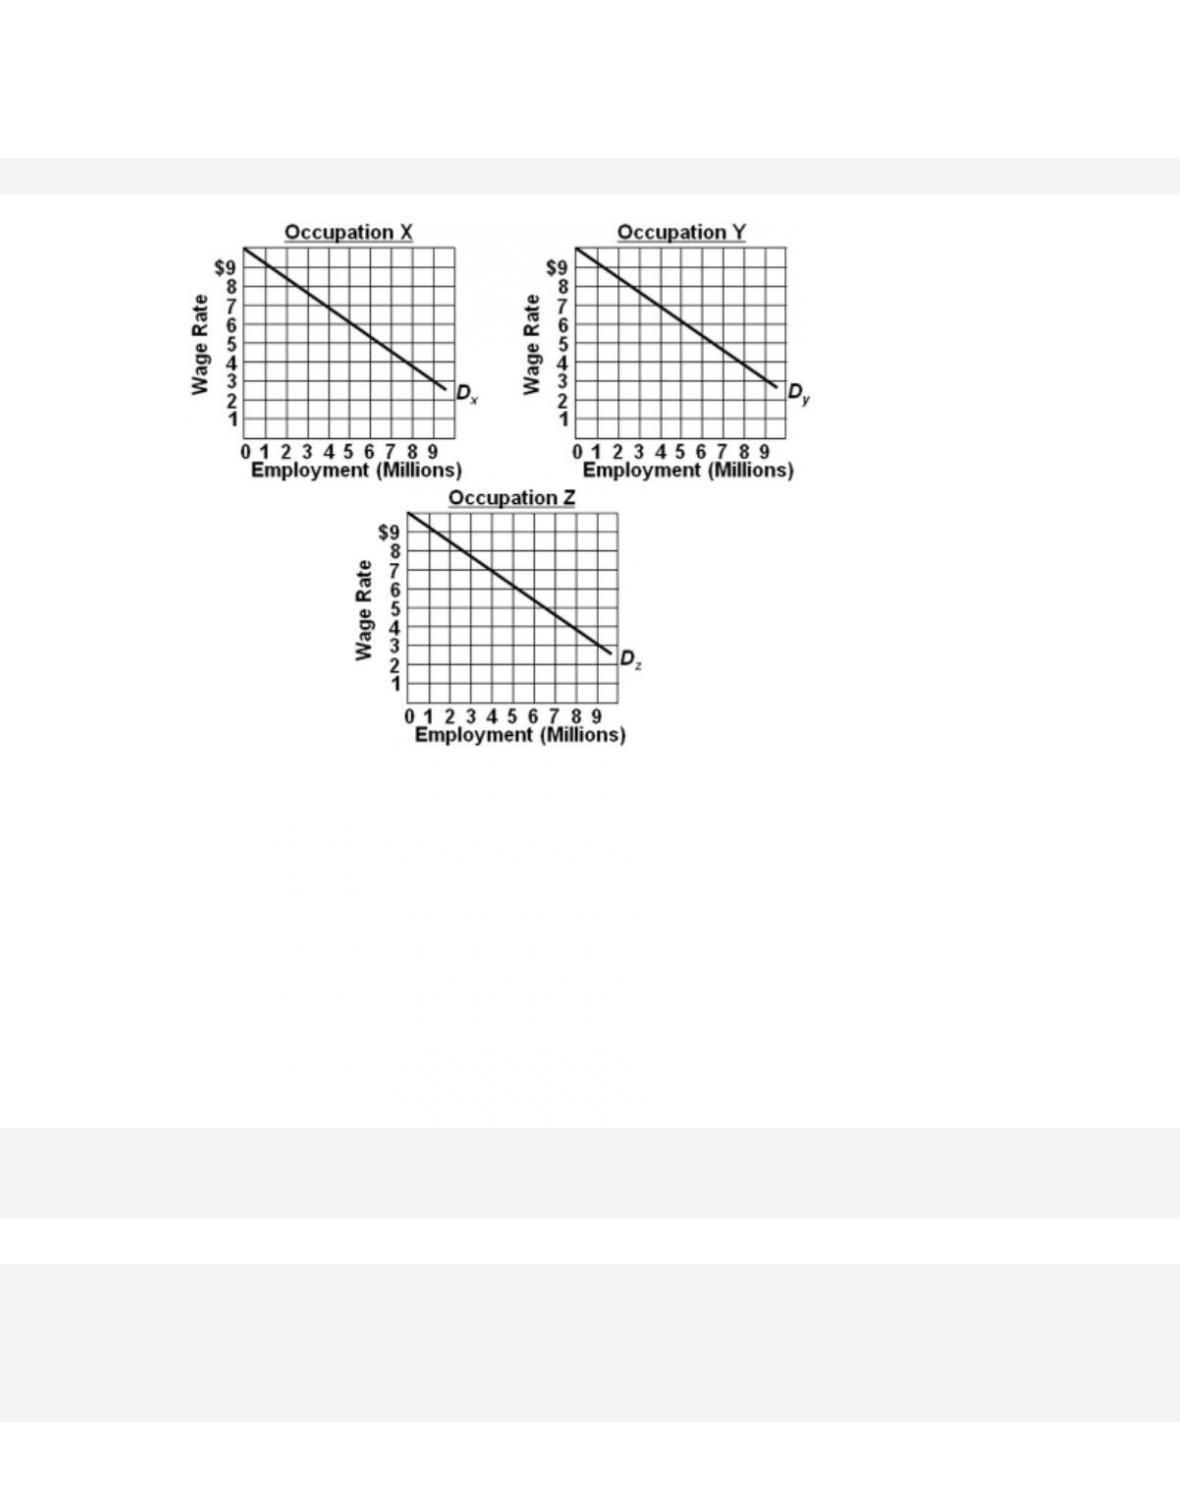
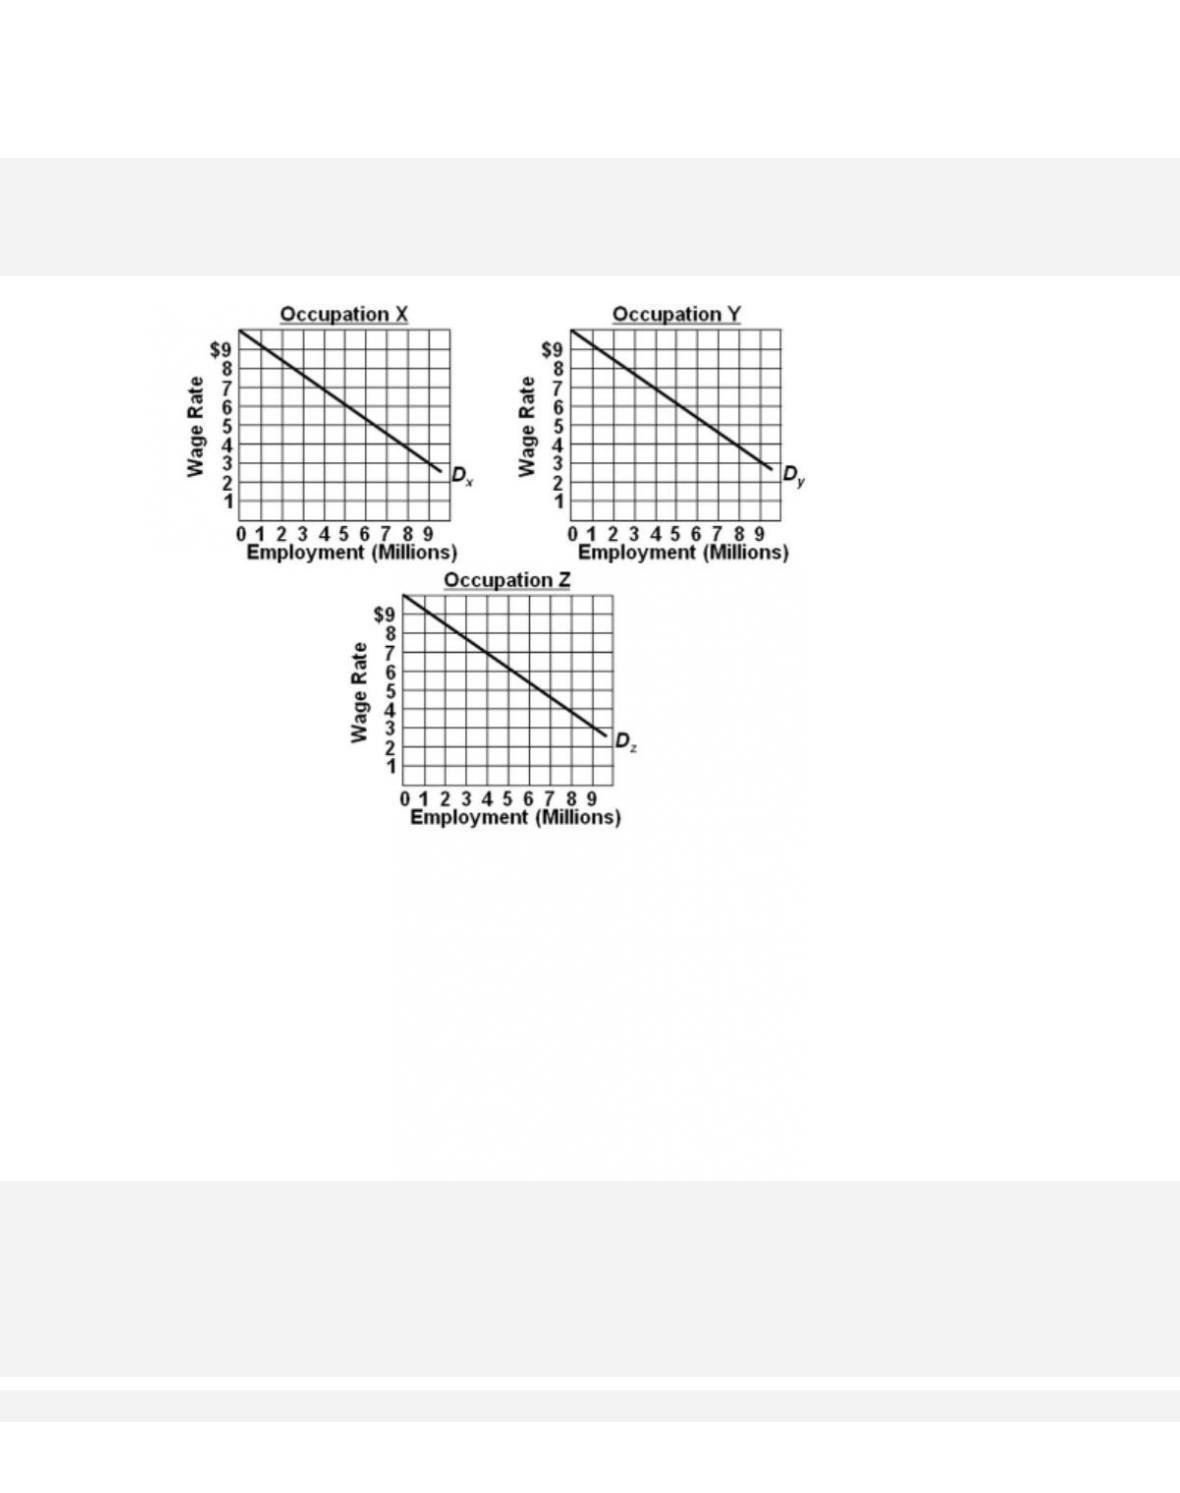
Assumptions: (1) the labor force comprises 9 million men and 9 million women workers; (2) the
economy has 3 occupations, X, Y, and Z, each having identical
demand curves for labor; (3)
male and female workers are homogeneous with respect to their labor-market capabilities; (4)
women are discriminated against by
being excluded from occupations X and Y and are confined
to Z; and (5) aside from discrimination, the economy is competitive, and workers seek to
maximize their
earnings.
Refer to the diagram and list of assumptions. Under these circumstances 9 million women will be
employed in occupation Z,
23-57
Copyright © 2018 McGraw-Hill Education. All rights reserved. No reproduction or distribution without the prior
written consent of McGraw-Hill Education.
Topic: Economic Analysis of Discrimination
Type: Graph
126.
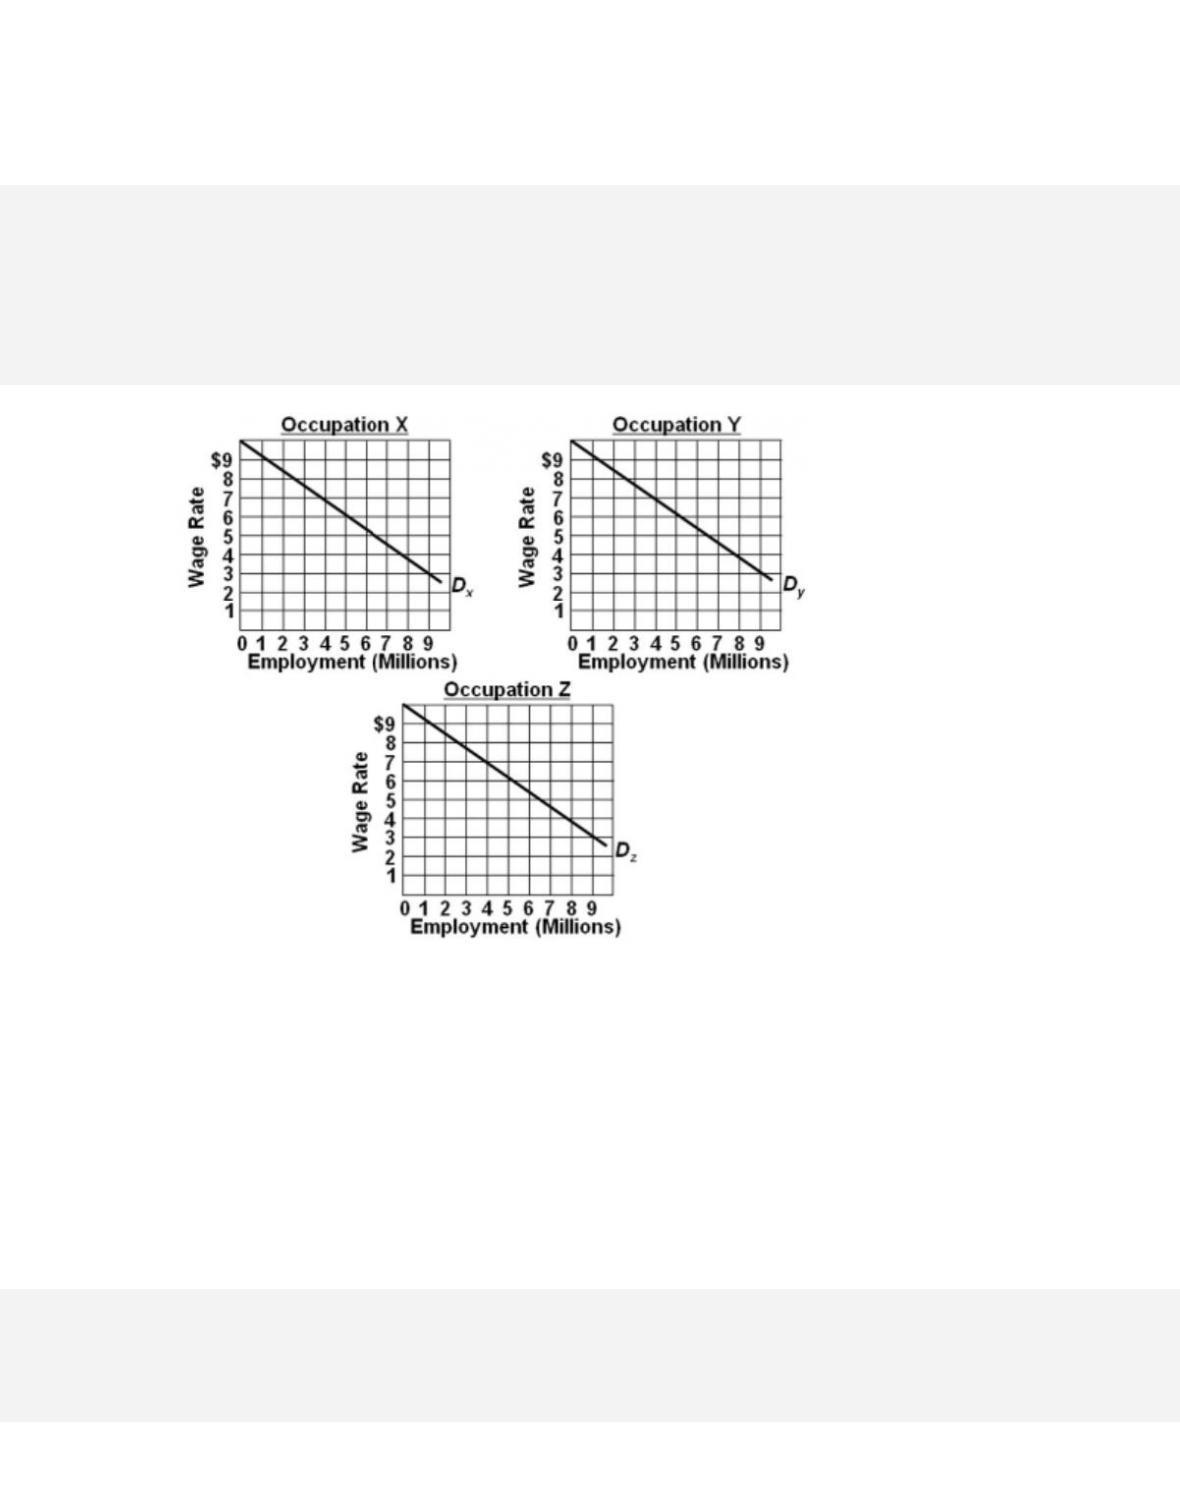
Assumptions: (1) the labor force comprises 9 million men and 9 million women workers; (2) the
economy has 3 occupations, X, Y, and Z, each having identical
demand curves for labor; (3)
male and female workers are homogeneous with respect to their labor-market capabilities; (4)
women are discriminated against by
being excluded from occupations X and Y and are confined
to Z; and (5) aside from discrimination, the economy is competitive, and workers seek to
maximize their
earnings.
Refer to the diagram and list of assumptions. With women confined to occupation Z and men free
to choose occupations, how will this affect the wages paid?
23-58
Copyright © 2018 McGraw-Hill Education. All rights reserved. No reproduction or distribution without the prior
written consent of McGraw-Hill Education.
Learning Objective: 23-07 Discuss labor market discrimination and how it might affect
hiring decisions and wages.
Test Bank: I
Topic:
Economic Analysis of Discrimination
Type: Graph
127.
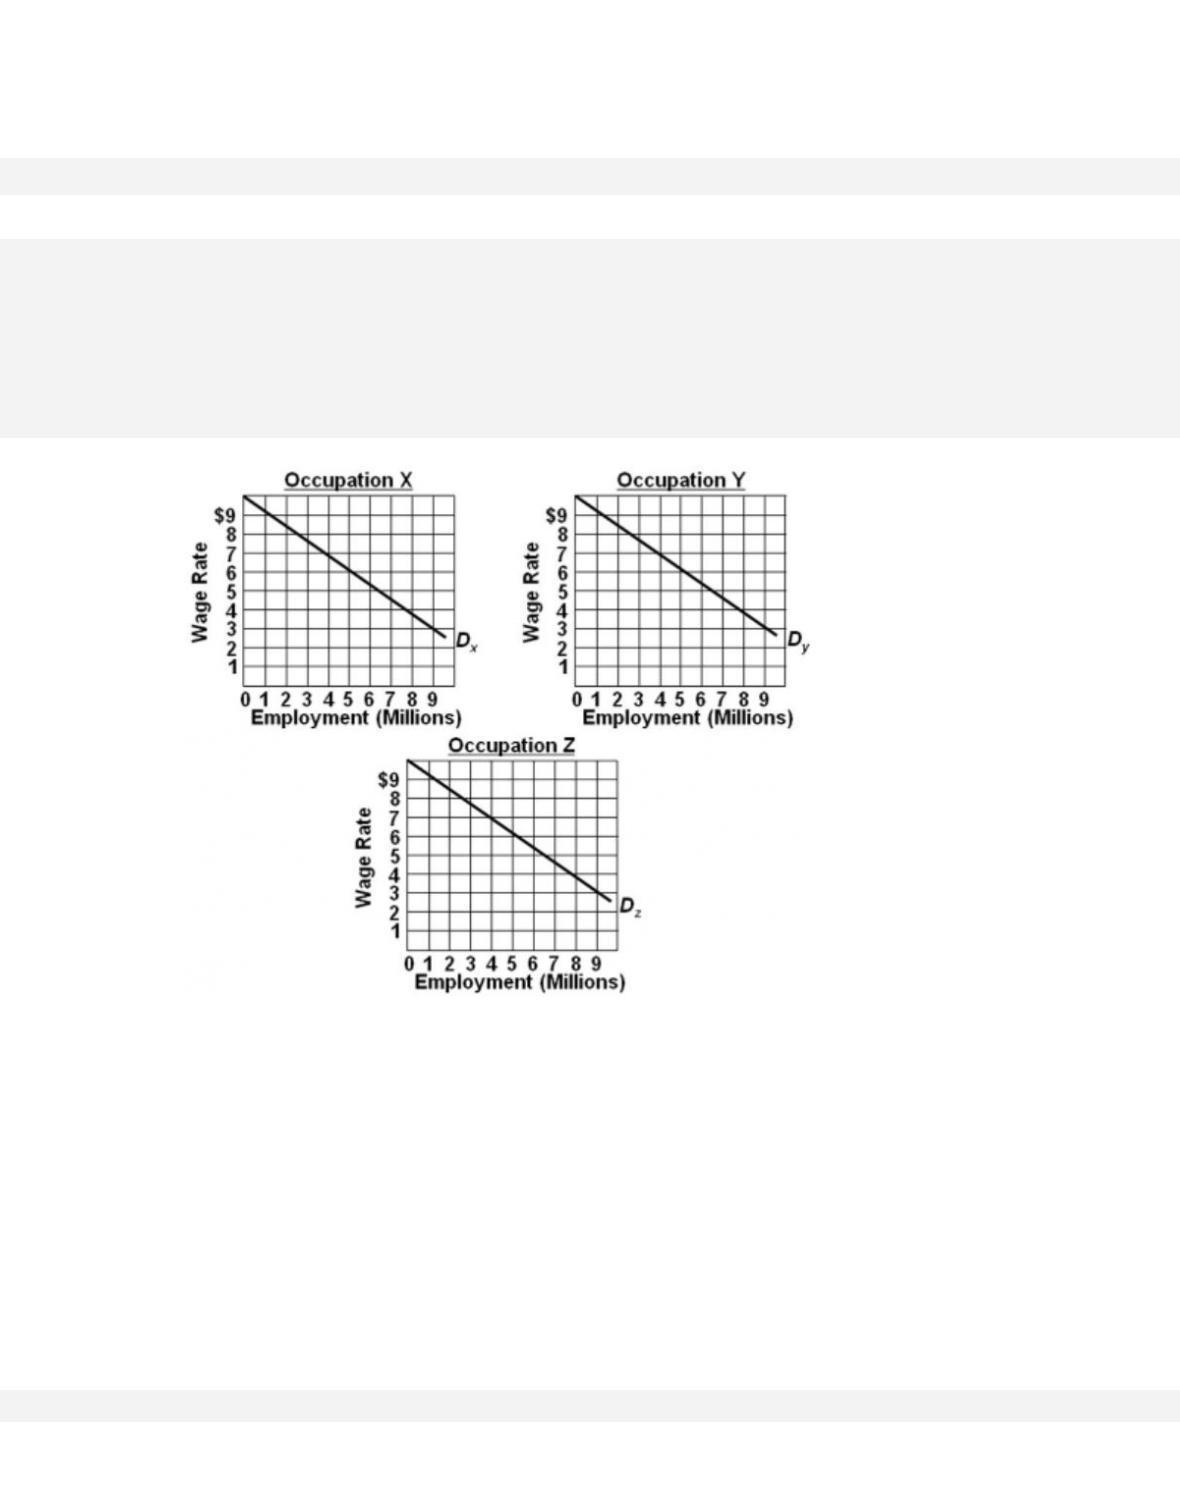
Assumptions: (1) the labor force comprises 9 million men and 9 million women workers; (2) the
economy has 3 occupations, X, Y, and Z, each having identical
demand curves for labor; (3)
male and female workers are homogeneous with respect to their labor-market capabilities; (4)
women are discriminated against by
being excluded from occupations X and Y and are confined
to Z; and (5) aside from discrimination, the economy is competitive, and workers seek to
maximize their
earnings.
Refer to the diagram and list of assumptions. If discrimination is ended,
128.
Assumptions: (1) the labor force comprises 9 million men and 9 million women workers; (2) the
economy has 3 occupations, X, Y, and Z, each having identical
demand curves for labor; (3)
male and female workers are homogeneous with respect to their labor-market capabilities; (4)
women are discriminated against by
being excluded from occupations X and Y and are confined
to Z; and (5) aside from discrimination, the economy is competitive, and workers seek to
maximize their
earnings.
Refer to the diagram and list of assumptions. If discrimination is ended, women
23-60
Copyright © 2018 McGraw-Hill Education. All rights reserved. No reproduction or distribution without the prior
written consent of McGraw-Hill Education.
C.
and men will both receive a wage rate of $6.
D.
will receive a wage rate of $4 and men will receive a wage rate of $5.
129.
Assumptions: (1) the labor force comprises 9 million men and 9 million women workers; (2) the
economy has 3 occupations, X, Y, and Z, each having identical
demand curves for labor; (3)
male and female workers are homogeneous with respect to their labor-market capabilities; (4)
women are discriminated against by
being excluded from occupations X and Y and are confined
to Z; and (5) aside from discrimination, the economy is competitive, and workers seek to
maximize their
earnings.
Refer to the diagram and list of assumptions. The elimination of gender discrimination


