Chapter 23 Income Inequality, Poverty, and Discrimination Answer Key
Multiple Choice Questions
1.
In 2014, the average income for households in the United States was about
2.
In the quintile distribution of income, the term “quintile” represents
3.
In 2014, a household with an annual income of $75,000 would find itself in the
23-2
Copyright © 2018 McGraw-Hill Education. All rights reserved. No reproduction or distribution without the prior
written consent of McGraw-Hill Education.
Blooms: Understand
Diff icult y: 02 Medium
Learning Objective: 23–01 Explain how income inequality in the United States is measured
and described.
Test Bank: I
Topic: Facts about Income Inequality
4.
In 2014, a household with an annual income of $23,000 would find itself in the
5.
The lowest quintile of households in the income distribution (as of 2014) receives about
6.
The highest quintile of households in the income distribution (as of 2014)
23-3
Copyright © 2018 McGraw-Hill Education. All rights reserved. No reproduction or distribution without the prior
written consent of McGraw-Hill Education.
D.
receives about 43 percent of the total income.
AACSB: Knowledge Application
Ac ce ss ib il it y: Keyboard Navigation
Blooms: Understand
Diff icu lty:
02 Medium
Learning Objective: 23–01 Explain how income inequality in the United States is measured
and described.
Test Bank: I
Topic: Facts about Income Inequality
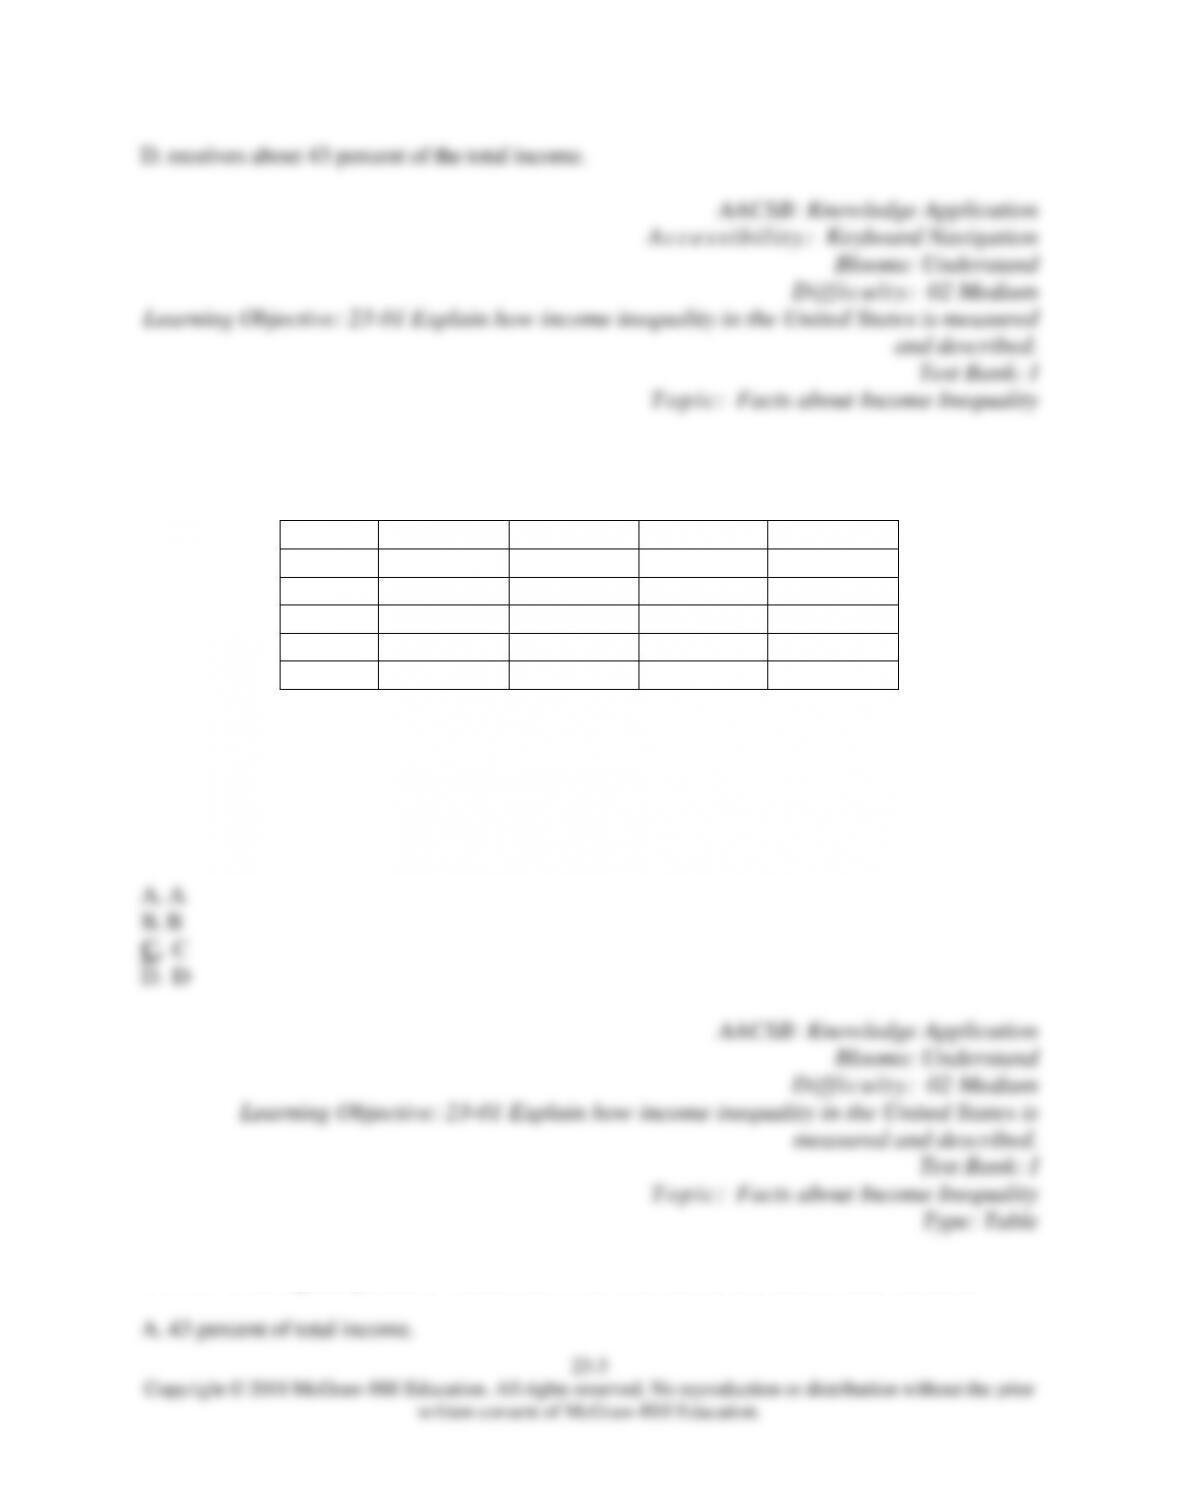
7.
Quintile
(A) Income
(B) Income
(C) Income
(D) Income
Lowest
10%
15%
4%
22%
Second
20
14
10
17
Third
40
19
15
13
Fourth
20
22
23
40
Highest
10
30
48
8
Which of the income distributions in the accompanying table is closest to describing the United
States (as of 2014)?
8.
In 2014, the highest quintile of households in the U.S. income distribution received about
23-4
Copyright © 2018 McGraw-Hill Education. All rights reserved. No reproduction or distribution without the prior
written consent of McGraw-Hill Education.
B.
55 percent of total income.
C.
62 percent of total income.
D. 51 percent of total income.
AACSB: Knowledge Application
Ac ce ssi bi li t y:
Keyboard Navigation
Blooms: Understand
Diff icult y: 02 Medium
Learning Objective: 23–01 Explain how income inequality in the United States is
measured and described.
Test Bank: I
Topic: Facts about Income Inequality
9.
Census data indicate that, as of 2014, the top fifth of all households receive about times as
much income as the bottom fifth.
10.
The Lorenz curve
23-5
Copyright © 2018 McGraw-Hill Education. All rights reserved. No reproduction or distribution without the prior
written consent of McGraw-Hill Education.
Test Bank: I
Topic: Facts about Income Inequality
11.
The Lorenz curve portrays
12.
The Gini ratio
13.
The Gini ratio of income inequality ranges between
23-6
Copyright © 2018 McGraw-Hill Education. All rights reserved. No reproduction or distribution without the prior
written consent of McGraw-Hill Education.
AACSB: Knowledge Application
Ac ce ss ib il it y: Keyboard Navigation
Blooms: Understand
Diff icult y: 02 Medium
Learning Objective: 23–01 Explain how income inequality in the United States is measured
and described.
Test Bank: I
Topic:
Facts about Income Inequality
14.
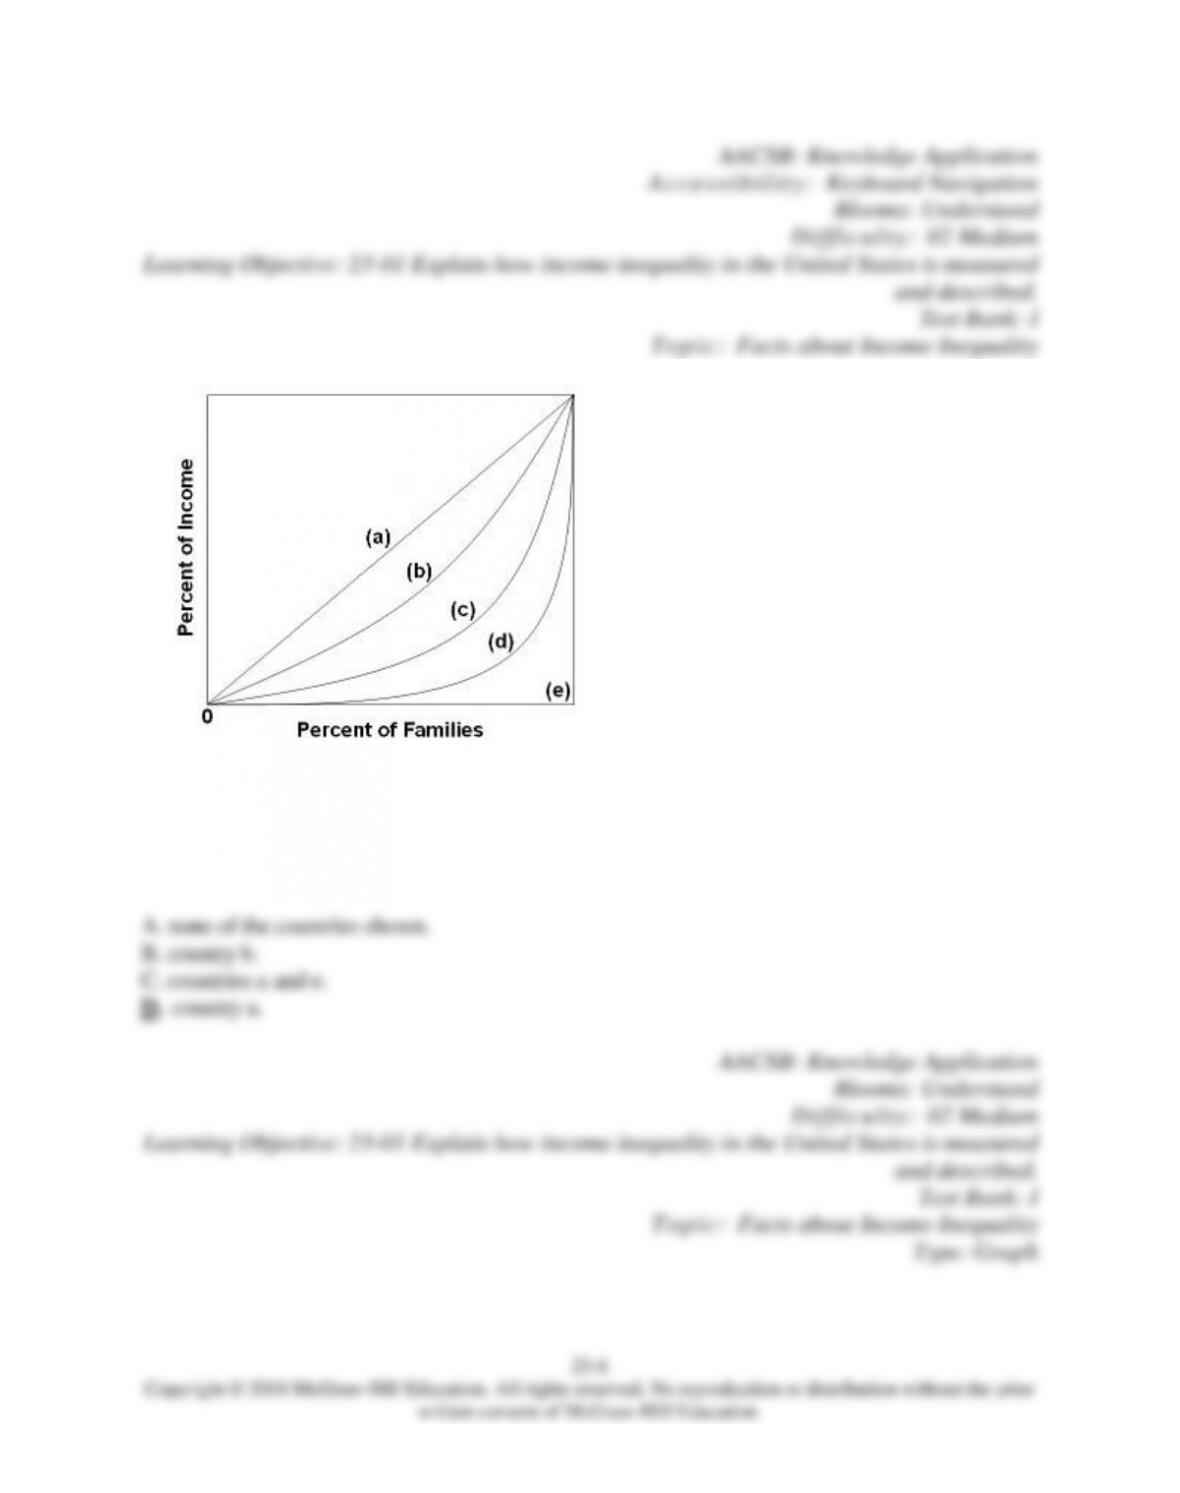
Refer to the diagram, where curves (a) through (e) are Lorenz curves for five different countries.
Income is equally distributed in
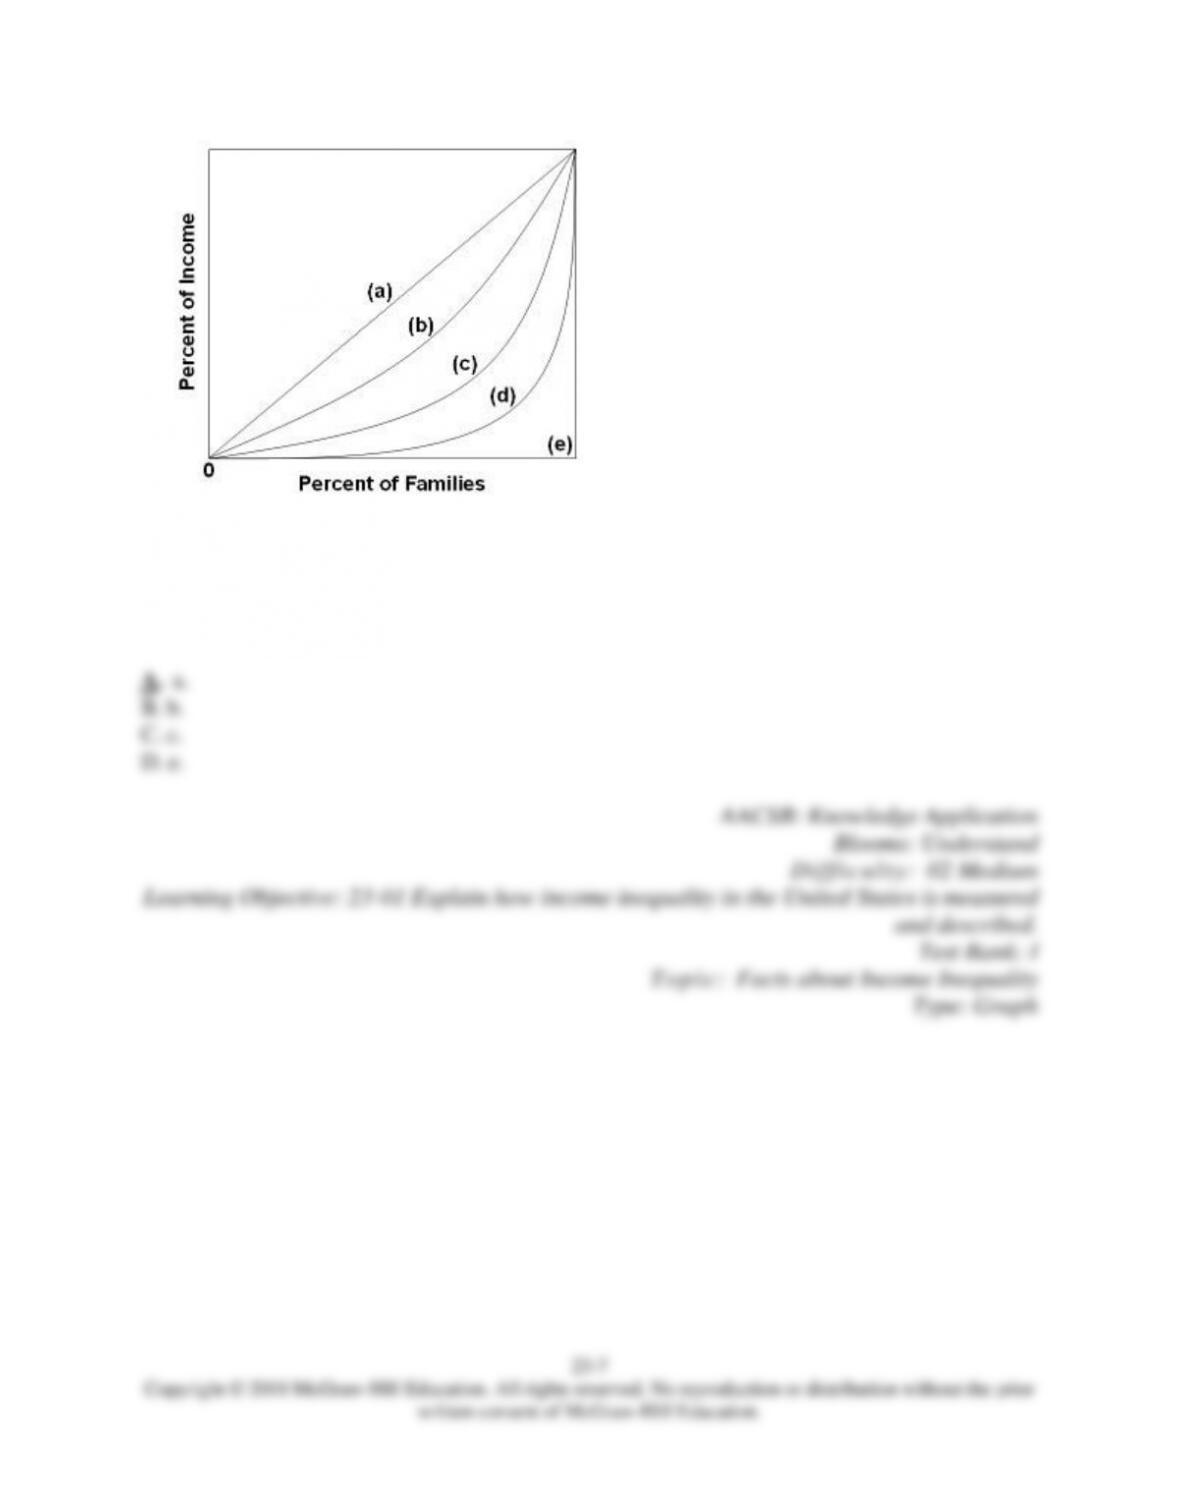
15.
Refer to the diagram, where curves (a) through (e) are for five different countries. The Gini ratio
is lowest in country
16.
Refer to the diagram, where curves (a) through (e) are for five different countries. Of the
countries listed below, income is most unequally distributed in country
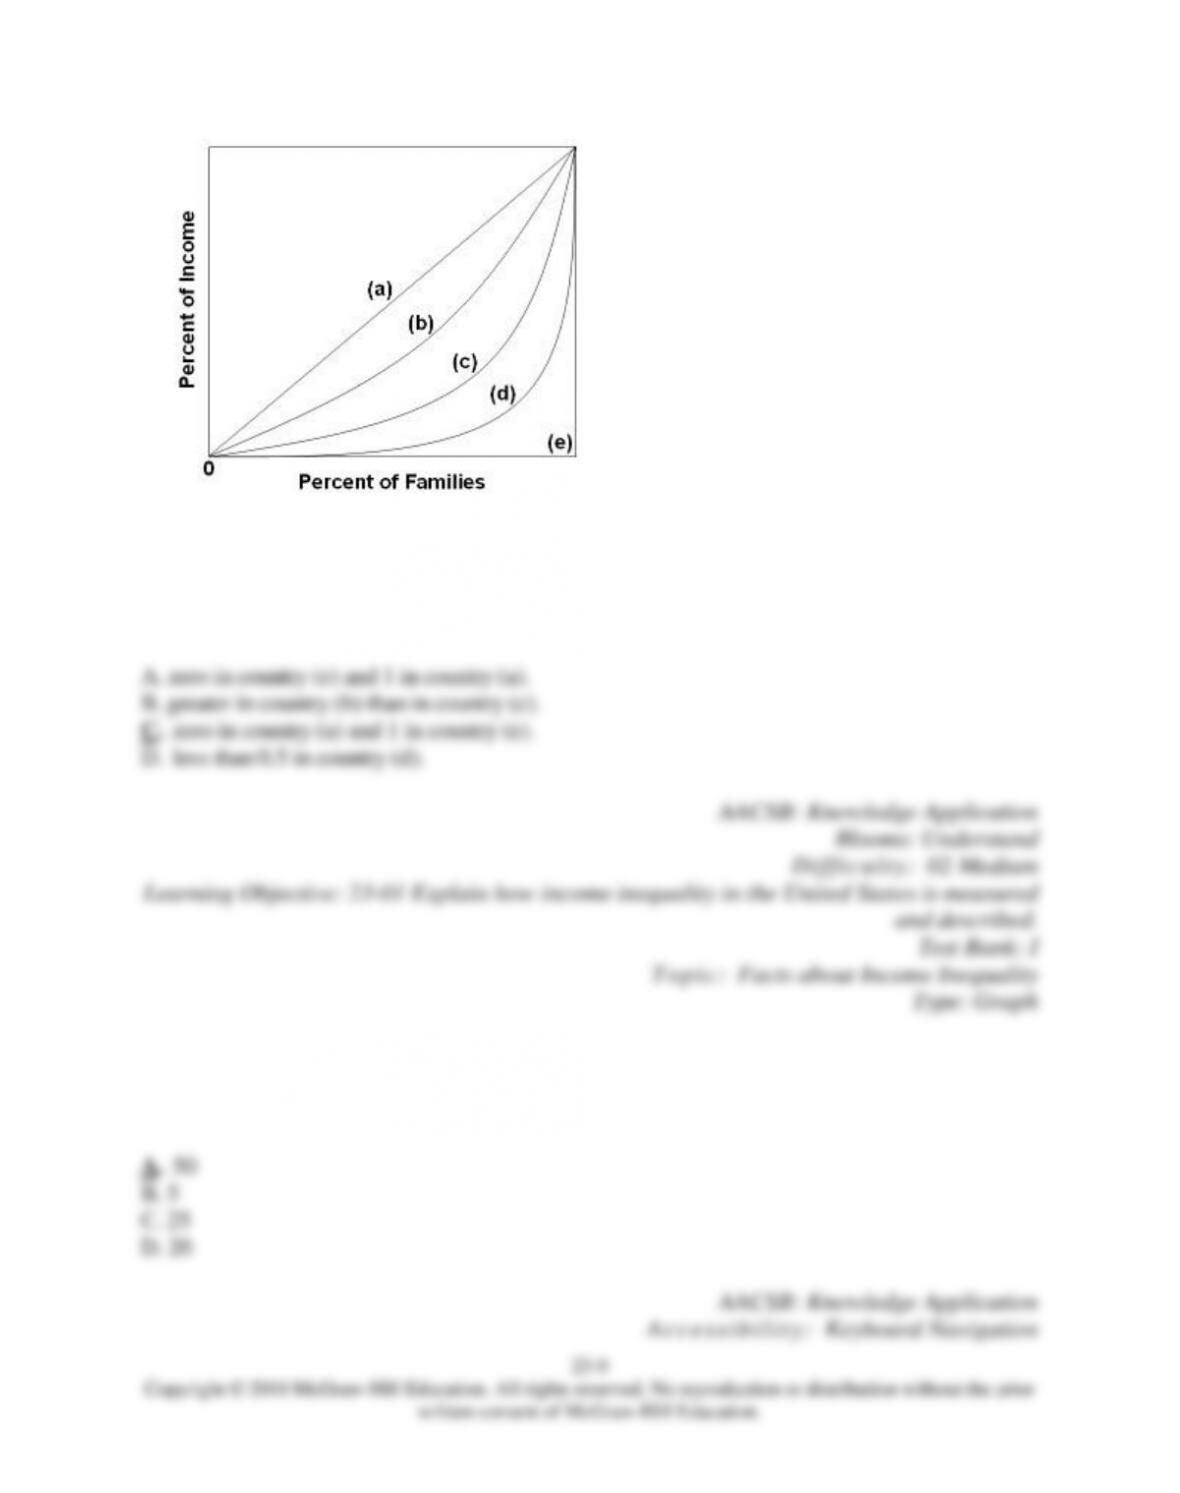
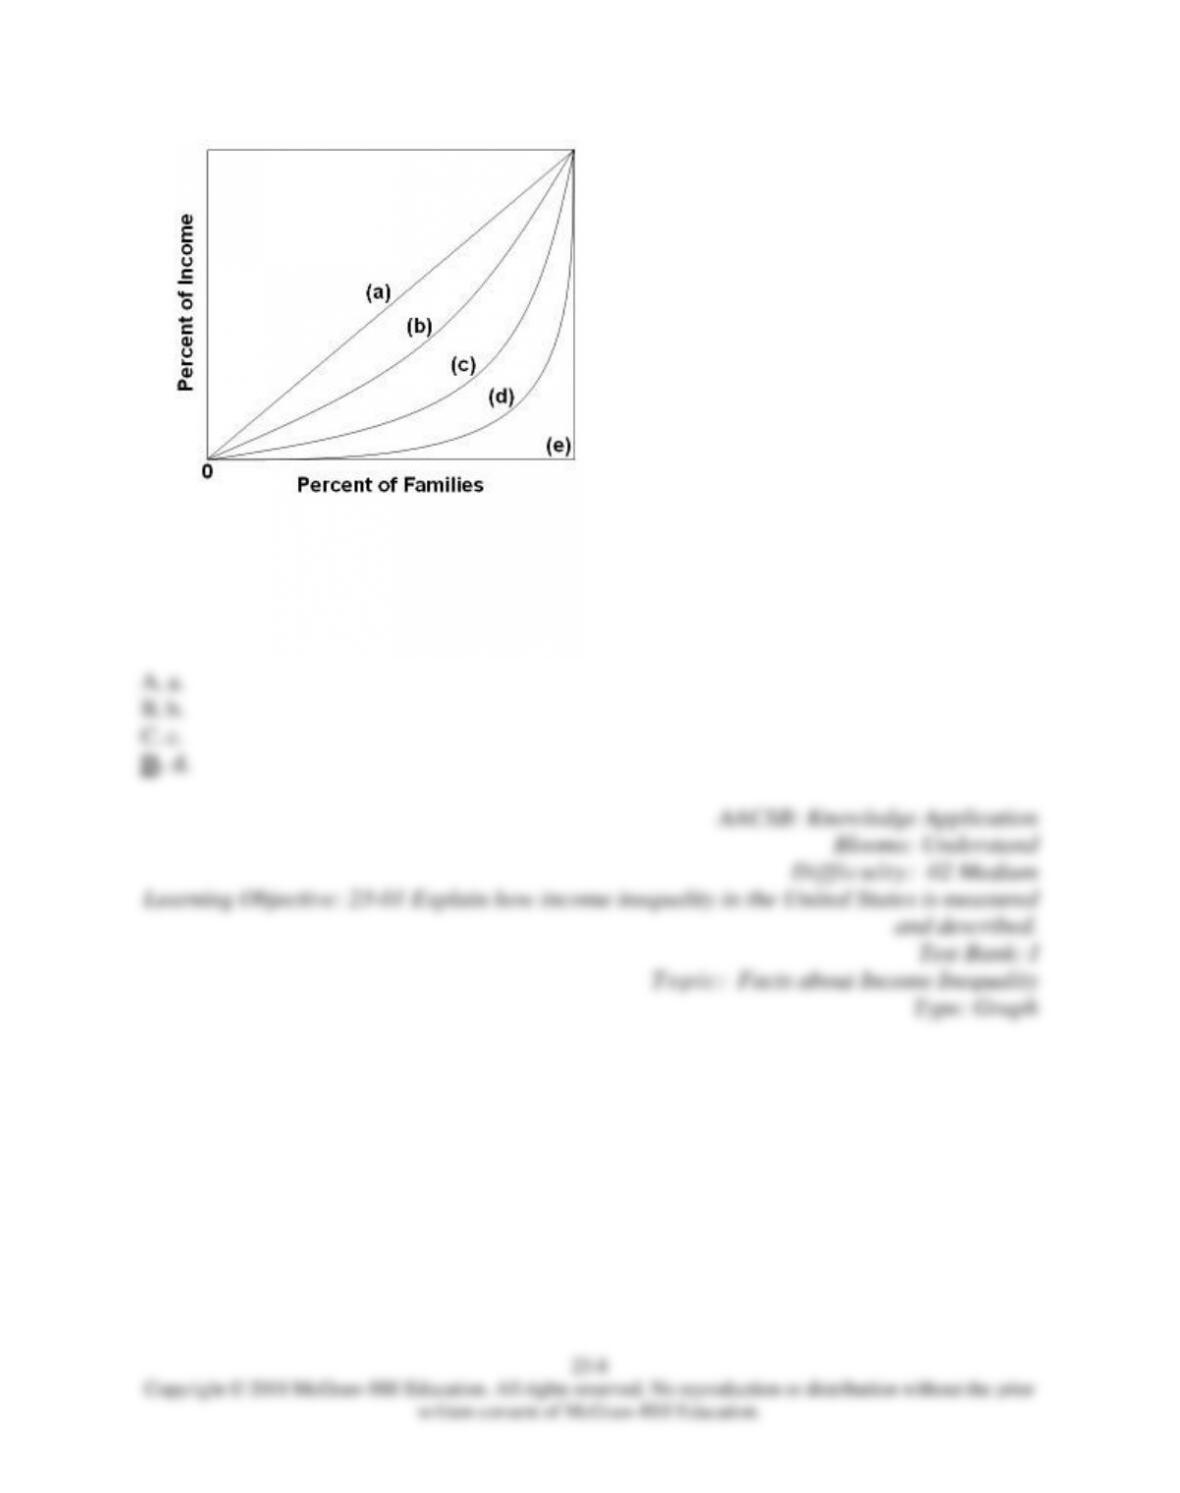
17.
Refer to the diagram, where curves (a) through (e) are for five different countries. The Gini ratio
is
18.
Suppose the members of population A, consisting of Al, Bob, Curt, Doris, and Ellie, receive
annual incomes of $5,000, $2,500, $1,250, $750, and $500,
respectively. What percentage of
total income is received by the richest quintile?
23–10
Copyright © 2018 McGraw-Hill Education. All rights reserved. No reproduction or distribution without the prior
written consent of McGraw-Hill Education.
Blooms: Understand
Diff icu lty:
02 Medium
Learning Objective: 23–01 Explain how income inequality in the United States is measured
and described.
Test Bank: I
Topic:
Facts about Income Inequality
Type: Graph
19.
Suppose the members of population A, consisting of Al, Bob, Curt, Doris, and Ellie, receive
annual incomes of $5,000, $2,500, $1,250, $750, and $500,
respectively. What percentage of
total income is received by the lowest 60 percent of the income receivers in population A?
20.
Suppose the members of population A, consisting of Al, Bob, Curt, Doris, and Ellie, receive
annual incomes of $5,000, $2,500, $1,250, $750, and $500,
respectively. The members of
population B, consisting of Fred, George, Holly, Irma, and Joan, receive incomes of $4,000,
$3,000, $1,250, $950, and $800, respectively. We
23–11
Copyright © 2018 McGraw-Hill Education. All rights reserved. No reproduction or distribution without the prior
written consent of McGraw-Hill Education.
Topic:
Facts about Income Inequality
Type: Graph
21.
The greater the area between the Lorenz curve and the diagonal in the Lorenz curve diagram,
the
22.
Which of the following Gini ratios indicates the highest degree of income inequality?
23.
Which of the following Gini ratios indicates the lowest degree of income inequality?
23–12
Copyright © 2018 McGraw-Hill Education. All rights reserved. No reproduction or distribution without the prior
written consent of McGraw-Hill Education.
Ac ce ss ib il it y: Keyboard Navigation
Blooms: Understand
Diff icu lty:
02 Medium
Learning Objective: 23–01 Explain how income inequality in the United States is measured
and described.
Test Bank: I
Topic: Facts about Income Inequality
24.
Which of the following countries has the highest Gini ratio, as of 2014?
25.
The movement of individuals and households from one income quintile to another over time
is called
26.
Income mobility
27.
Income mobility
28.
In the United States, the lifetime distribution of income is more equal than the annual
distribution. This statement is
23–14
Copyright © 2018 McGraw-Hill Education. All rights reserved. No reproduction or distribution without the prior
written consent of McGraw-Hill Education.
B. true because there is considerable income mobility over time.
C.
false because people tend to stay in the same income quintile over extended periods of time.
D.
false because the rich have gotten richer and the poor have gotten poorer.
AACSB: Knowledge Application
Ac ce ss ib il it y: Keyboard Navigation
Blooms: Understand
Diff icu lty:
02 Medium
Learning Objective: 23–01 Explain how income inequality in the United States is measured
and described.
Learning Objective: 23–02 Discuss the extent and sources of income inequality.
Test Bank: I
Topic: Causes of Income Inequality
T o p i c:
Facts about Income Inequality
29.
People’s incomes are relatively low when they are young, reach a peak in middle age, and
then decline. This fact helps explain
30.
Some economists have criticized standard government figures on income inequality, arguing
that these data
23–15
Copyright © 2018 McGraw-Hill Education. All rights reserved. No reproduction or distribution without the prior
written consent of McGraw-Hill Education.
Blooms: Understand
Diff icult y: 02 Medium
Learning Objective: 23–01 Explain how income inequality in the United States is measured
and described.
Learning Objective: 23–02 Discuss the extent and sources of income inequality.
Test Bank: I
Topic: Causes of Income Inequality
T o p i c:
Facts about Income Inequality
31.
In the United States,
32.
Housing subsidies for low-income households
33.
Standard census data on the distribution of income
34.
Which of the following is a noncash transfer?
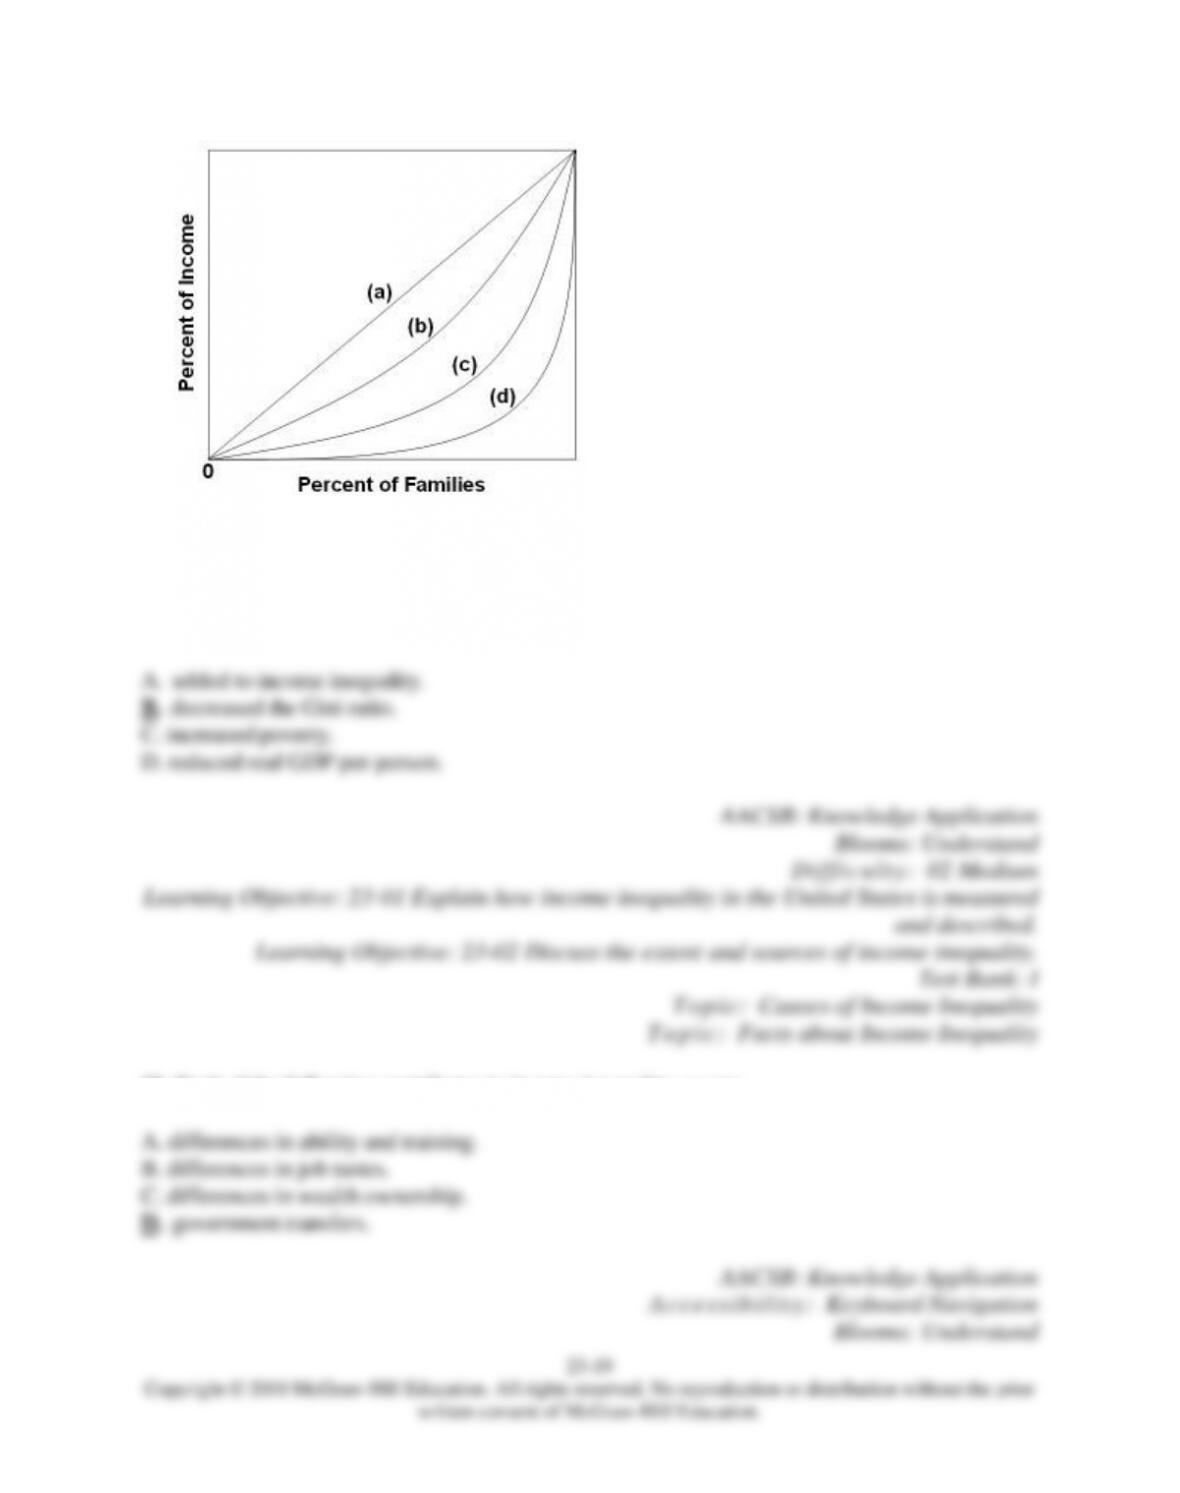
35.
Refer to the diagram. If line (c) represents the pretax and transfer distribution of income in the
United States, the post-tax and transfer distribution is best represented
by
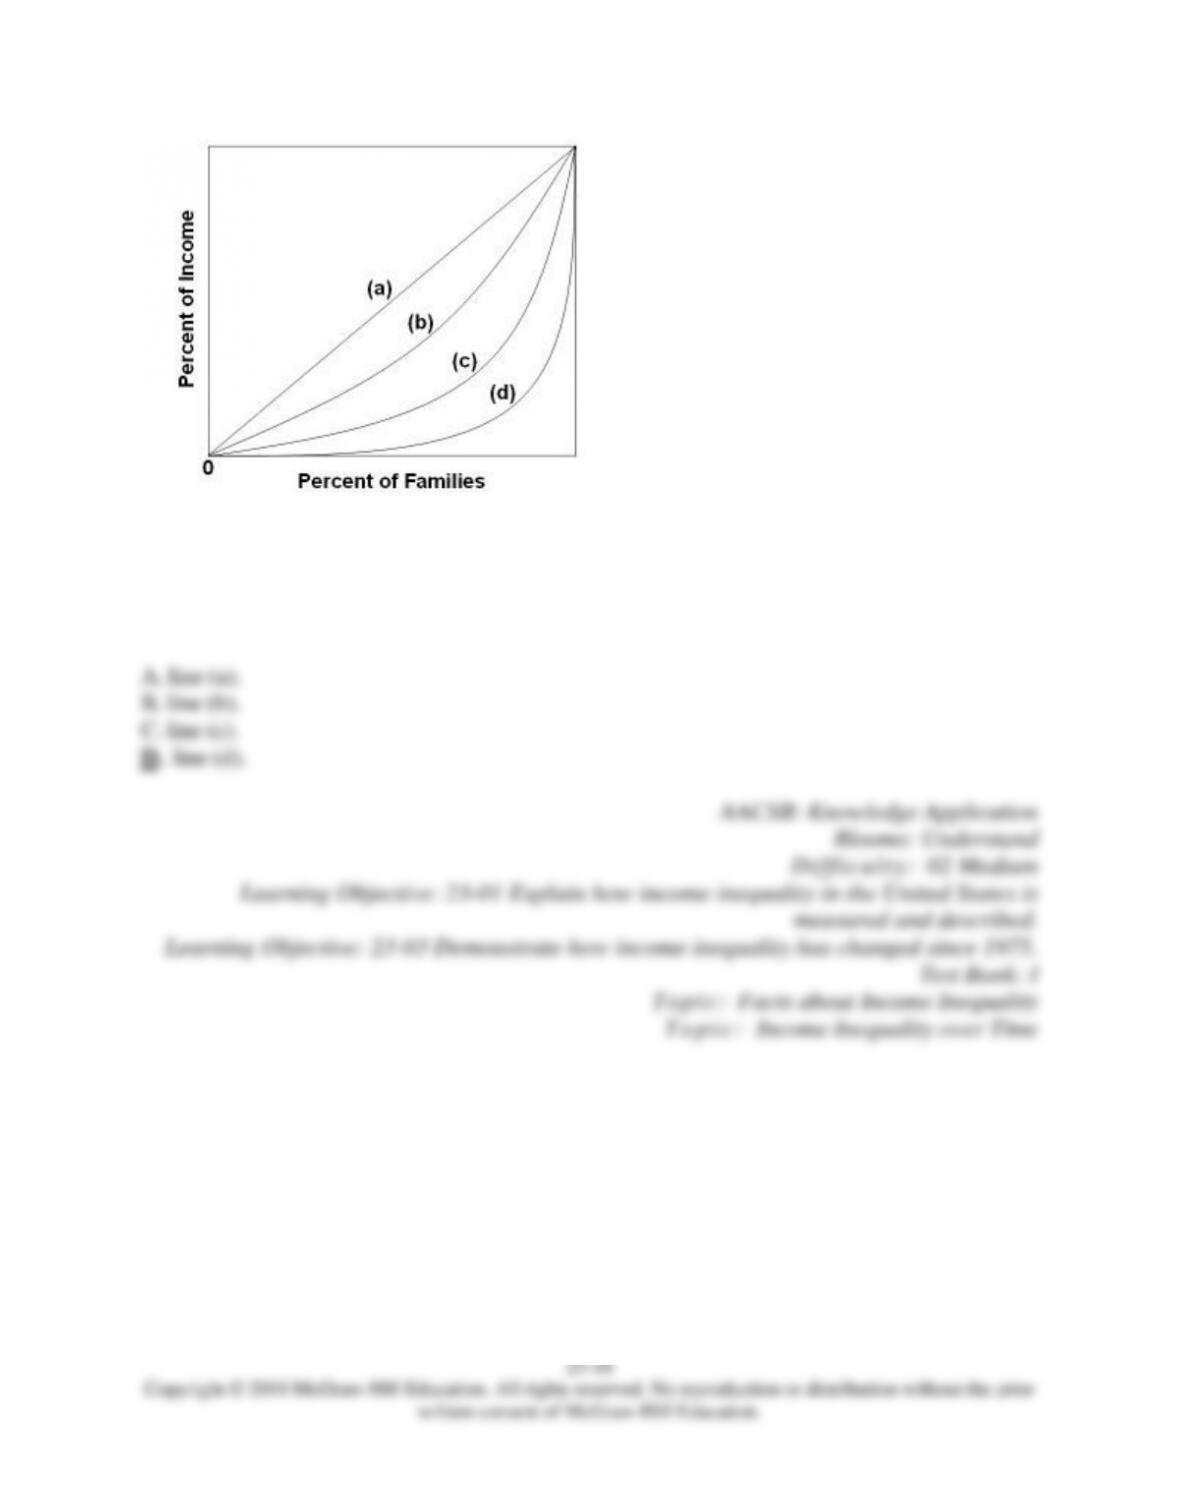
36.
Refer to the diagram. If line (c) represents the distribution of income in 1975 in the United States,
we would expect the distribution of income for 2014 to be more
like
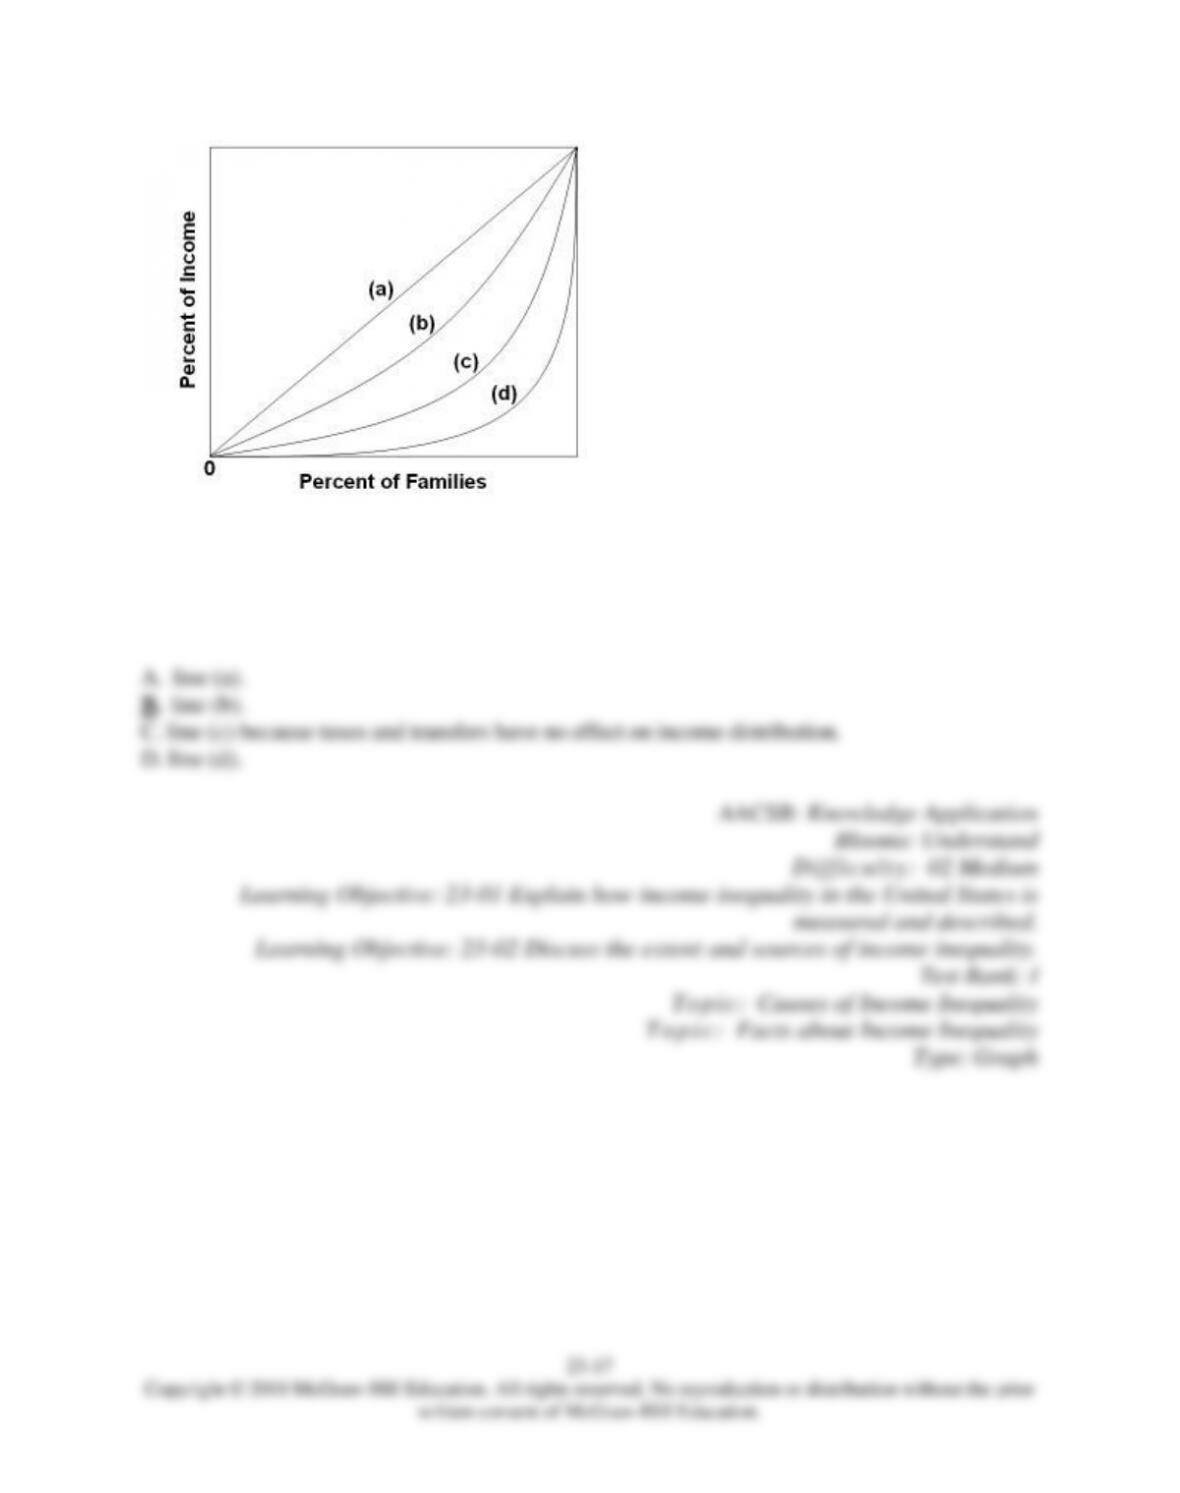
37.
Refer to the diagram. If line (c) represents the distribution of income before taxes and transfers
and line (b) represents the distribution after taxes and transfers, then
taxes and transfers have
38.
Each of the following contributes to income inequality except
23–20
Copyright © 2018 McGraw-Hill Education. All rights reserved. No reproduction or distribution without the prior
written consent of McGraw-Hill Education.
Diff icult y: 02 Medium
Learning Objective: 23–02 Discuss the extent and sources of income inequality.
Test Bank: I
Topic: Causes of Income Inequality
39.
If discrimination based on gender and race was eliminated, we would expect the
40.
Differences in the amounts and quality of education and training
41.
One cause of income inequality in the United States is