
22–61
A. government-sponsored agencies.
139.
Because the demand for agricultural products is highly price inelastic, a modest
increase in supply will cause
D.
a large decline in farm prices, but an increase in farm incomes.
140.
A significant reason that increases in demand for agricultural products have been
relatively small is because increases in the
A.
population of the United States have been greater than increases in the productivity of
agriculture.

22–62
Copyright © 2018 McGraw-Hill Education. All rights reserved. No reproduction or distribution without the prior
written consent of McGraw-Hill Education.
AACSB: Knowledge Application
Accessibility: Keyboard Navigation
Blooms: Understand
Di f fic u lty : 02 Medium
Learning Objective: 22–02 Discuss why there has been a huge employment exodus from
agriculture to other U.S. industries over the past several decades.
Test Bank: II
To pi c: The Long Run: A Declining Industry
141.
Expanding per capita incomes in the United States have resulted in a(n)
A.
more–than-proportionate increase in the demand for agricultural products.
142.
A source of demand volatility for agricultural products is
A. the strict application of “100 percent parity” by the Department of Agriculture.
143.
The reason for the long–run decline of the agricultural industry is that the
A. increases in the demand for farm products have been greater than the increases in the
supply of farm products.
144.
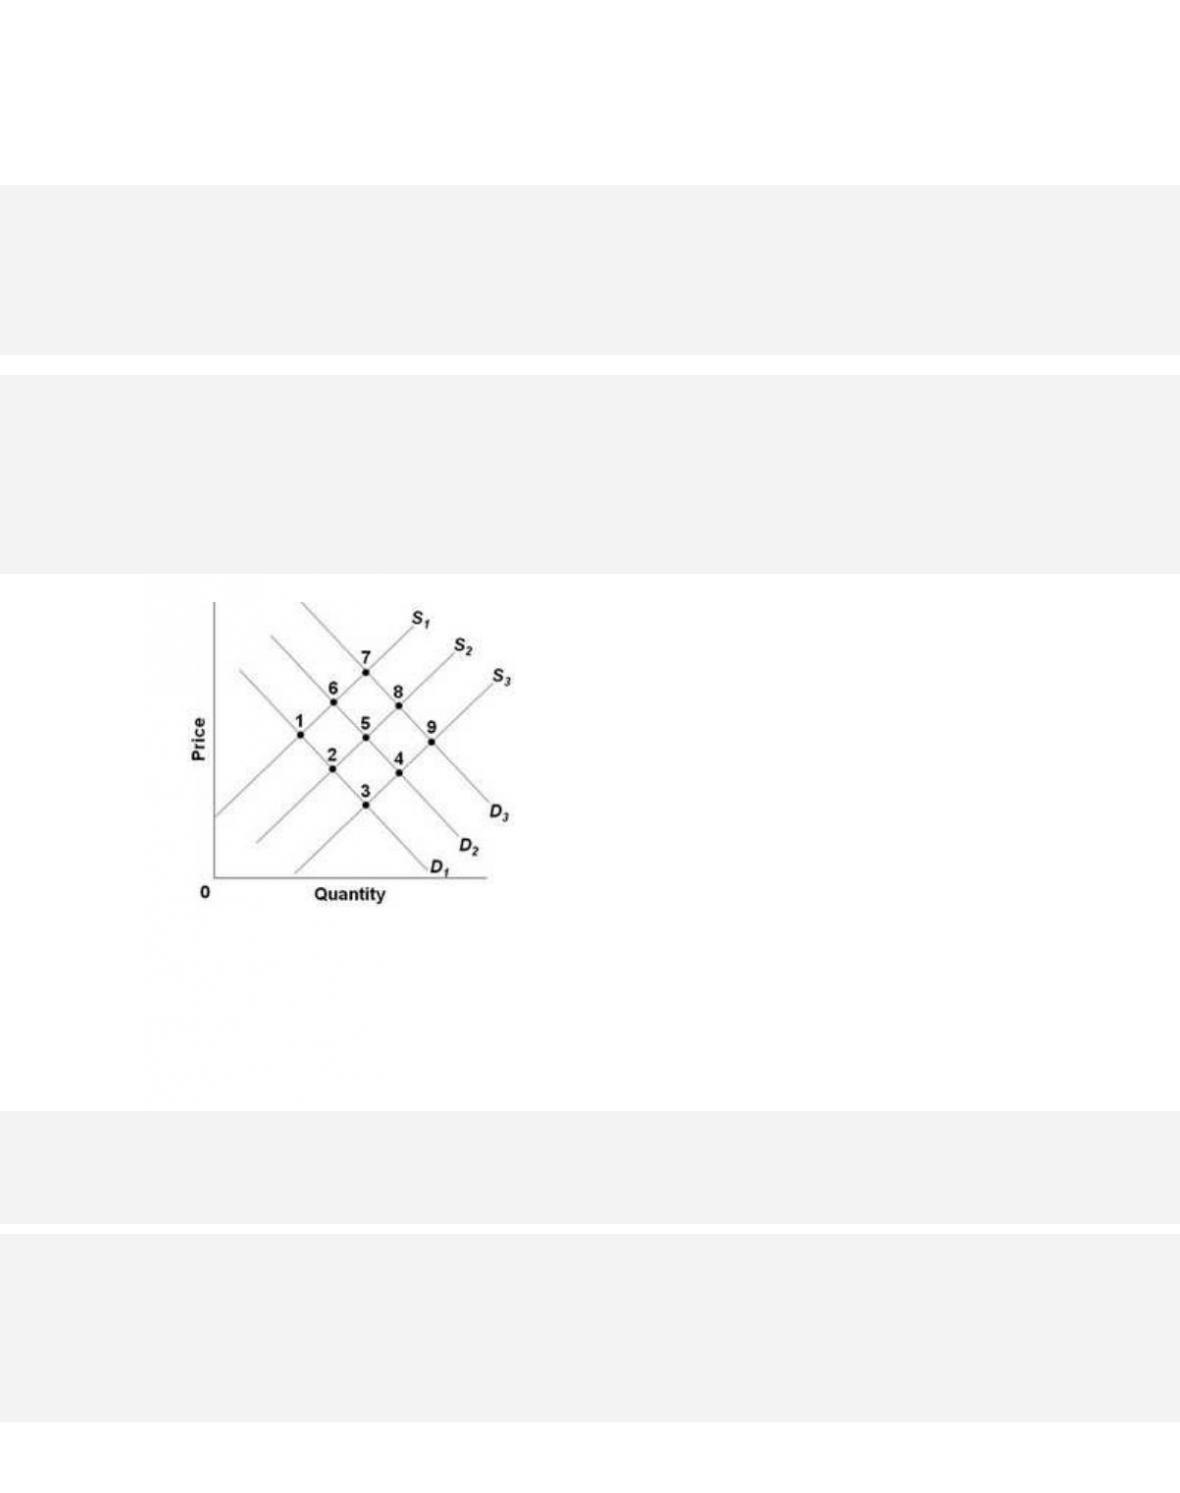
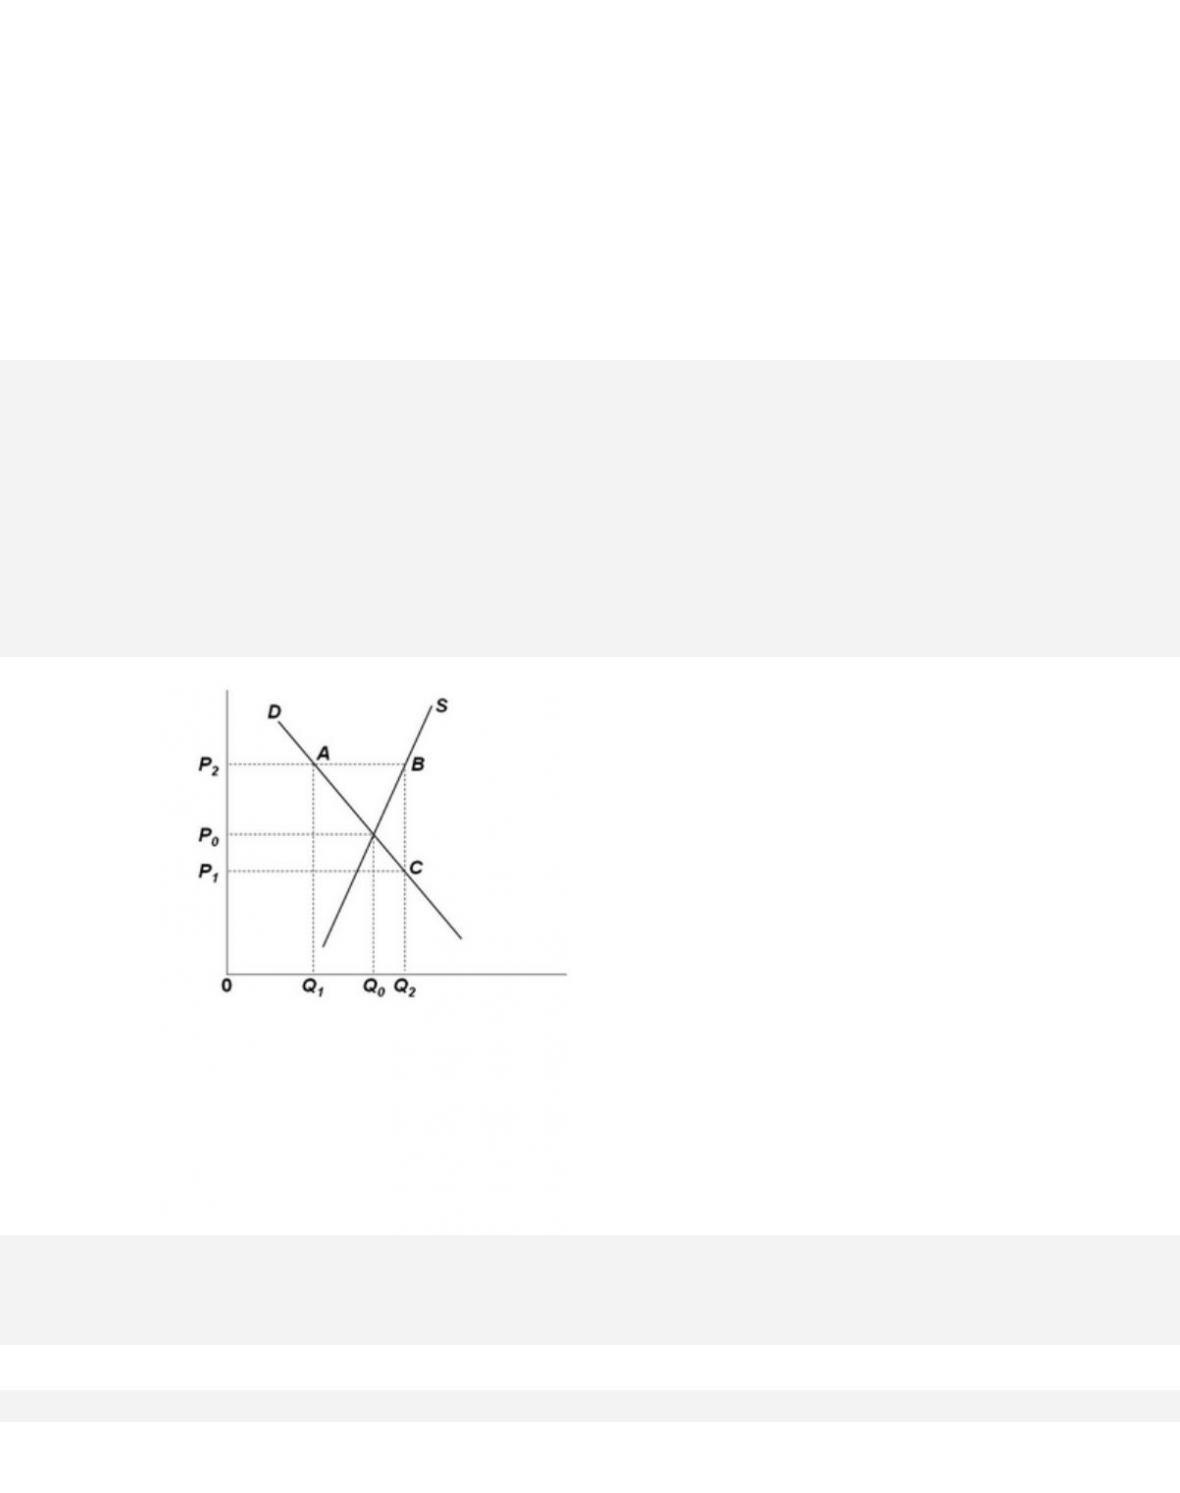
Refer to the graph of the supply and demand for agricultural products. Which of the
following best describes the long-run decline of the U.S. agricultural industry?
A. a shift in supply from S1 to S2 and a shift in demand from D2 to D1
22–64
Copyright © 2018 McGraw-Hill Education. All rights reserved. No reproduction or distribution without the prior
written consent of McGraw-Hill Education.
agriculture to other U.S. industries over the past several decades.
Test Bank: II
To pi c: The Long Run: A Declining Industry
145.
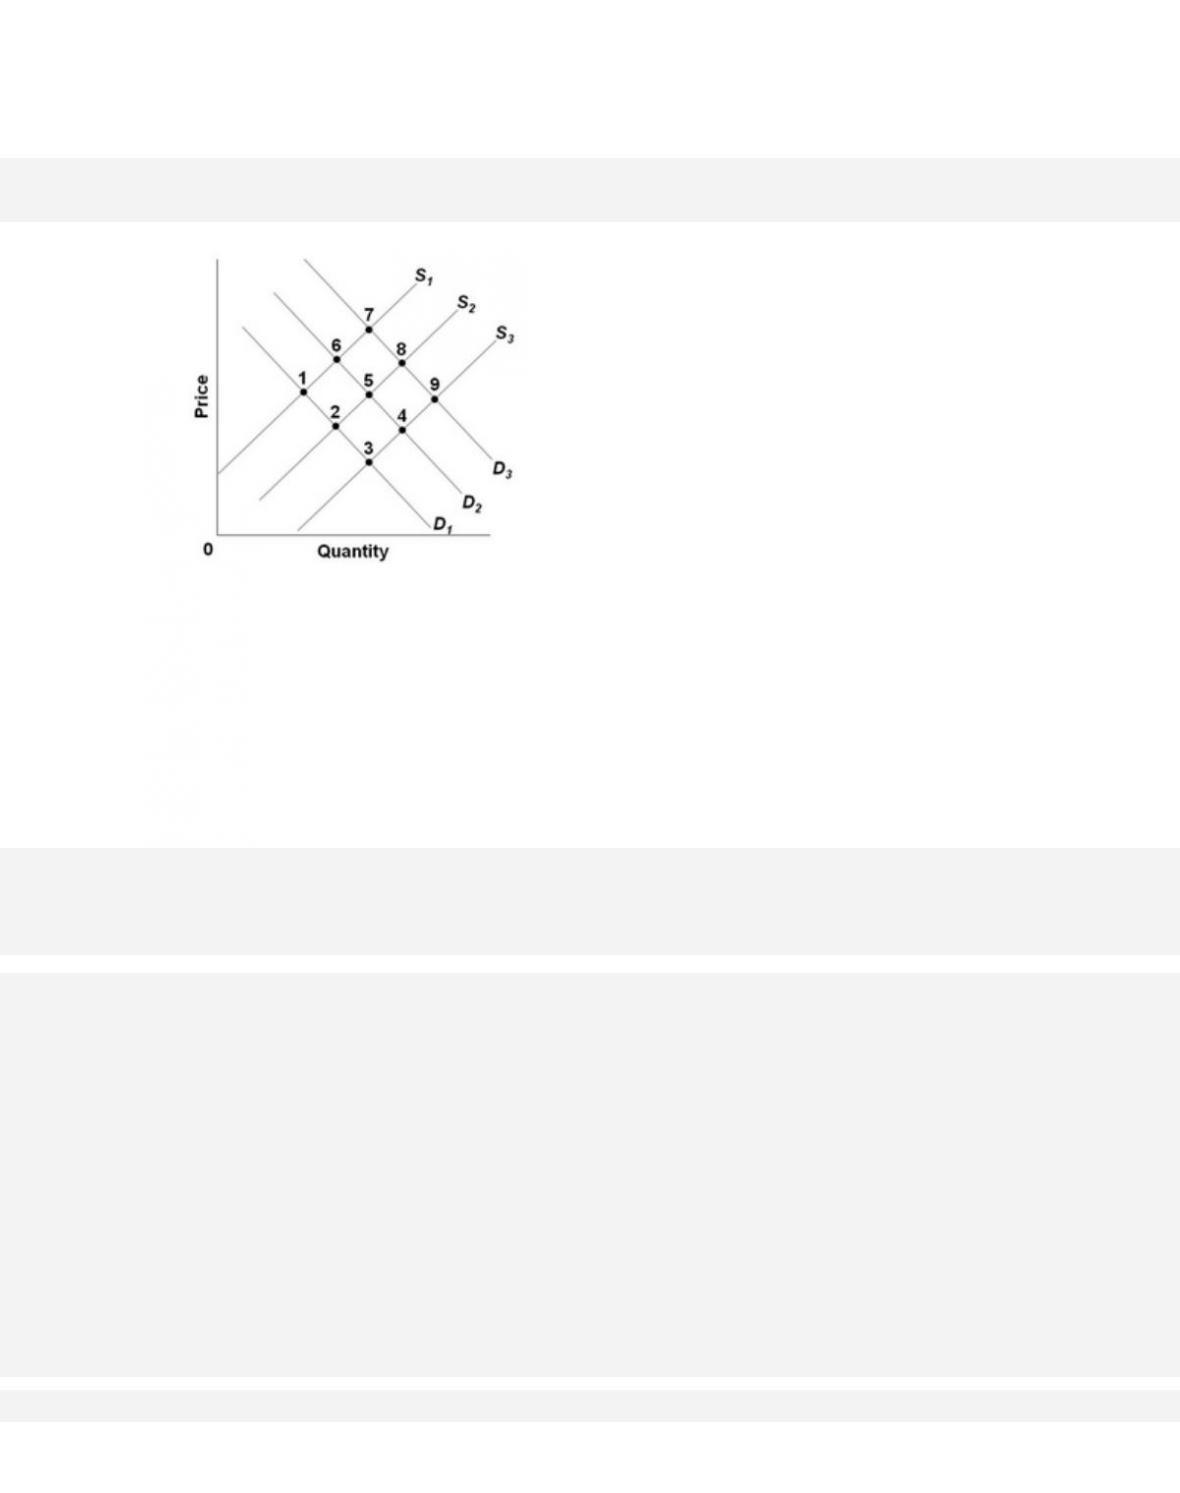
Refer to the graph of the supply and demand for agricultural products. If point 1 reflects the
supply and demand for agricultural products in the U.S. in the 1950s, then which point
would best
characterize long-run change in the equilibrium for agricultural products since
that time?
A. 2
146.
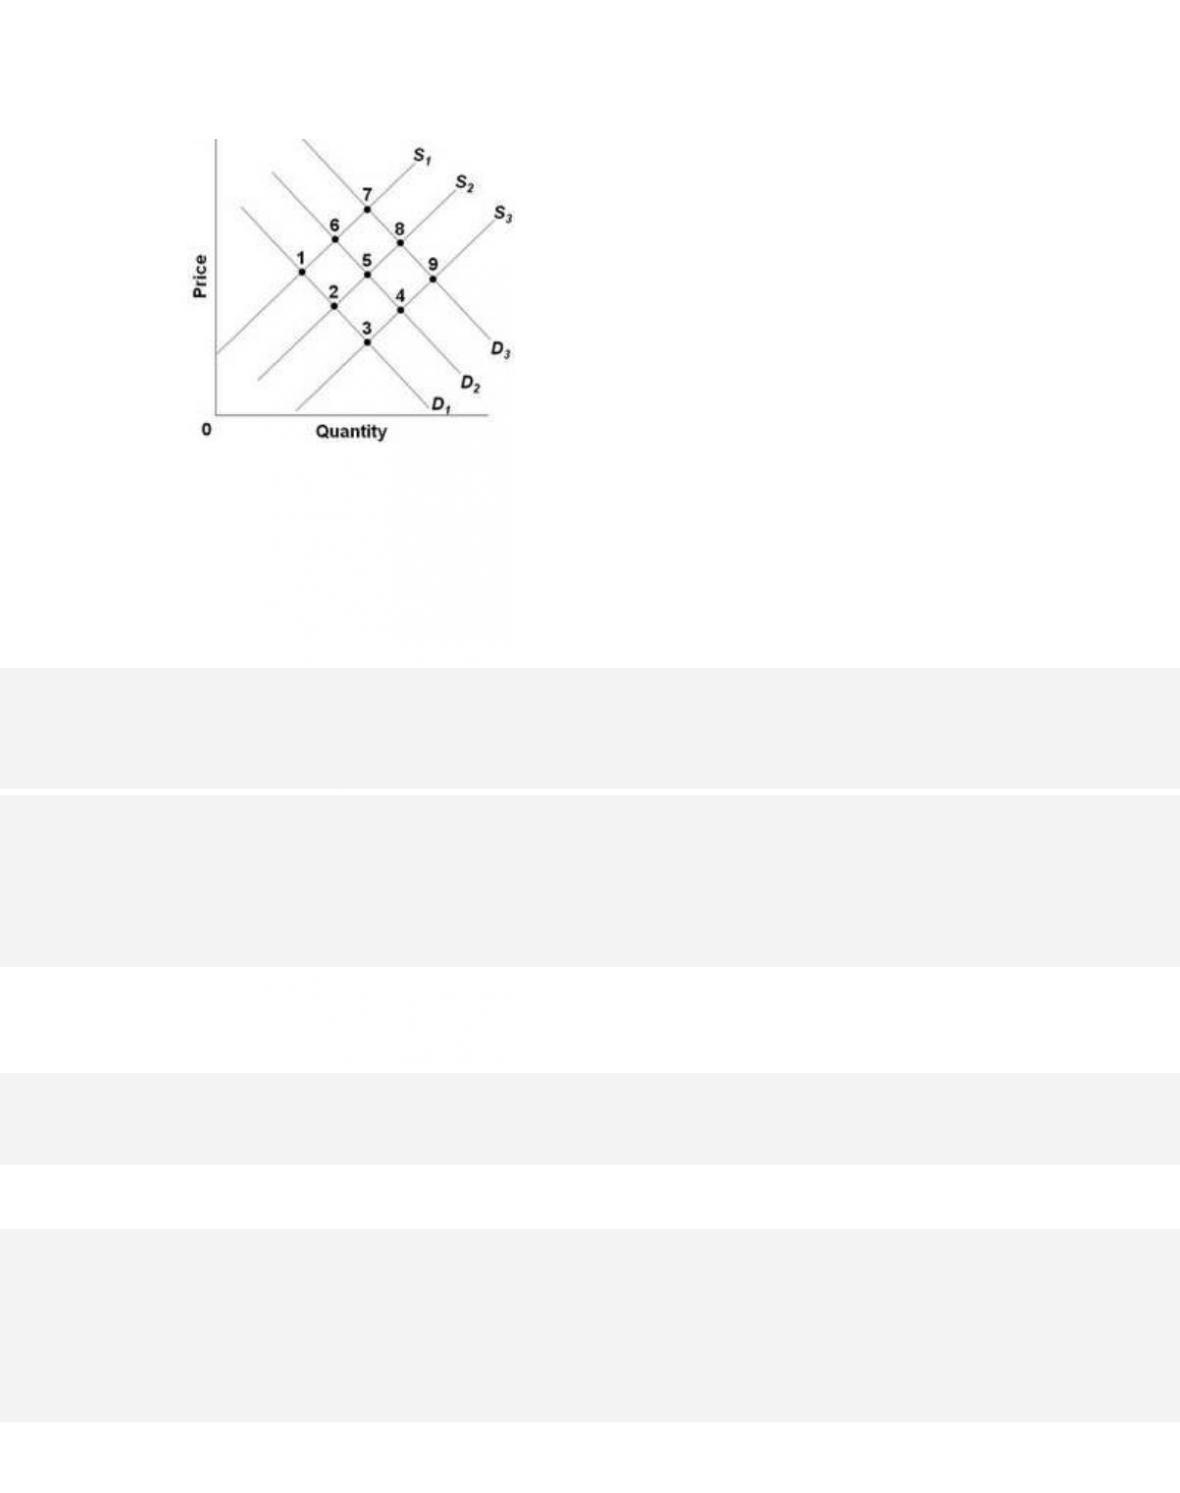
Refer to the graph of the supply and demand for agricultural products. The supply and
demand for agricultural products are in initial equilibrium at point 1. Technological progress
in agriculture
will
A. shift D1 to D2 and cause farm incomes to fall.
147.
If turnips are an example of an inferior good, then a decrease in the demand for turnips
could be brought about by a(n)
D.
decrease in the price of some other product.

22–66
Copyright © 2018 McGraw-Hill Education. All rights reserved. No reproduction or distribution without the prior
written consent of McGraw-Hill Education.
agriculture to other U.S. industries over the past several decades.
Test Bank: II
To pi c: The Long Run: A Declining Industry
148.
Farm employment in the United States amounted to about what percentage of the total
employment in 2015?
D.
close to 20 percent
149.
In the last six-plus decades (1950–2015) farm employment in the U.S. has been
A.
increasing both in absolute numbers and as a proportion of the total employment.
150.
Based on World Bank data for 2011–2014, which of the following countries has the
highest percentage of its labor force still in agriculture?

22–67
151.
The following factors have boosted farm income per farm household in the U.S., except
A.
consolidation of farms.
152.
What has been the effect of the outmigration of people from farming and the
consolidation of smaller farms into larger ones on net farm income per farm household?
A.
It is now far greater than nonfarm income.
153.
The average income of U.S. farm households in 2014 was

A.
less than the average income for all households.
154.
Given the short-run instability of farm incomes, many farmers use some form of
“hedging” to smooth out their incomes over time, including the following, except
A.
crop revenue insurance.
155.
When a buyer or seller of an agricultural commodity takes action to protect against a
future change in the value of the commodity, then the buyer or seller is
A. logrolling.

22–69
Copyright © 2018 McGraw-Hill Education. All rights reserved. No reproduction or distribution without the prior
written consent of McGraw-Hill Education.
Learning Objective: 22–02 Discuss why there has been a huge employment exodus from
agriculture to other U.S. industries over the past several decades.
Test Bank: II
To pi c: The Long Run: A Declining Industry
156.
Which one of the following would be considered to be a risk management technique
used by farmers?
A.
changing the parity ratio
157.
Since the 1930s, the U.S. government has subsidized agriculture with a “farm program”
that includes the following, except
D.
farm credit and financing.
158.
Farm policy in the United States over the past eight decades has been designed
primarily to
A.
shift resources from the farm sector to the nonfarm sector.

22–70
Copyright © 2018 McGraw-Hill Education. All rights reserved. No reproduction or distribution without the prior
written consent of McGraw-Hill Education.
C.
enhance and stabilize farm prices and income.
D. produce a strategic reserve of food.
159.
Since the 1930s, the U.S. government has supported agriculture with a “farm program”
that includes the following, except
D.
soil and water conservation.
160.
Between 2002 and 2011, U.S. farmers received yearly direct subsidies from the federal
government averaging about
A.
$2 billion.

22–71
Copyright © 2018 McGraw-Hill Education. All rights reserved. No reproduction or distribution without the prior
written consent of McGraw-Hill Education.
To pi c: Economics of Farm Policy
161.
In which of the following countries do farmers receive the largest percentage of their
incomes as government subsidies?
D.
United States
162.
Which of the following is a major justification for public aid to agriculture in the
United States?
A.
The demand for farm products is income elastic.
163.
Which statement is correct?
A. Farmers fared considerably better than most other economic groups during the Great
Depression.

22–72
Copyright © 2018 McGraw-Hill Education. All rights reserved. No reproduction or distribution without the prior
written consent of McGraw-Hill Education.
farmers.
D.
The use of price supports has accelerated the exodus of resources from agriculture.
AACSB: Knowledge Application
Accessibility: Keyboard Navigation
Blooms: Understand
Di f fic u lty : 02 Medium
Learning Objective: 22–03 Relate the rationale for farm subsidies and the economics and
politics of price supports price floors.
Test Bank: II
To pi c: Economics of Farm Policy
164.
Which of the following illustrates the basic idea of “parity” as a cornerstone of U.S.
agricultural policy?
A.
The price of corn per bushel should be held constant.
165.
Which of the following is not a goal of the “parity concept” in U.S. agriculture policy?
A.
Farm households’ real income from a given amount of real output should stay the same
from year to year.

22–73
Copyright © 2018 McGraw-Hill Education. All rights reserved. No reproduction or distribution without the prior
written consent of McGraw-Hill Education.
AACSB: Knowledge Application
Accessibility: Keyboard Navigation
Blooms: Understand
Di f fic u lty : 02 Medium
Learning Objective: 22–03 Relate the rationale for farm subsidies and the economics and
politics of price supports price floors.
Test Bank: II
To pi c: Economics of Farm Policy
166.
The price parity concept, which is a cornerstone of U.S. agricultural policy, was
established by the
A. Agricultural Income Act of 1914.
167.
A declining parity ratio implies that the
D.
prices paid and received by farmers are both falling.
168.
The concept of parity in farm policy implies that

22–74
Copyright © 2018 McGraw-Hill Education. All rights reserved. No reproduction or distribution without the prior
written consent of McGraw-Hill Education.
A. farm incomes should remain stable over the business cycle.
B.
a given output should always provide the farmer with the same real income.
C.
the purchasing power of the farmer’s dollar should rise each year.
D.
the prices of farm commodities should remain stable.
169.
A parity ratio of 0.6 in year A means that prices
D.
paid by farmers in year A had risen by 60 percent over the prices paid in the base period.
170.
If the parity ratio goes from 0.8 to 0.7, it means that the prices received by farmers had
D.
risen by 10 percent relative to the prices they paid.

22–75
Copyright © 2018 McGraw-Hill Education. All rights reserved. No reproduction or distribution without the prior
written consent of McGraw-Hill Education.
To pi c: Economics of Farm Policy
171.
The parity ratio initially stood at 0.50. Then after several years, the prices received by
farmers doubled while the prices they paid tripled. This will bring the parity ratio to
A. 0.25.
172.
The price of a certain farm product was $1.25 in the base period when the parity ratio
was 100. If the index of prices paid by farmers is now at 140, then the parity price of this
farm product today
should be
A. $0.90.
22–76
173.
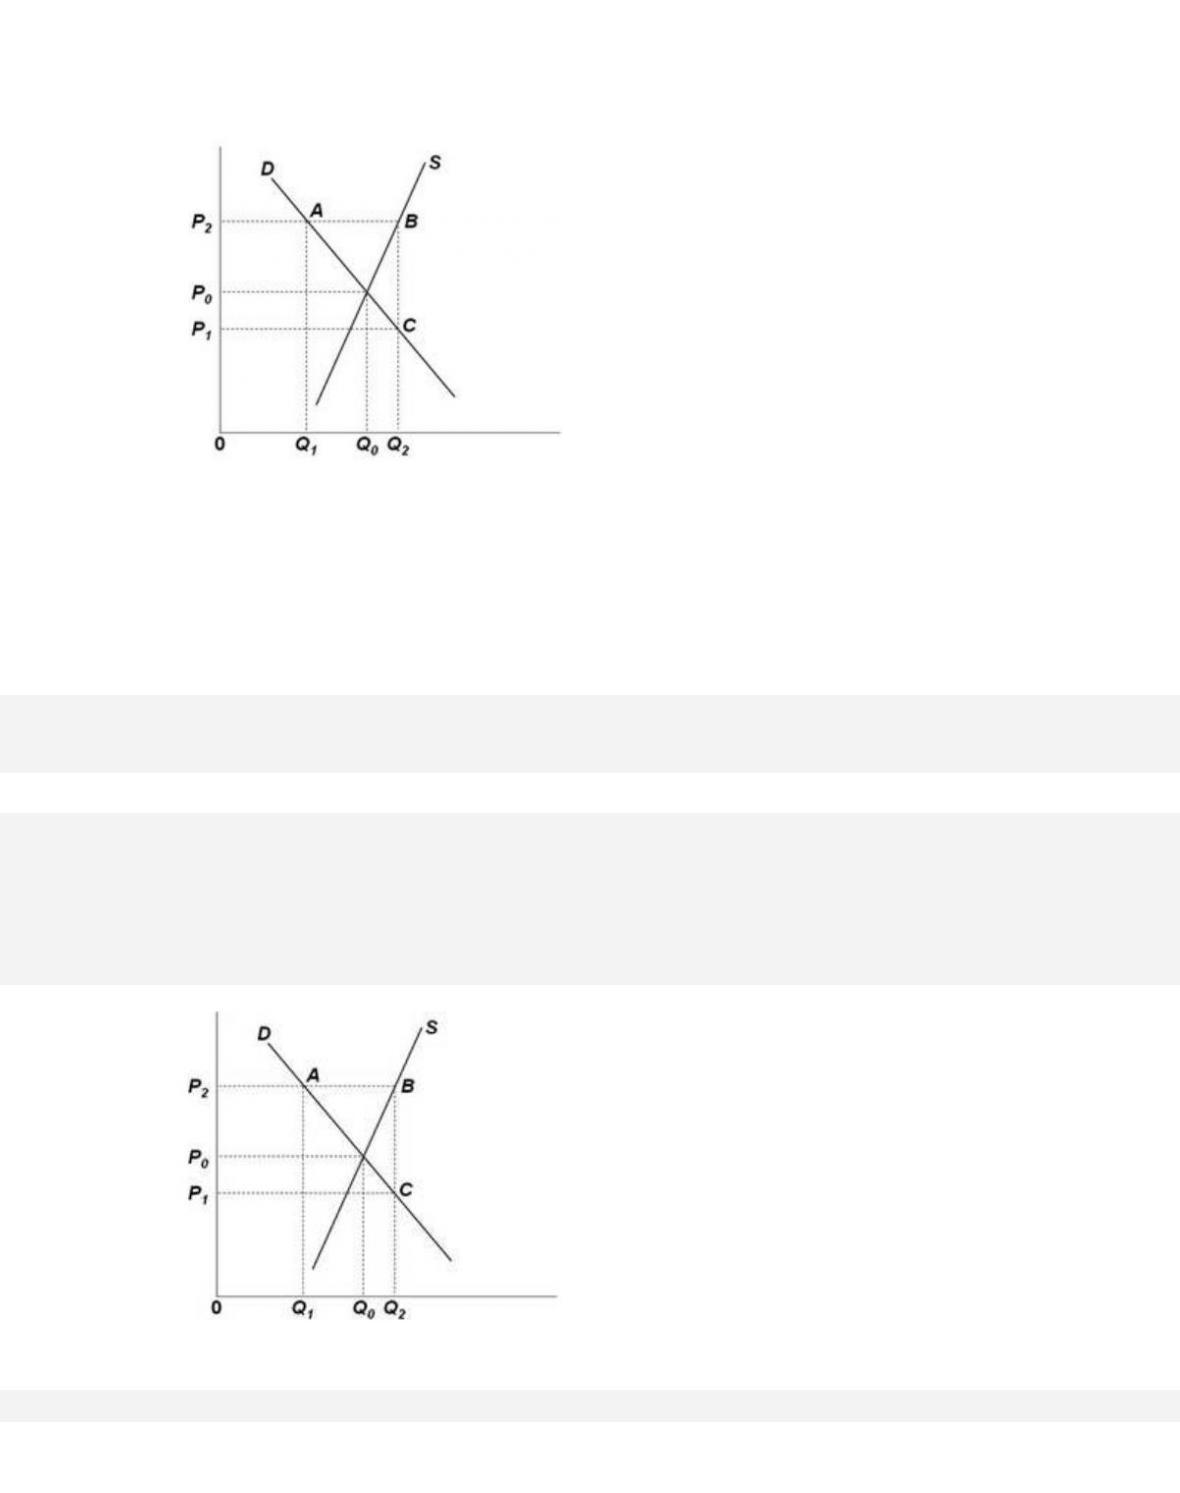
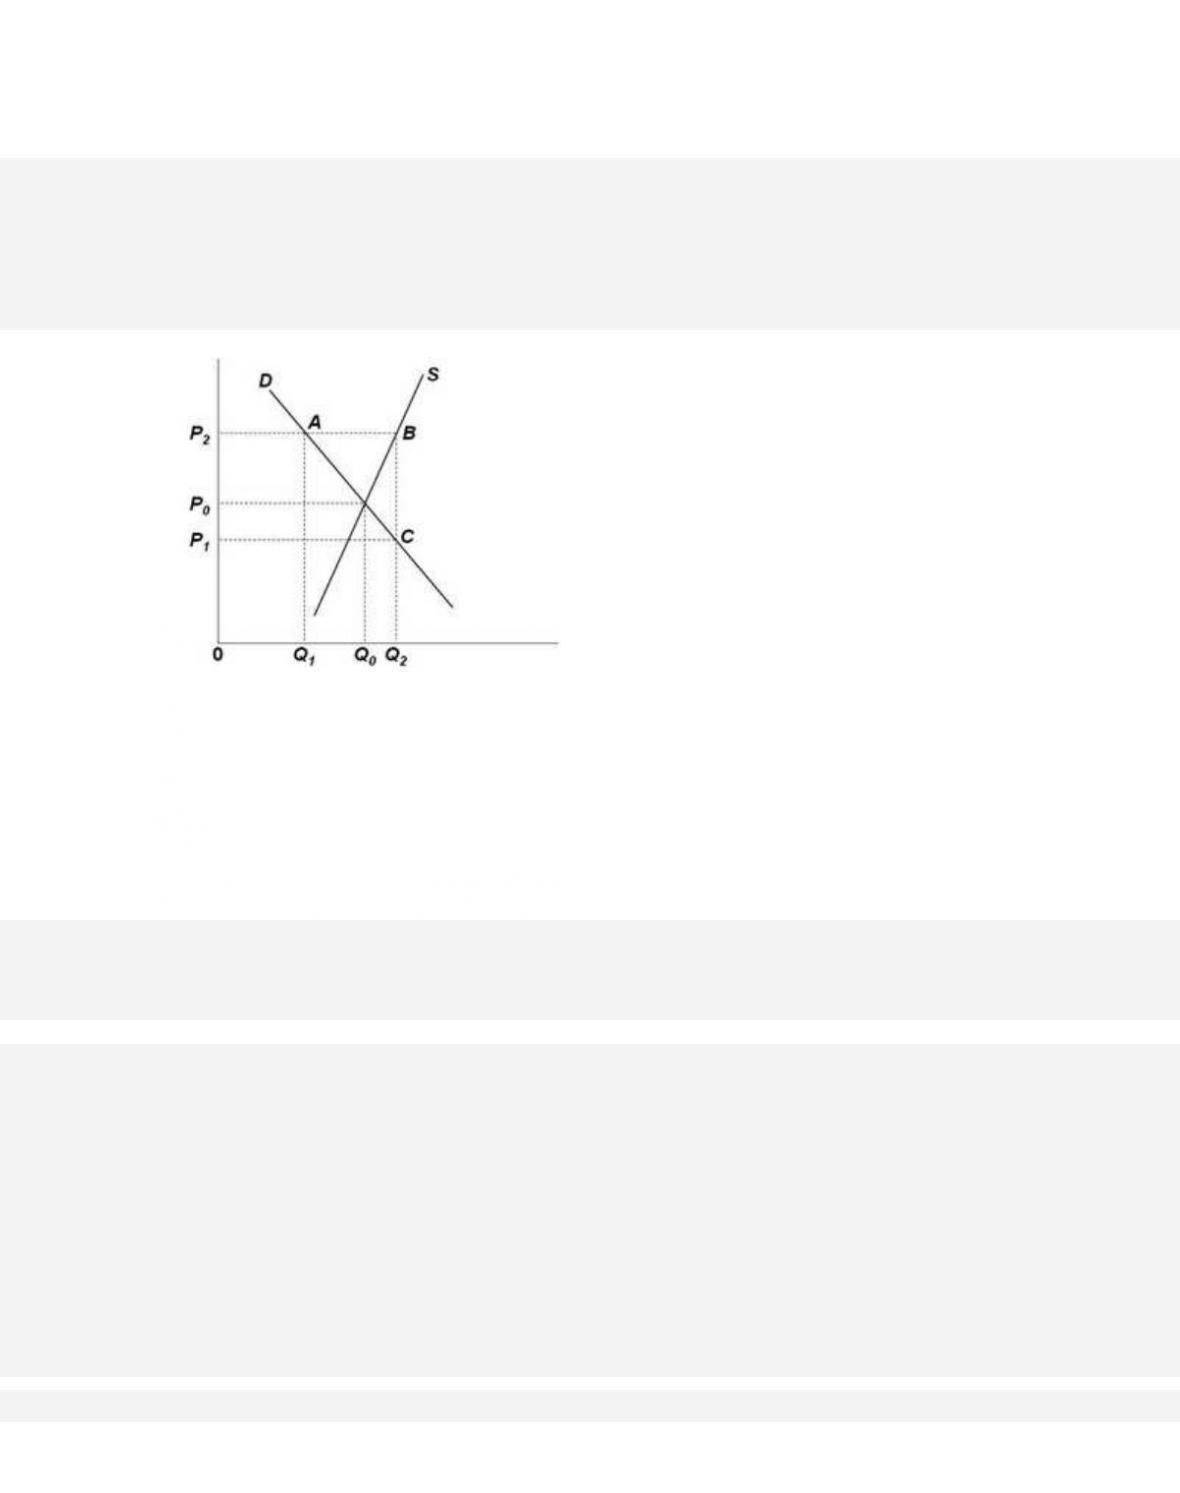
Refer to the graph of the market for wheat. The government adopts a price support program
for wheat and supports the wheat price at P2. The area of Q1ABQ2 would measure the
A.
total amount received by farmers from selling wheat.
174.
22–77
Refer to the graph of the market for wheat. The government adopts a price support program
for wheat and supports the wheat price at P2. The area of 0P2AQ1 would measure the
A.
total amount received by wheat farmers.
175.
Refer to the graph of the market for wheat. The government adopts a price support program
for wheat and supports the wheat price at P2. The area Q1ABQ2 represents the
A. parity ratio.
22–78
Copyright © 2018 McGraw-Hill Education. All rights reserved. No reproduction or distribution without the prior
written consent of McGraw-Hill Education.
AACSB: Knowledge Application
Blooms: Understand
Di f fic u lty : 02 Medium
Learning Objective: 22–03 Relate the rationale for farm subsidies and the economics and
politics of price supports price floors.
Test Bank: II
To pi c: Economics of Farm Policy
176.
Refer to the graph of the market for wheat. The government adopts a price support program
for wheat and supports the wheat price at P2. The triangular area defined by points B and C
and the
intersection of the supply and demand curve represents the
A.
parity ratio.
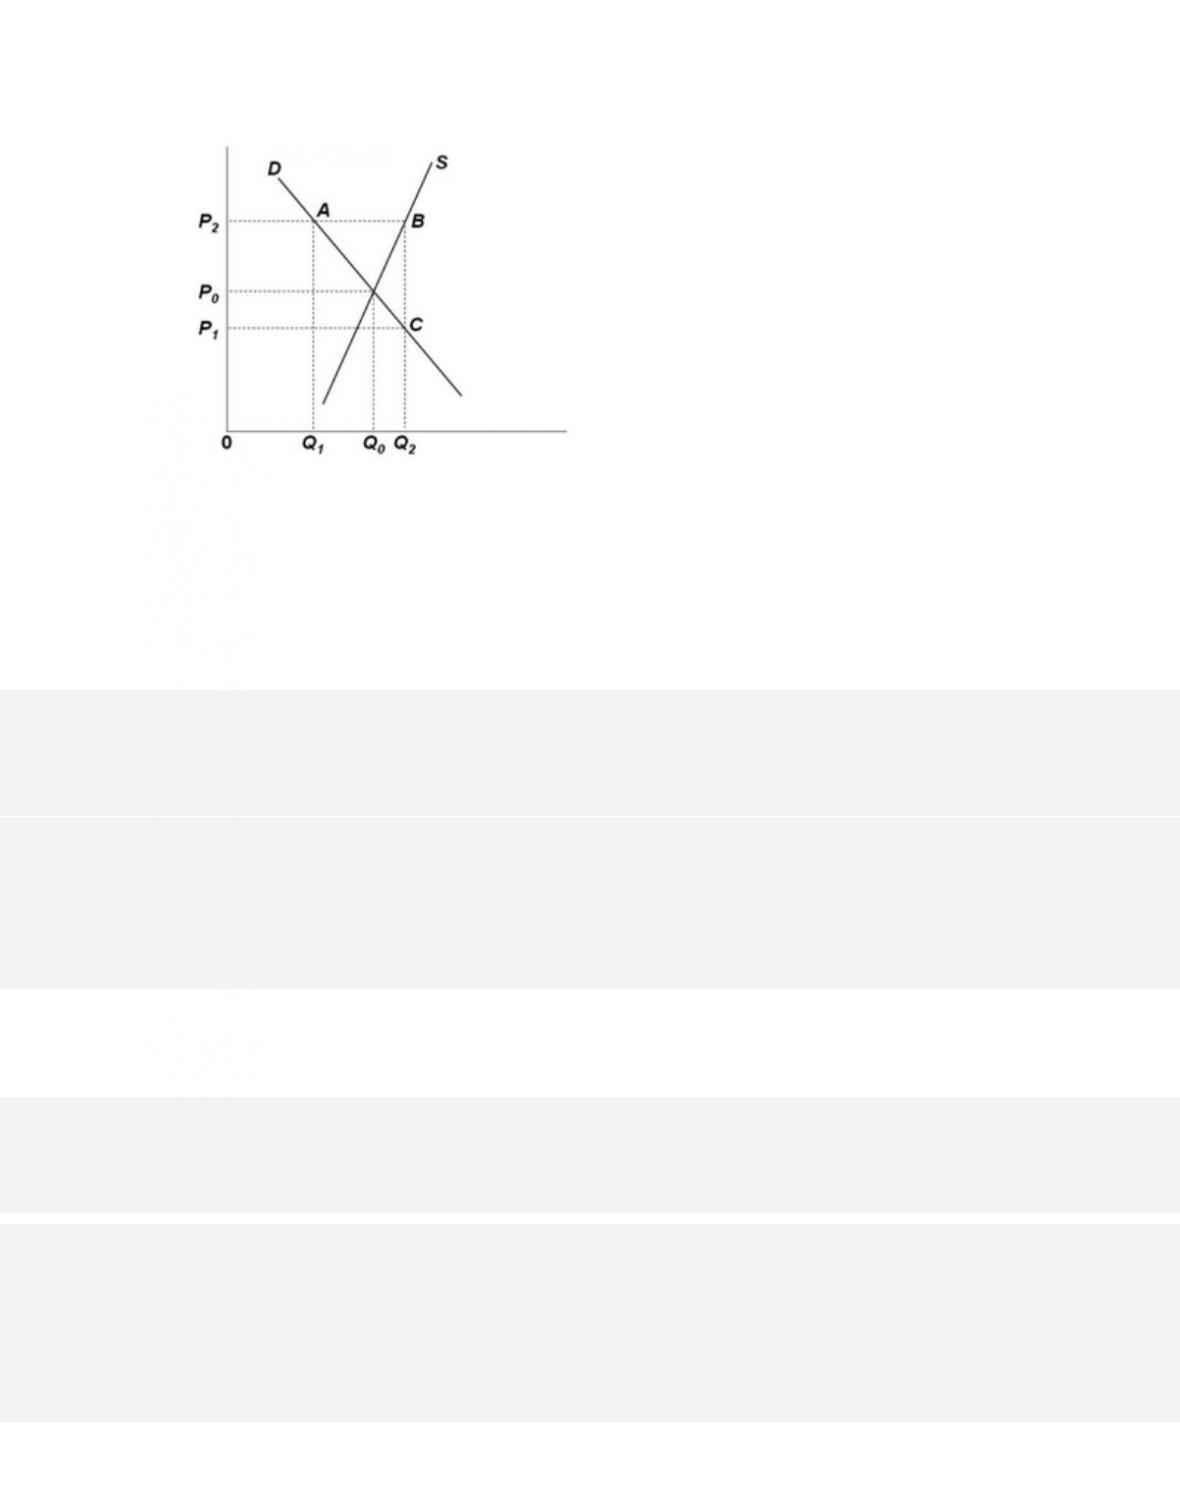
177.
Refer to the graph of the market for wheat. The government adopts a price support program
for wheat and supports the wheat price at P2. As a result of this price support program,
A. there will be a shortage of wheat in the amount of AB.
178.
Farm price support programs tend to
A.
benefit both farmers and consumers of the farm products.

22–80
Copyright © 2018 McGraw-Hill Education. All rights reserved. No reproduction or distribution without the prior
written consent of McGraw-Hill Education.
politics of price supports price floors.
Test Bank: II
To pi c: Economics of Farm Policy
179.
Farm price support programs have other costs besides the amount paid to farmers, and
these costs include the following, except
D.
environmental costs.
180.
Price
Quantity Supplied (Bushels)
Quantity Demanded (Bushels)
$4
100
400
5
140
340
6
180
280
7
220
220
8
260
160
9
300
100
10
340
40
Refer to the table. In a competitive market for this agricultural product, the equilibrium price
and output level will be
A. $6 and 180 bushels.