249.
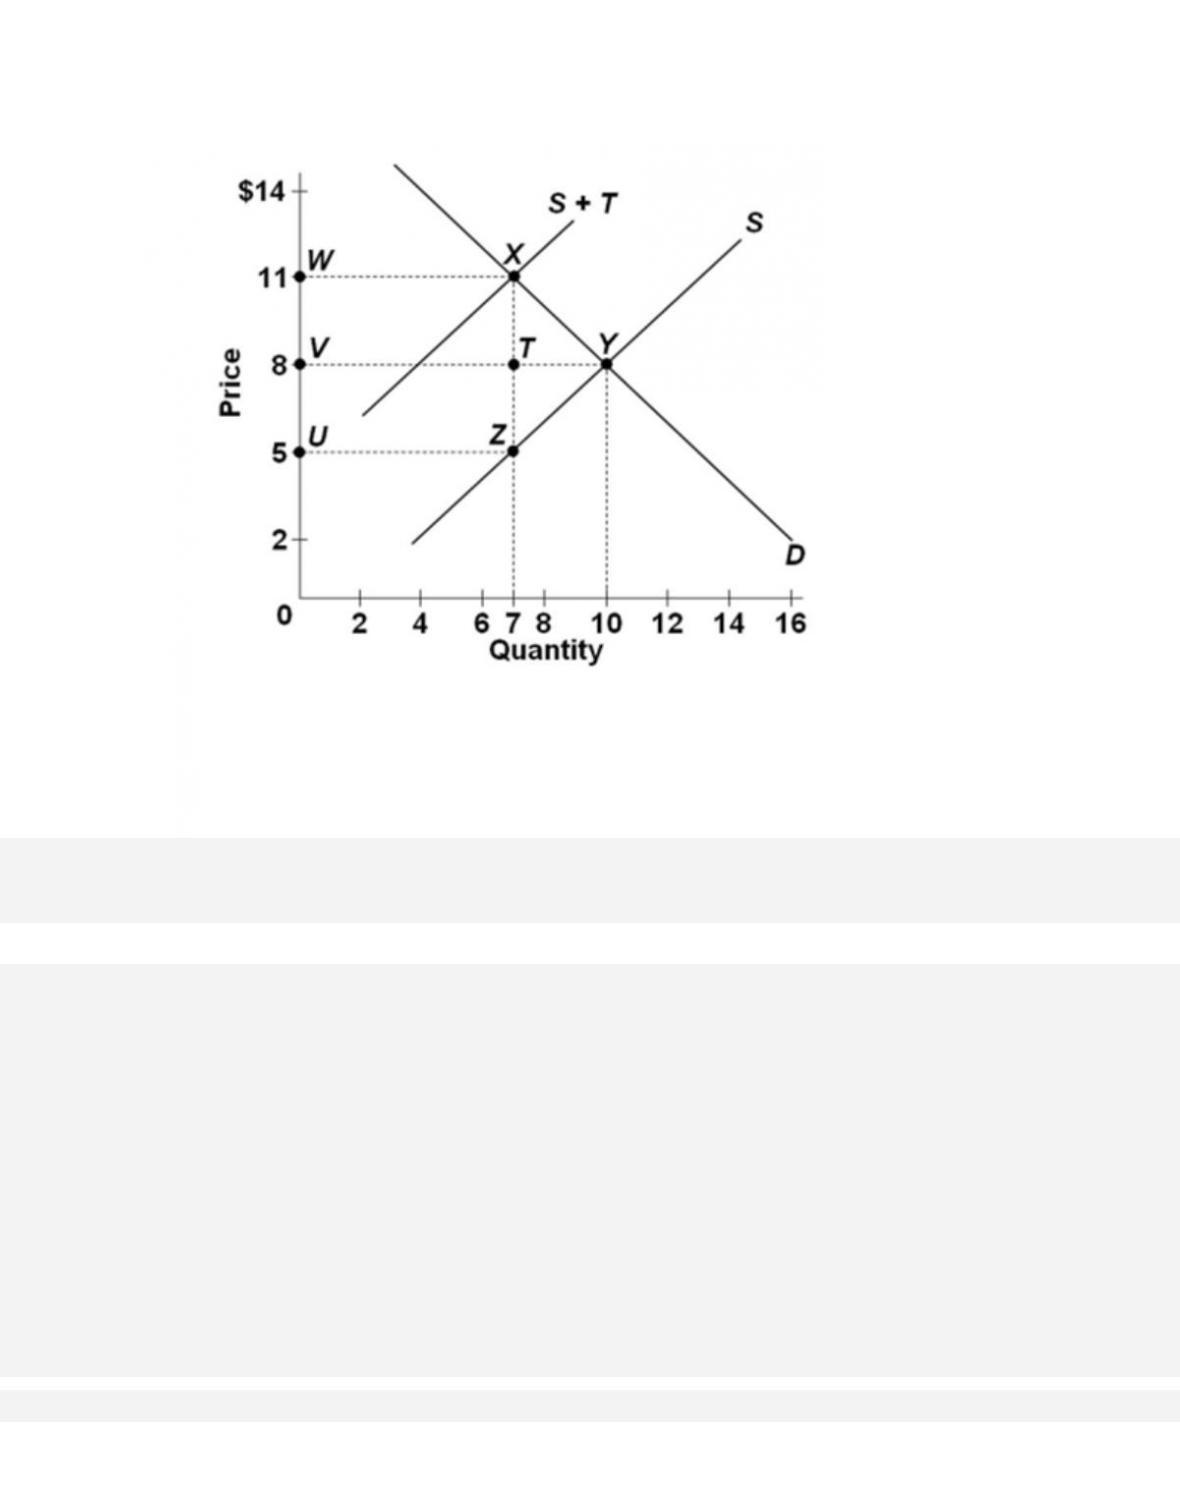
The graph illustrates the market for a product on which an excise tax has been imposed by
government. How much is the efficiency (or deadweight) loss due to the excise tax?
A. $6
250.
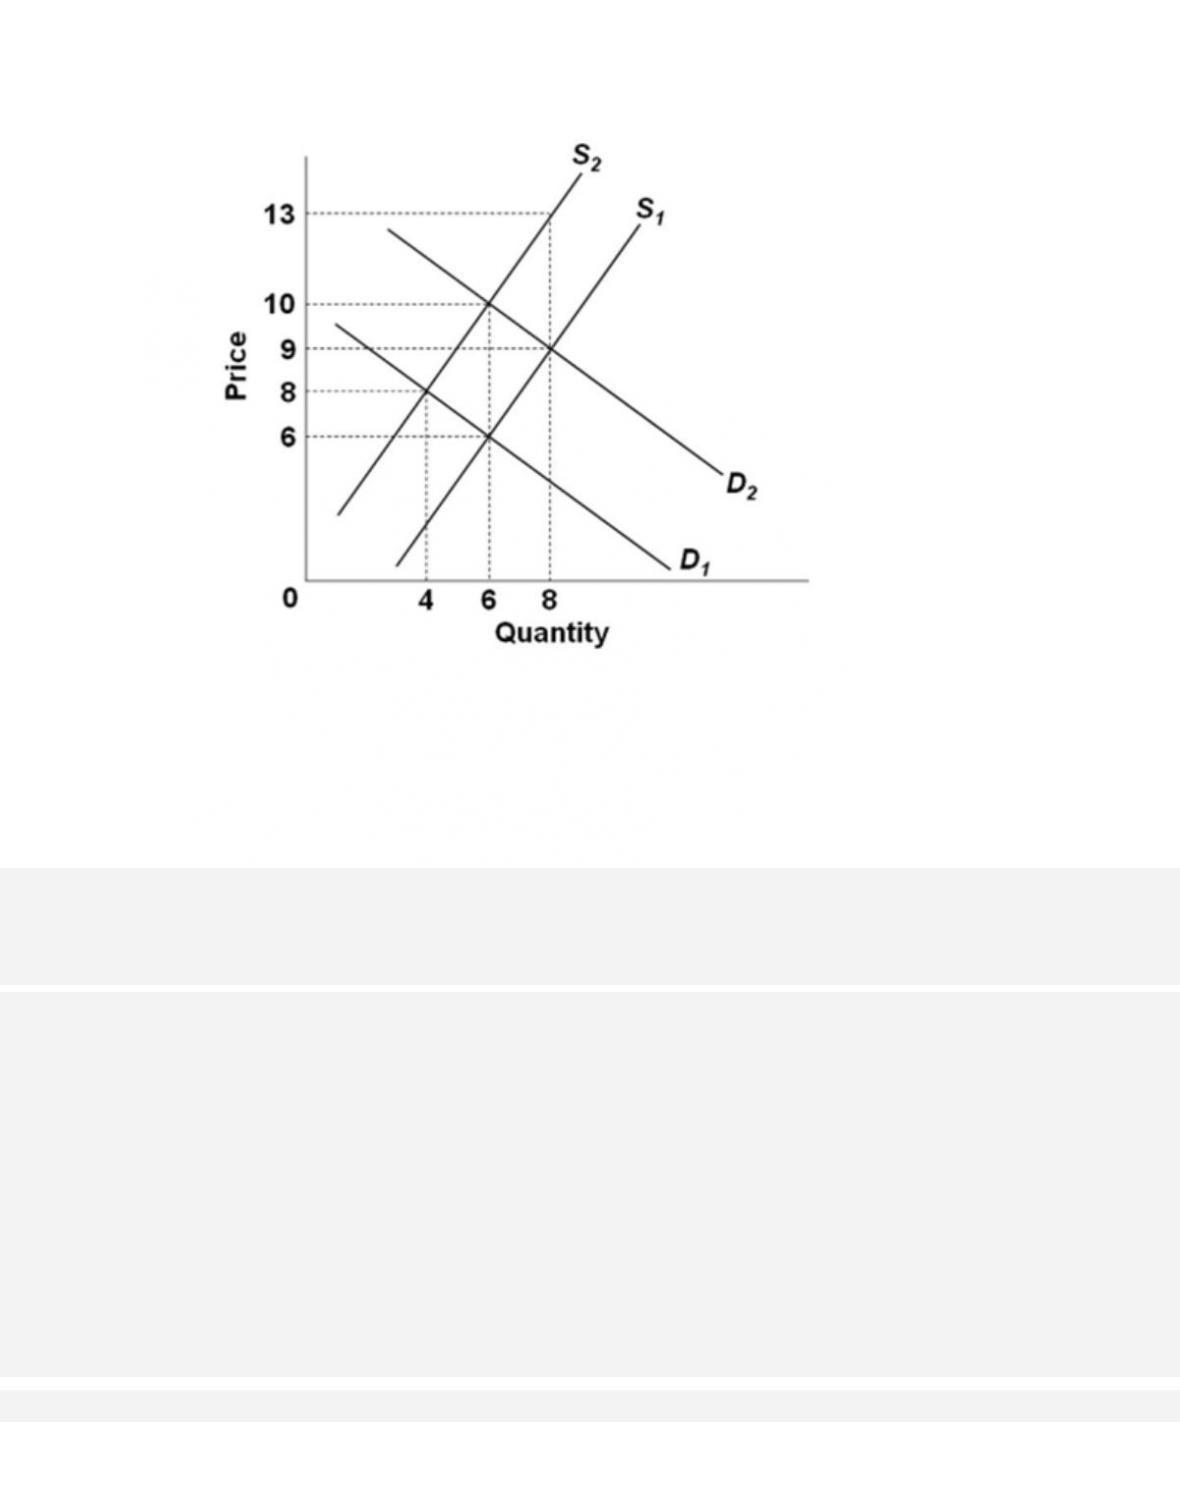
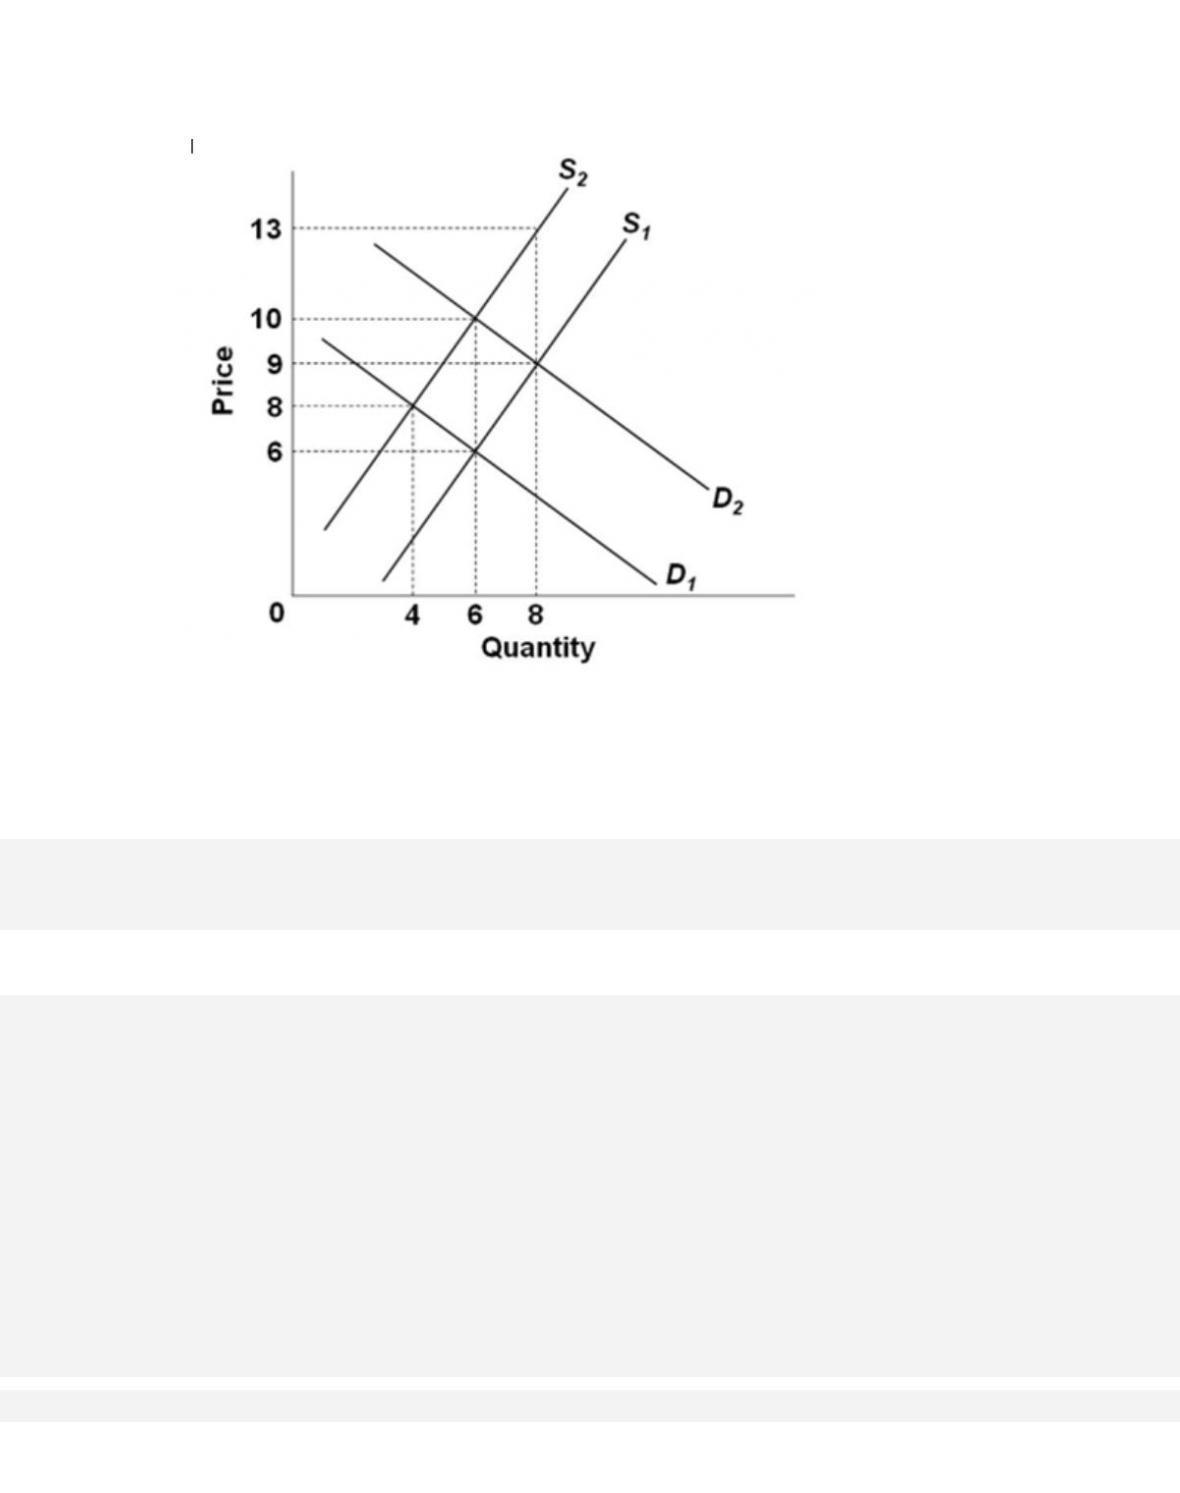
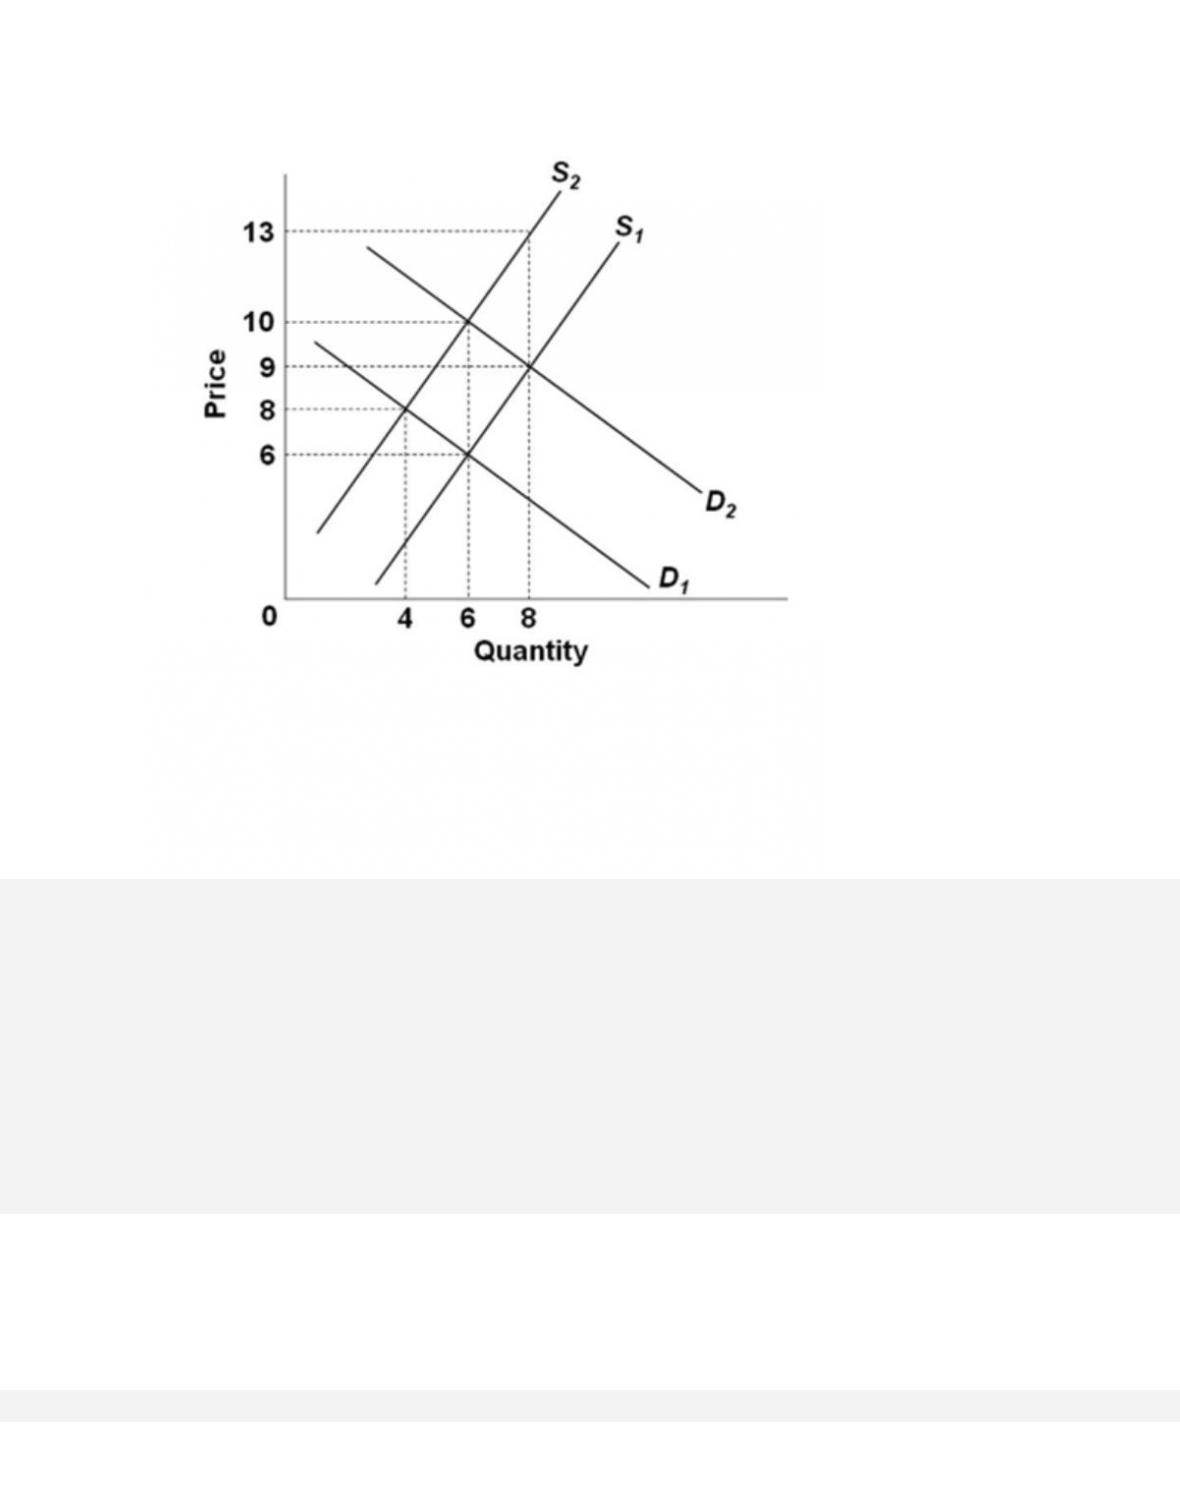
Refer to the graph. Assume the market for this product is in equilibrium at the intersection of
D2 and S1. The shift in supply from S1 to S2 is due to an excise tax imposed on the product.
How much is the tax per unit of product?
A. $2
251.
Refer to the graph. Assume the market for this product is in equilibrium at the intersection of
D2 and S1. The shift in supply from S1 to S2 is due to an excise tax imposed on the product.
The incidence of the tax is
D. $4 from the buyers and $0 from the sellers.

252.
Refer to the graph. Assume the market for this product is initially in equilibrium at the
intersection of D2 and S1. The shift in supply from S1 to S2 is due to an excise tax imposed on
the product. The excise tax revenue collected by the government will be
A. $60.
20-125
253.
Refer to the graph. Assume the market for this product started out at the intersection of D2 and
S1. Then supply shifted from S1 to S2 due to an excise tax imposed on the product. If demand
subsequently shifts from D2 to D1, then which of the following will decrease?
A. the tax per unit of the product
254.
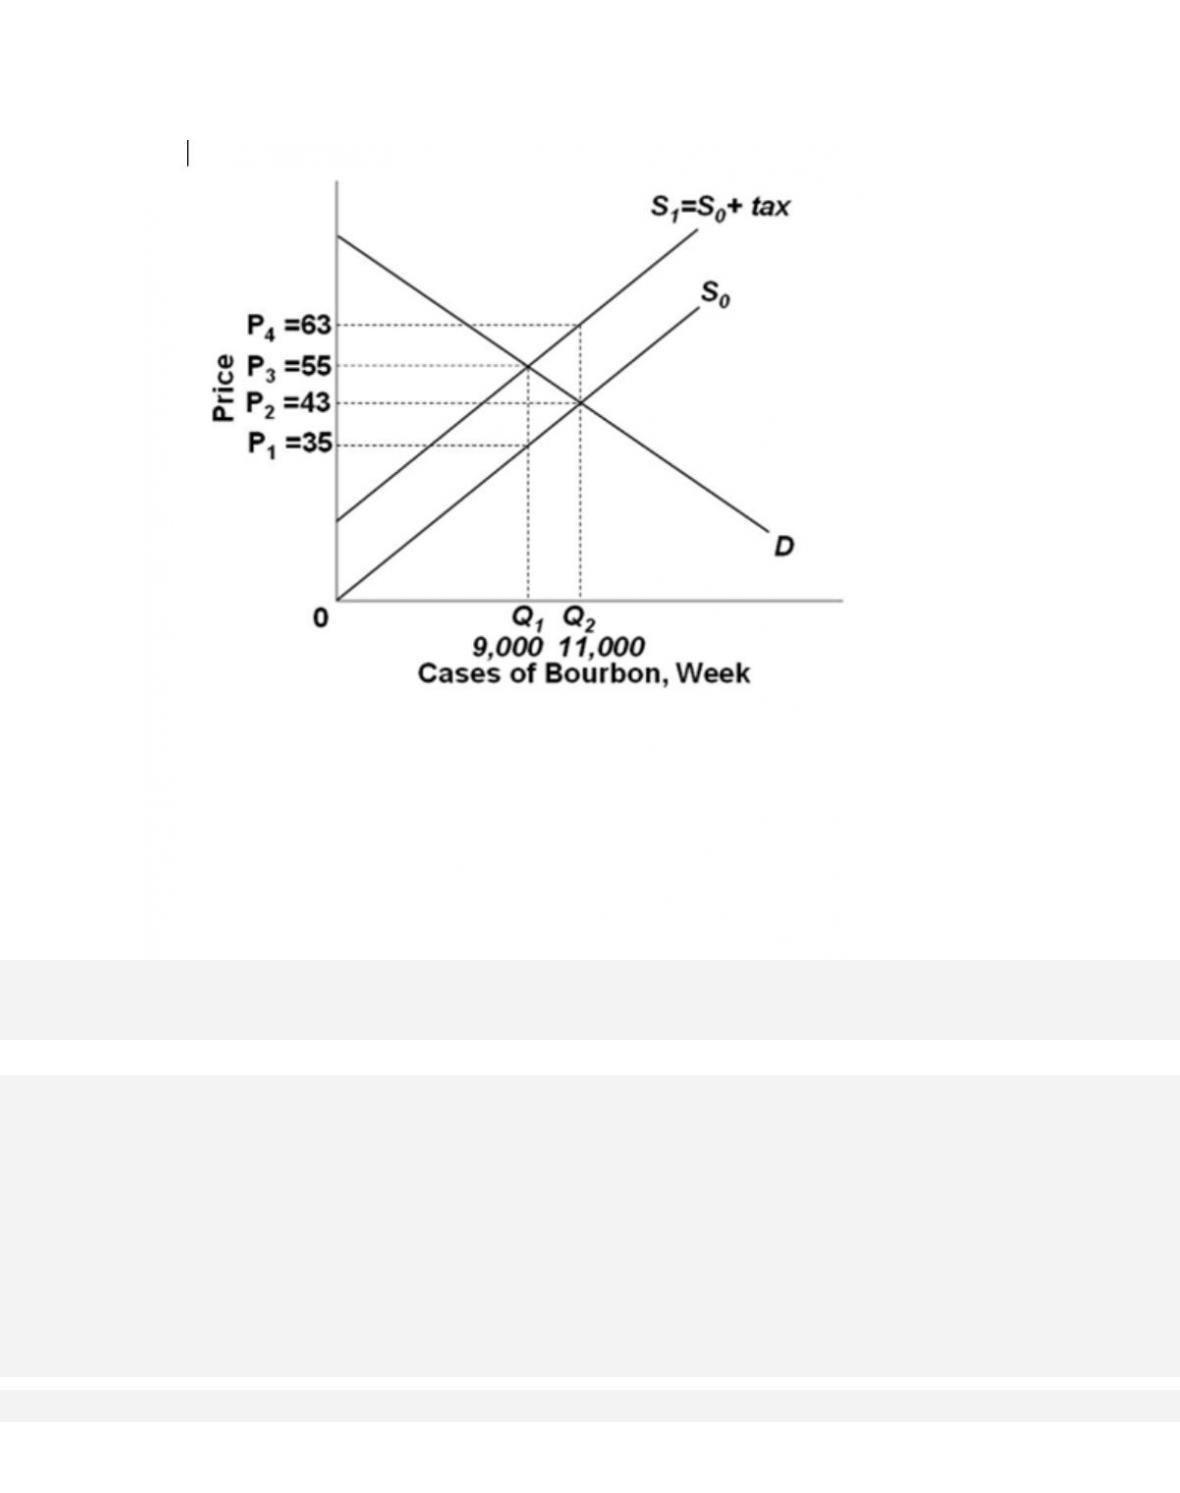
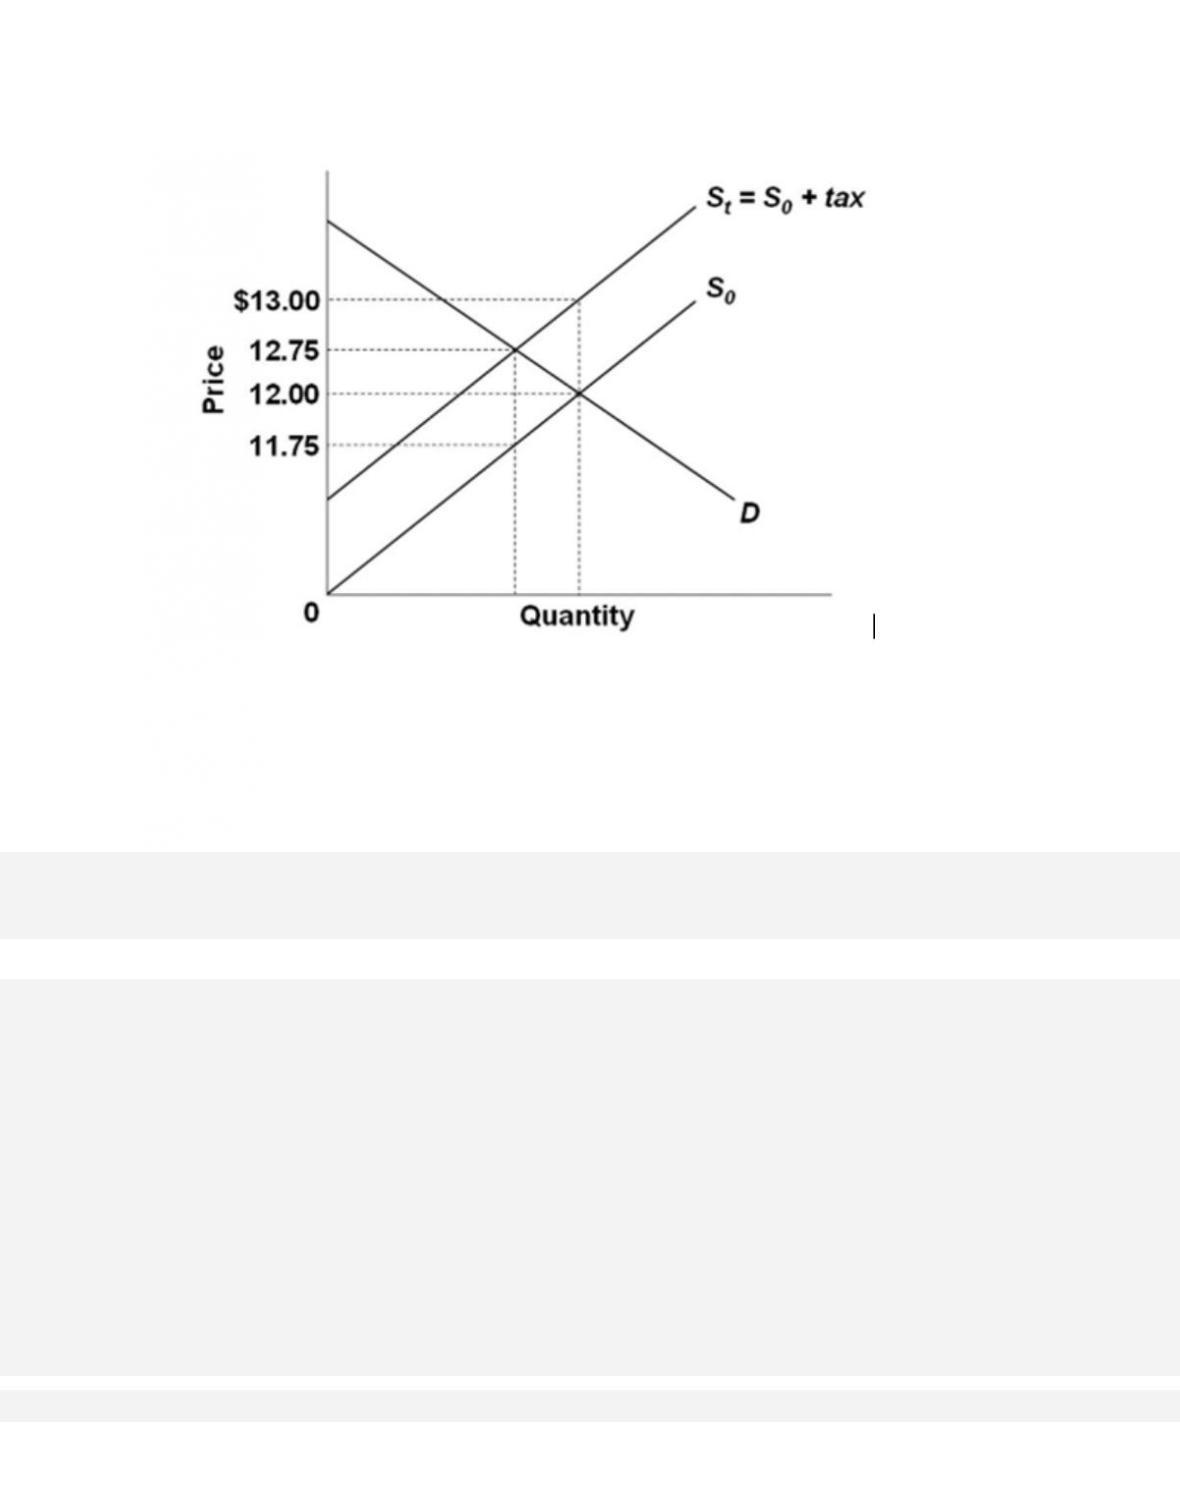
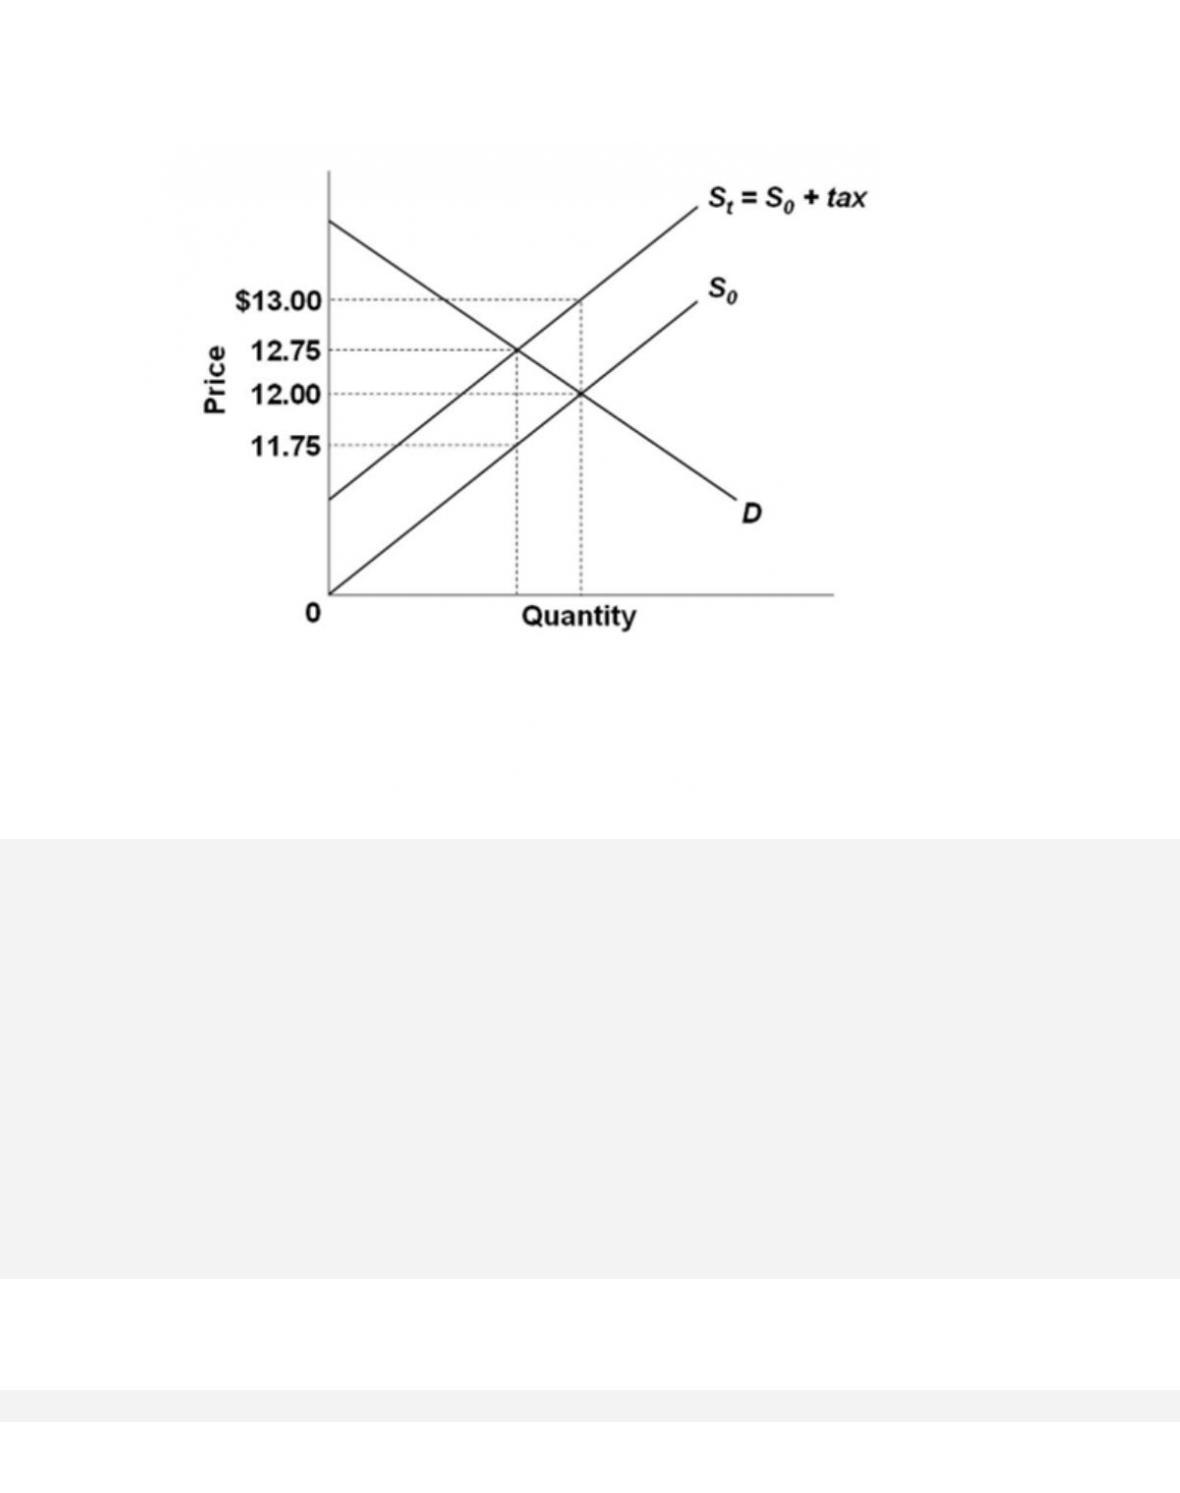
In the graph,
S0 = supply curve for bourbon (seller’s supply) D = demand curve for bourbon
St = supply for bourbon plus excise tax on bourbon (effective supply as seen by buyers) tax =
an excise tax on bourbon (of $20 per case)
The excise tax on bourbon as described in the diagram is ultimately paid
A. by buyers only.
255.
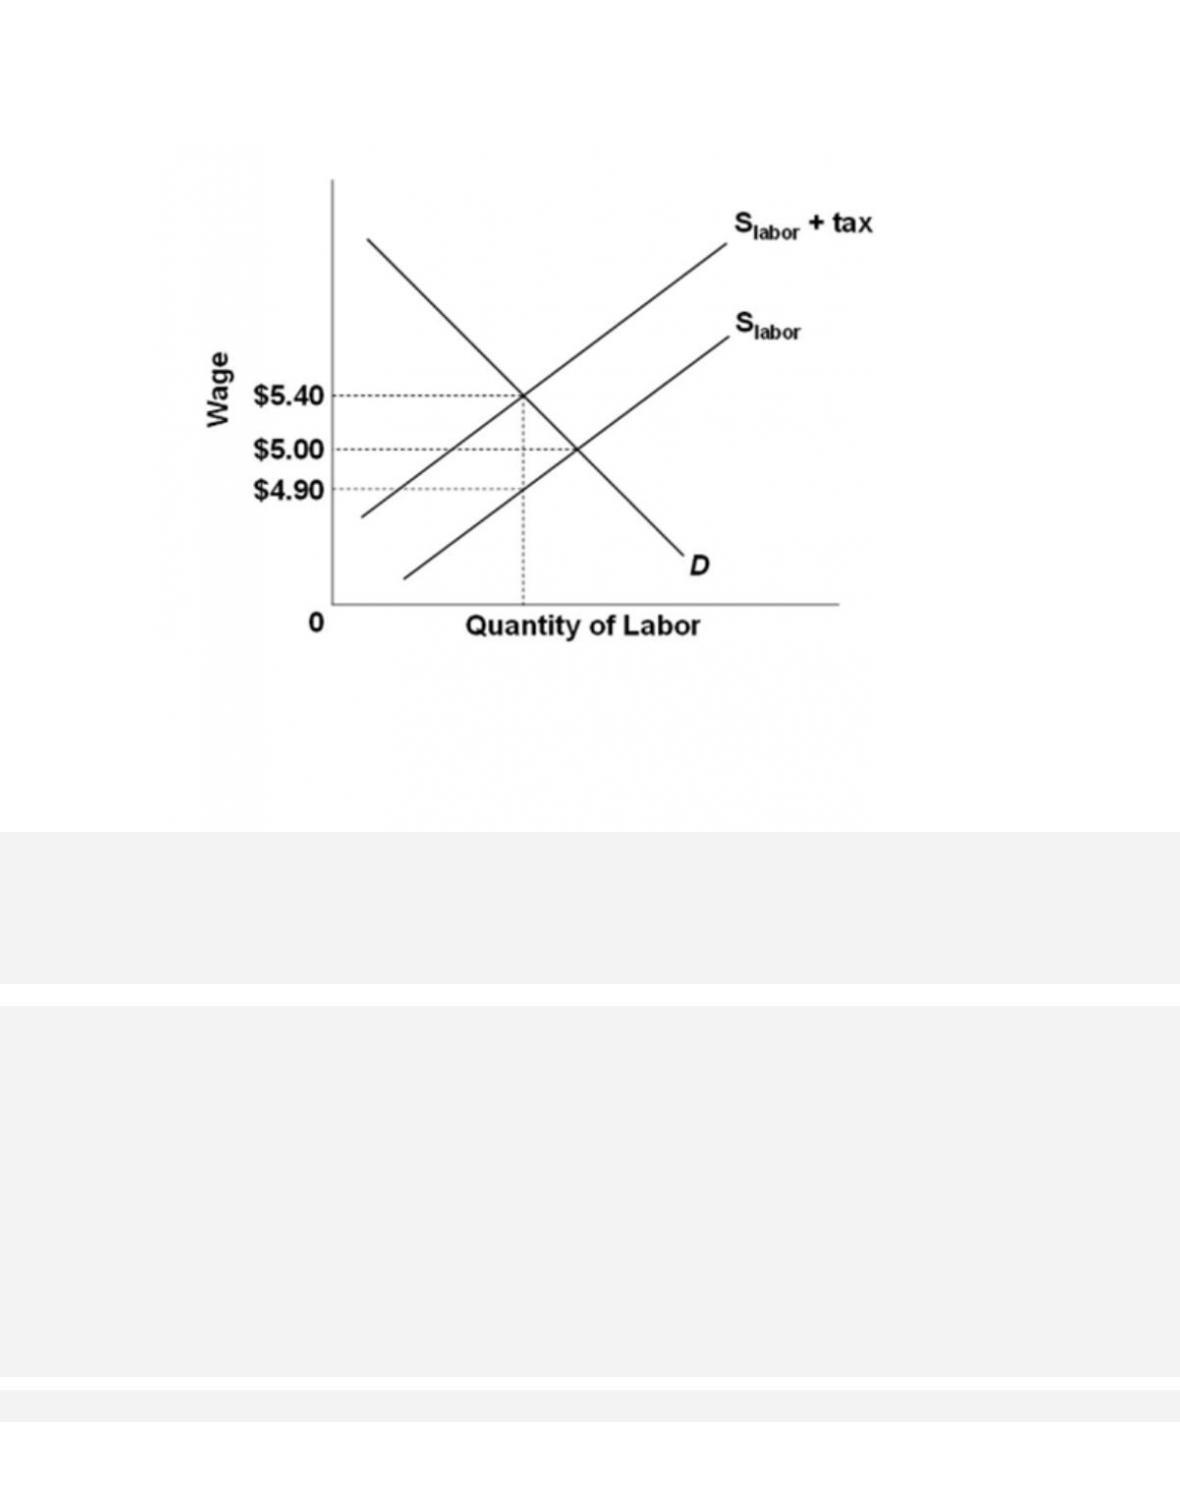
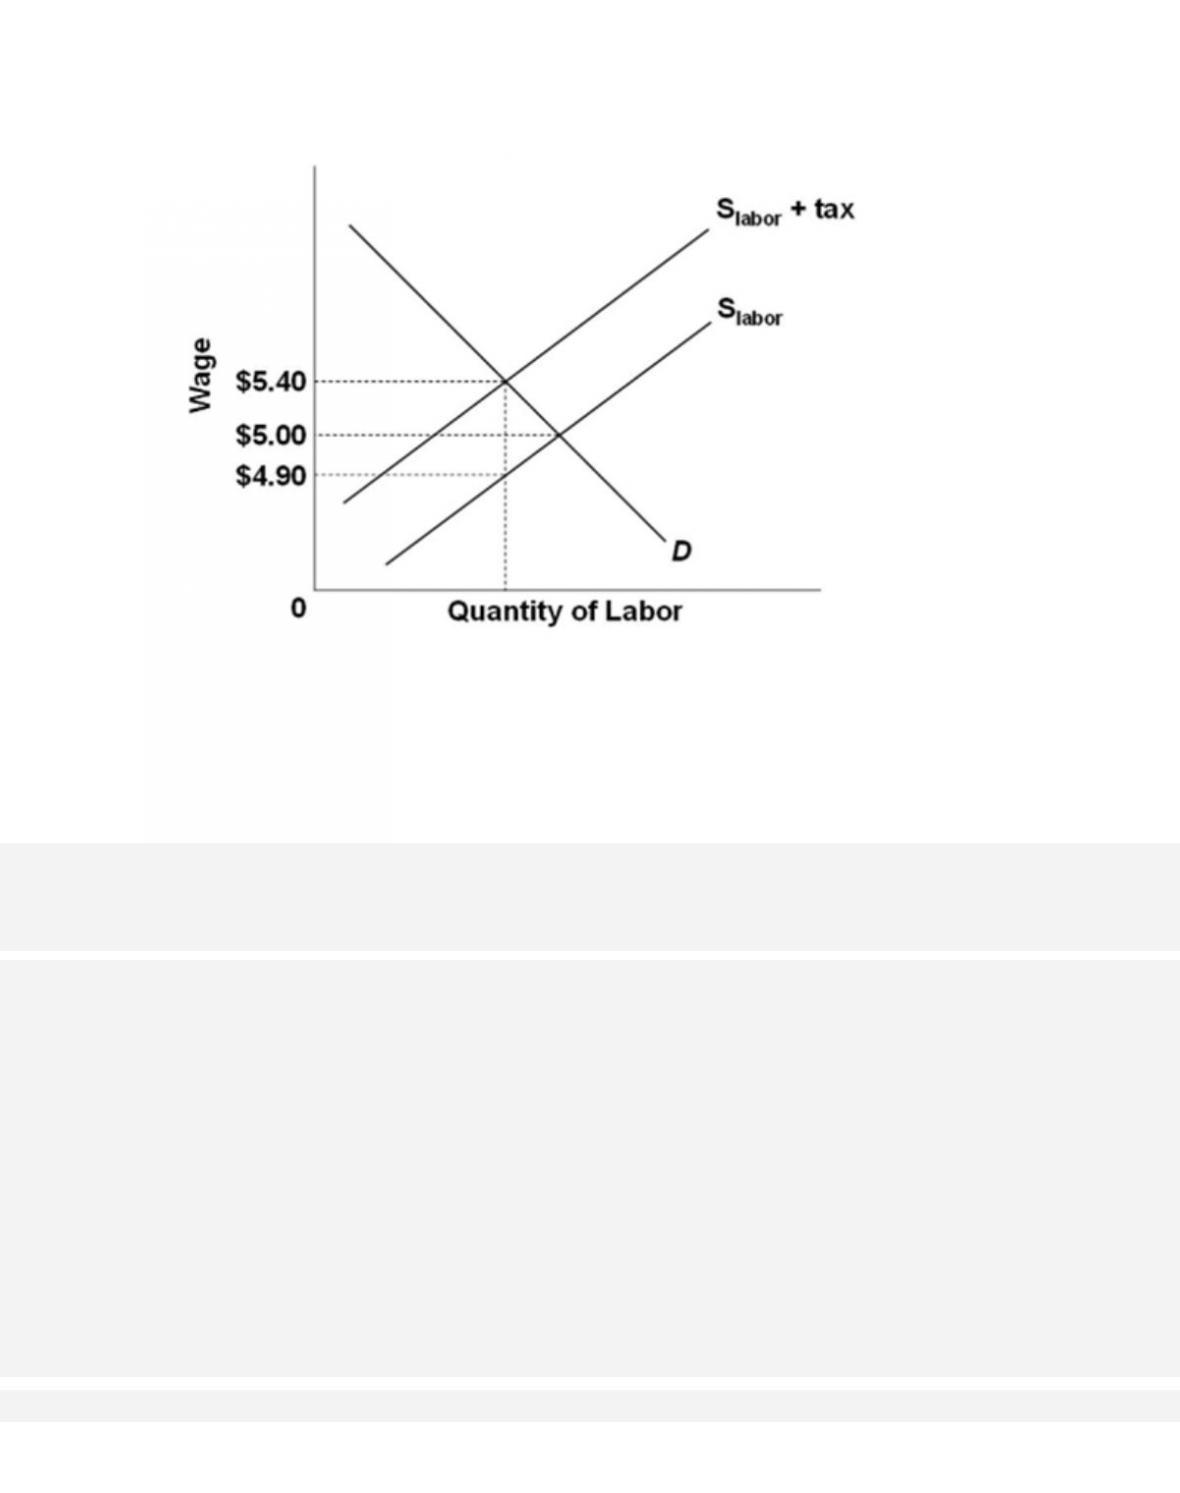
Refer to the graph for the labor market. The government decides to impose a wage tax as shown
on the graph. The result is that
A. more workers enter the labor market due to the higher wage rate being paid.
256.
Refer to the graph for the labor market. The government decides to impose a wage tax as shown
on the graph. If the number of workers hired after the imposition of the tax is 1,000, then the
total amount of the tax is
A. $200.
257.
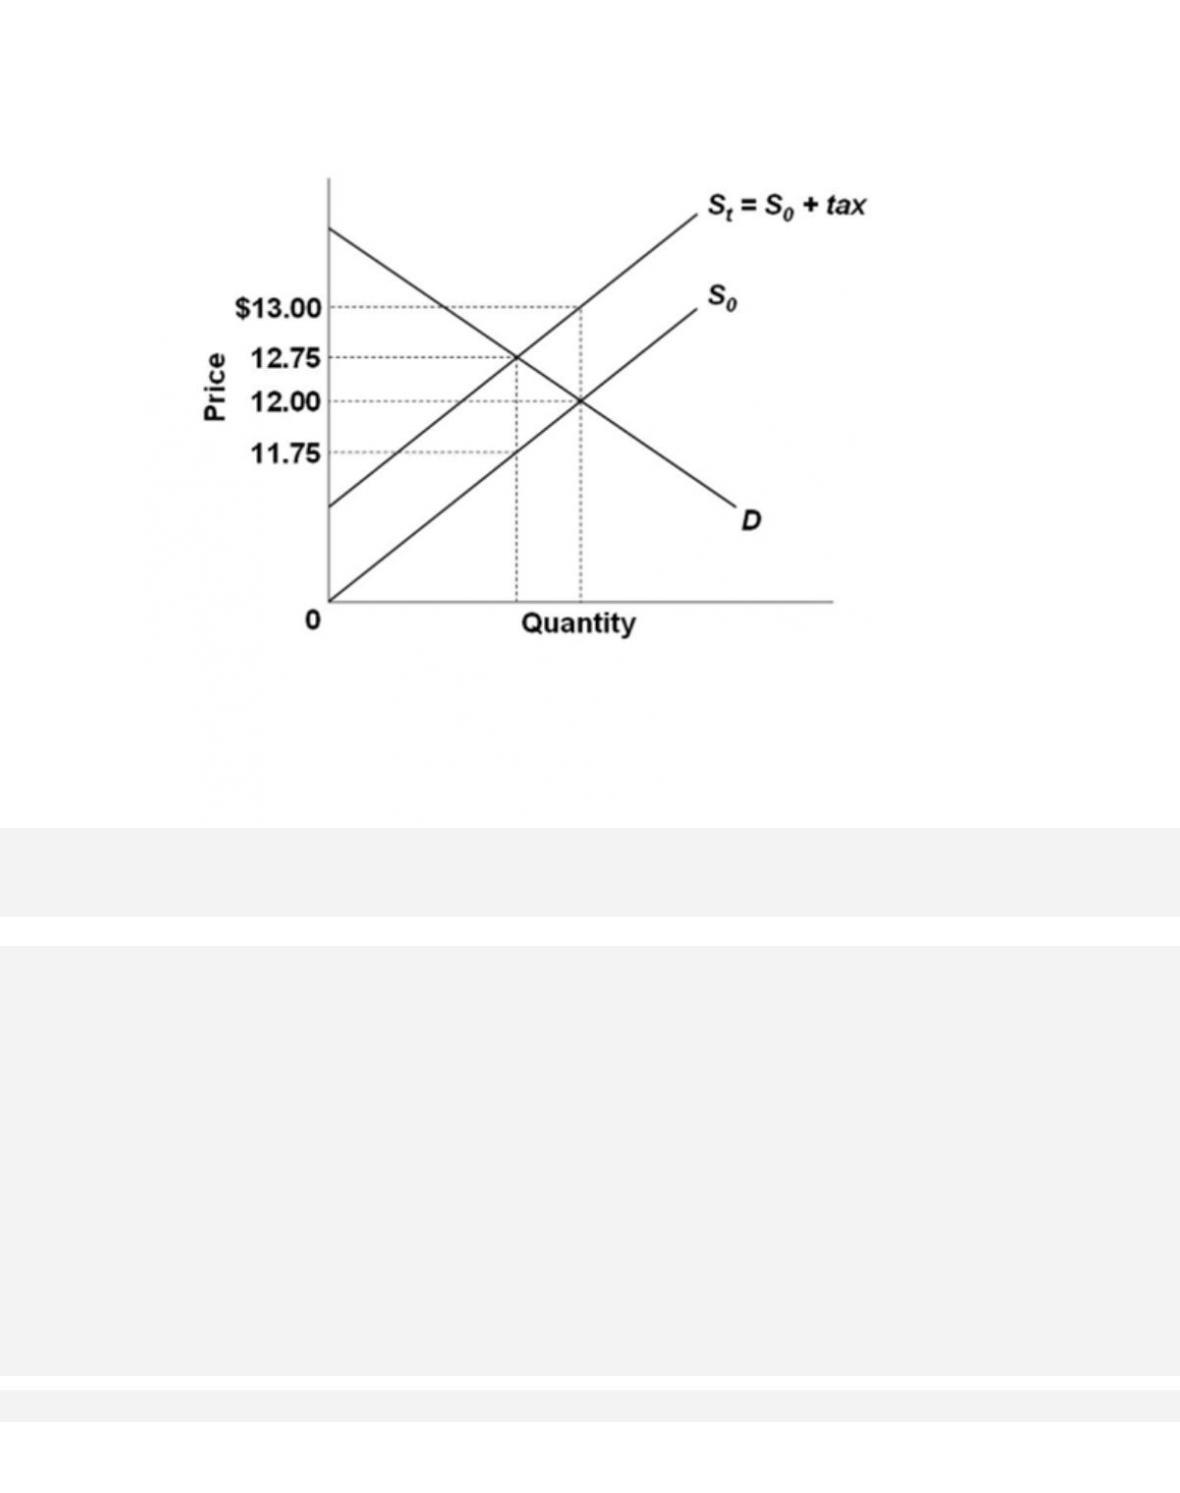
The graph shows the supply curve for a product before tax (S0) and after an excise tax is
imposed (S1). The excise tax on the product is ultimately paid
A. by buyers only.
258.
The graph shows the supply curve for a product before tax (S0) and after an excise tax is
imposed (S1). If 500 units of the product are sold after the tax is imposed, the amount of tax
revenue going to the government is
A. $125.
20-131
259.
The graph shows the supply curve for a product before tax (S0) and after an excise tax is
imposed (S1). If 500 units of the product are sold after the tax is imposed, the amount of the tax
borne by the consumer is
260.
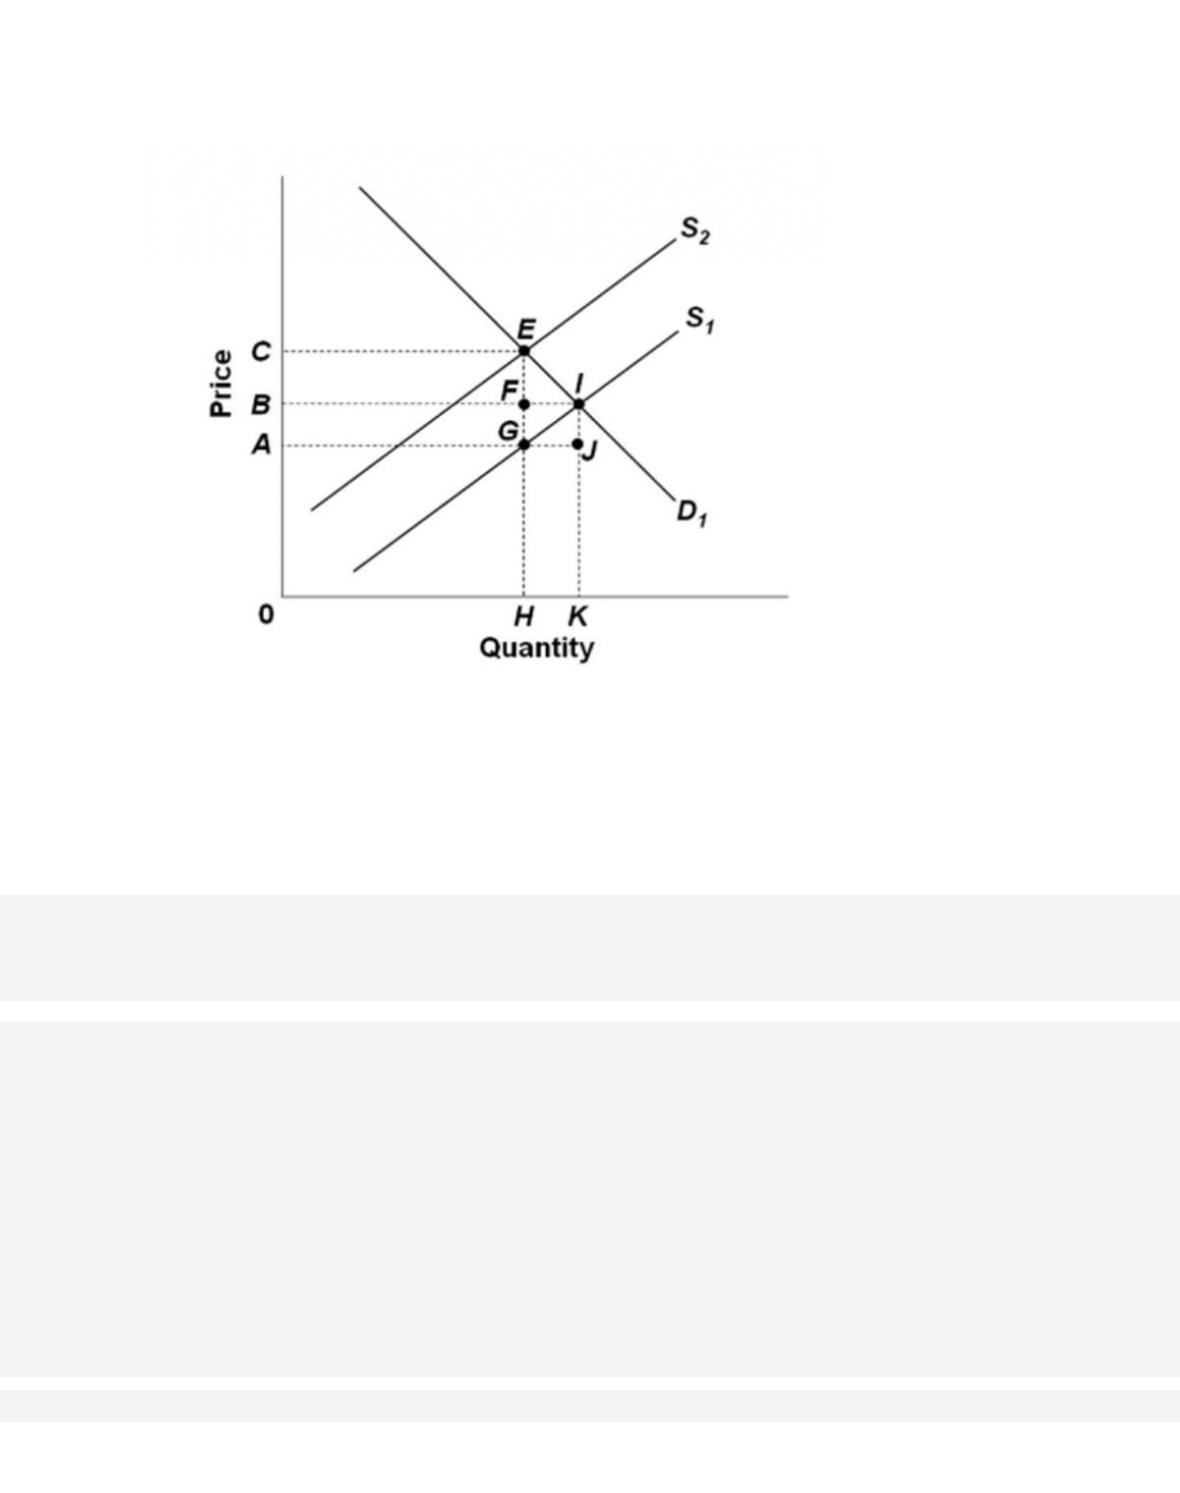
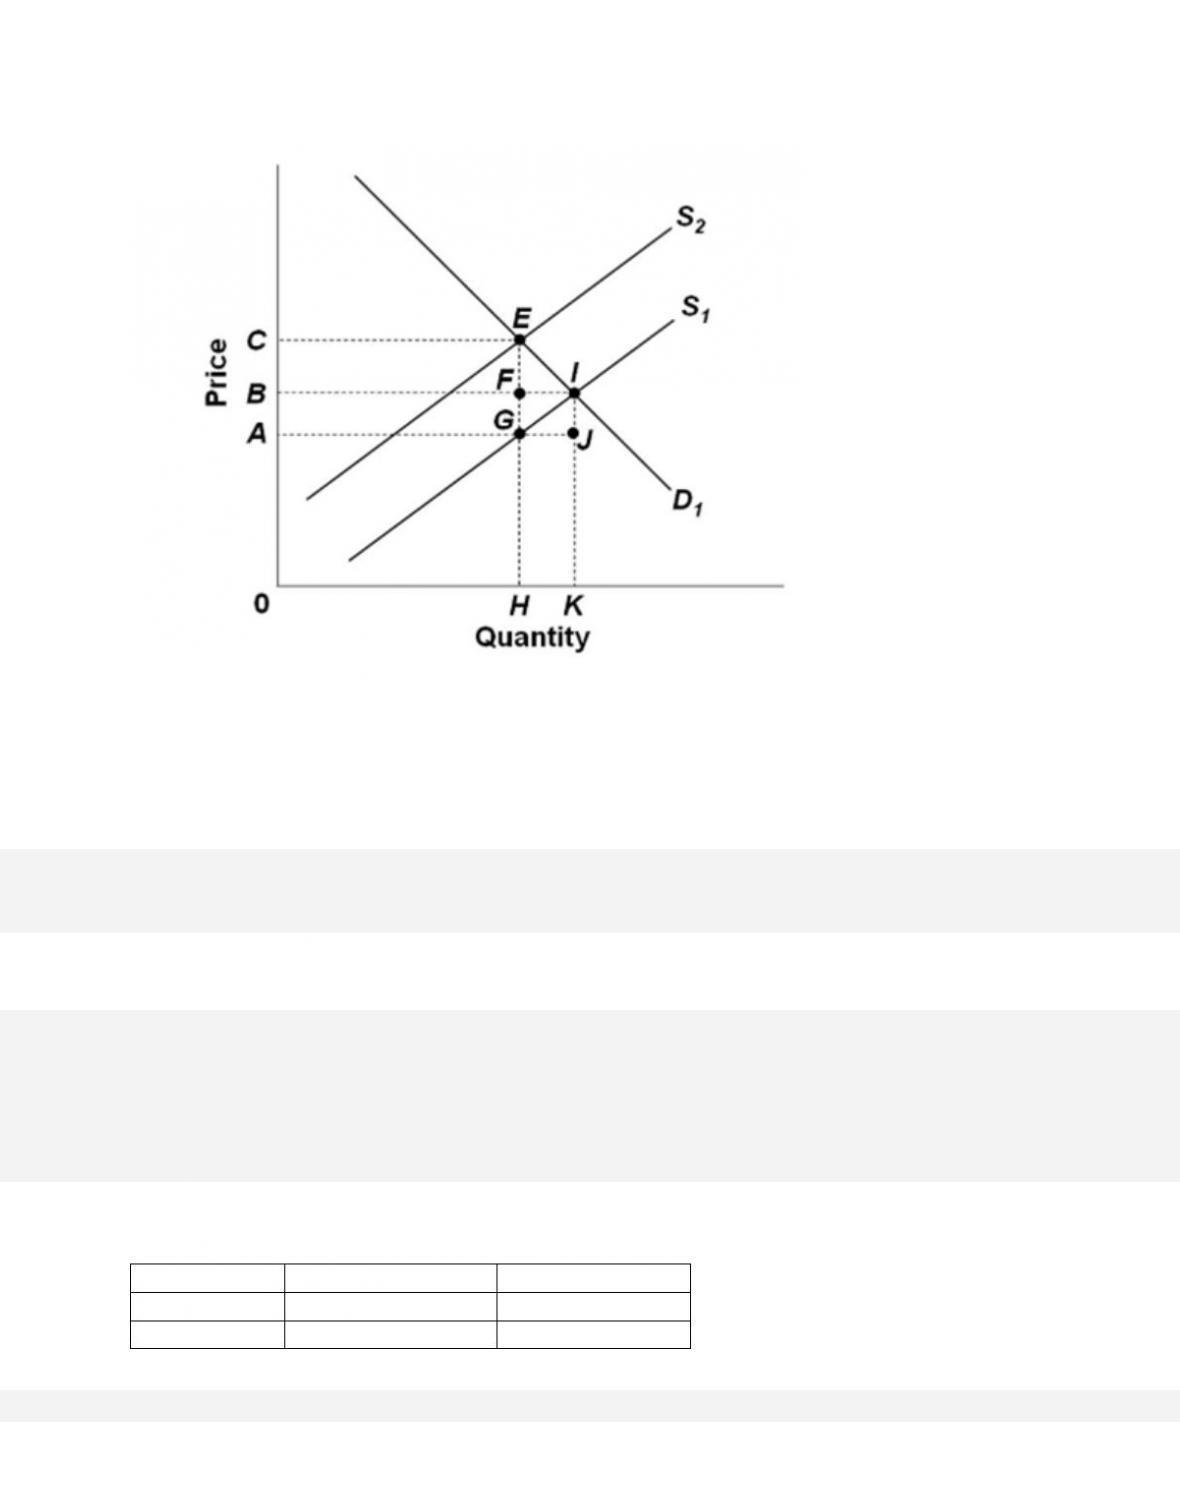
The graph represents the market for a product where D1 and S1 show the initial supply and
demand curves, and supply shifts to S2 due to a sales tax. The government‘s tax revenue is
represented by area
A. FIJG.
20-133
261.
The graph represents the market for a product where D1 and S1 show the initial supply and
demand curves, and supply shifts to S2 due to a sales tax. The deadweight loss due to the tax is
represented by area
C. BCEF.
D. ABFG.
262.
Price Per Unit
Quantity Demanded
Quantity Supplied
$1
50
10
2
40
20
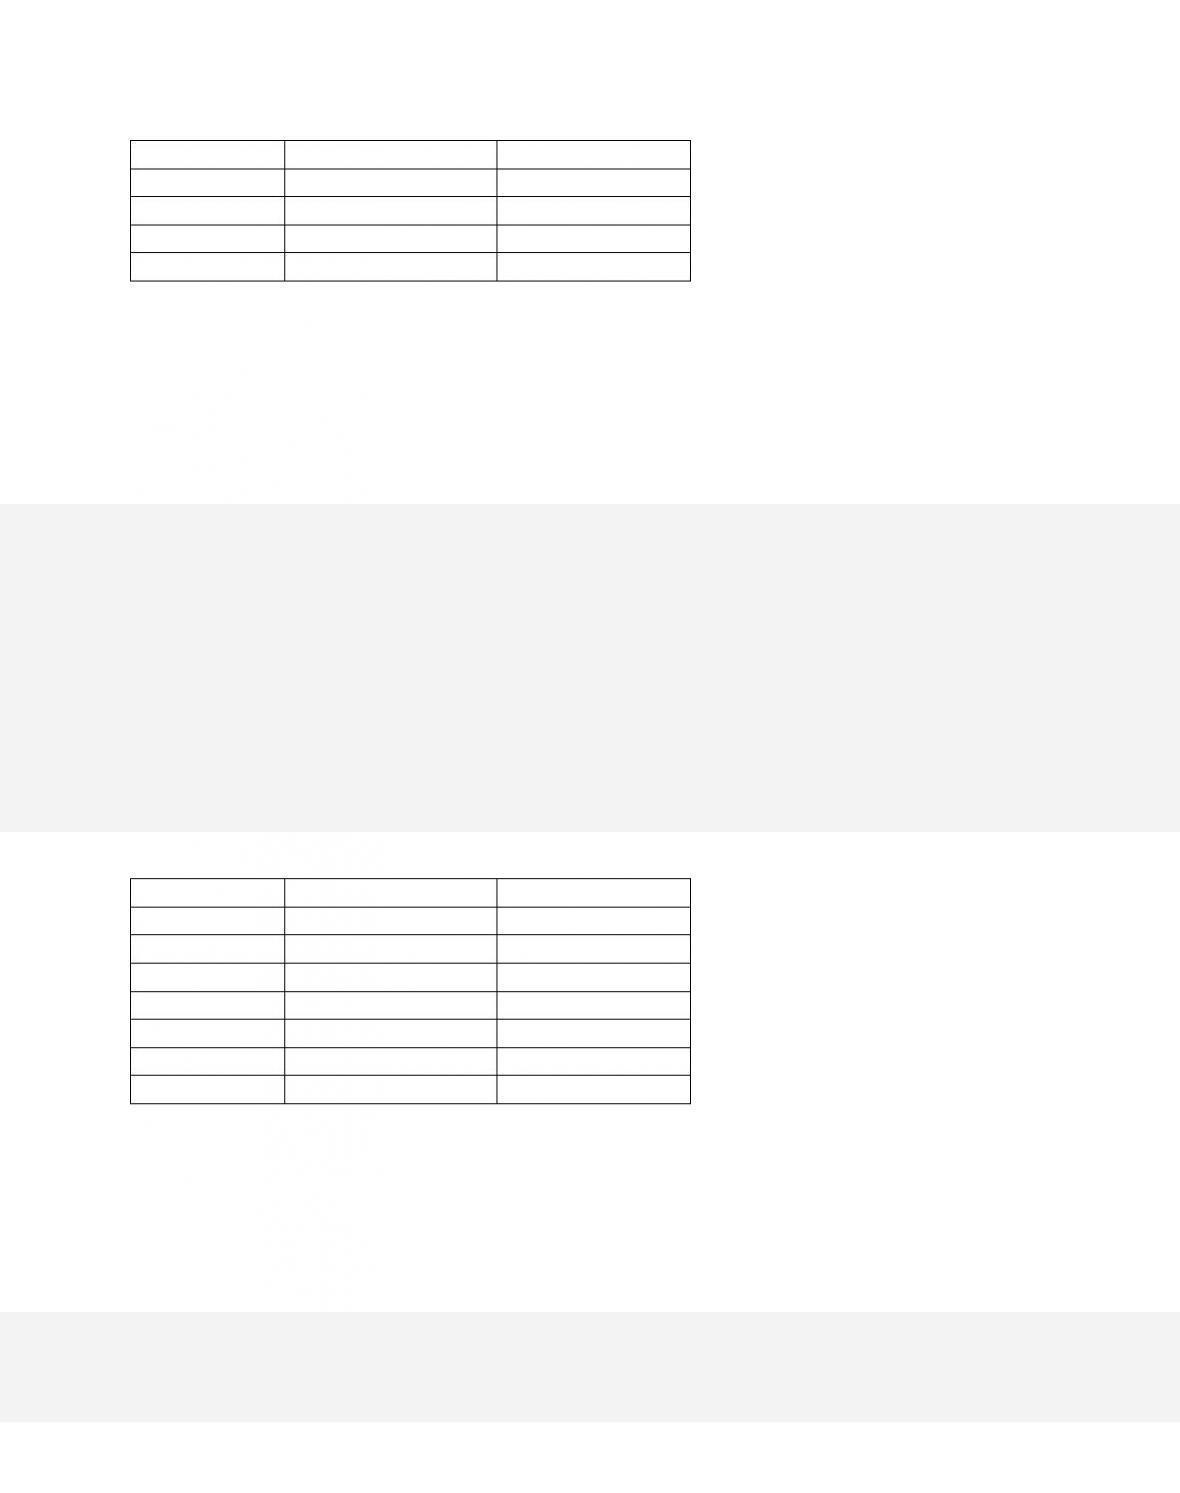
3
30
30
4
25
40
5
20
50
6
15
60
7
10
70
The table gives data for the market for a product. What is the equilibrium price and quantity in
this market?
A. $6 and 60, respectively
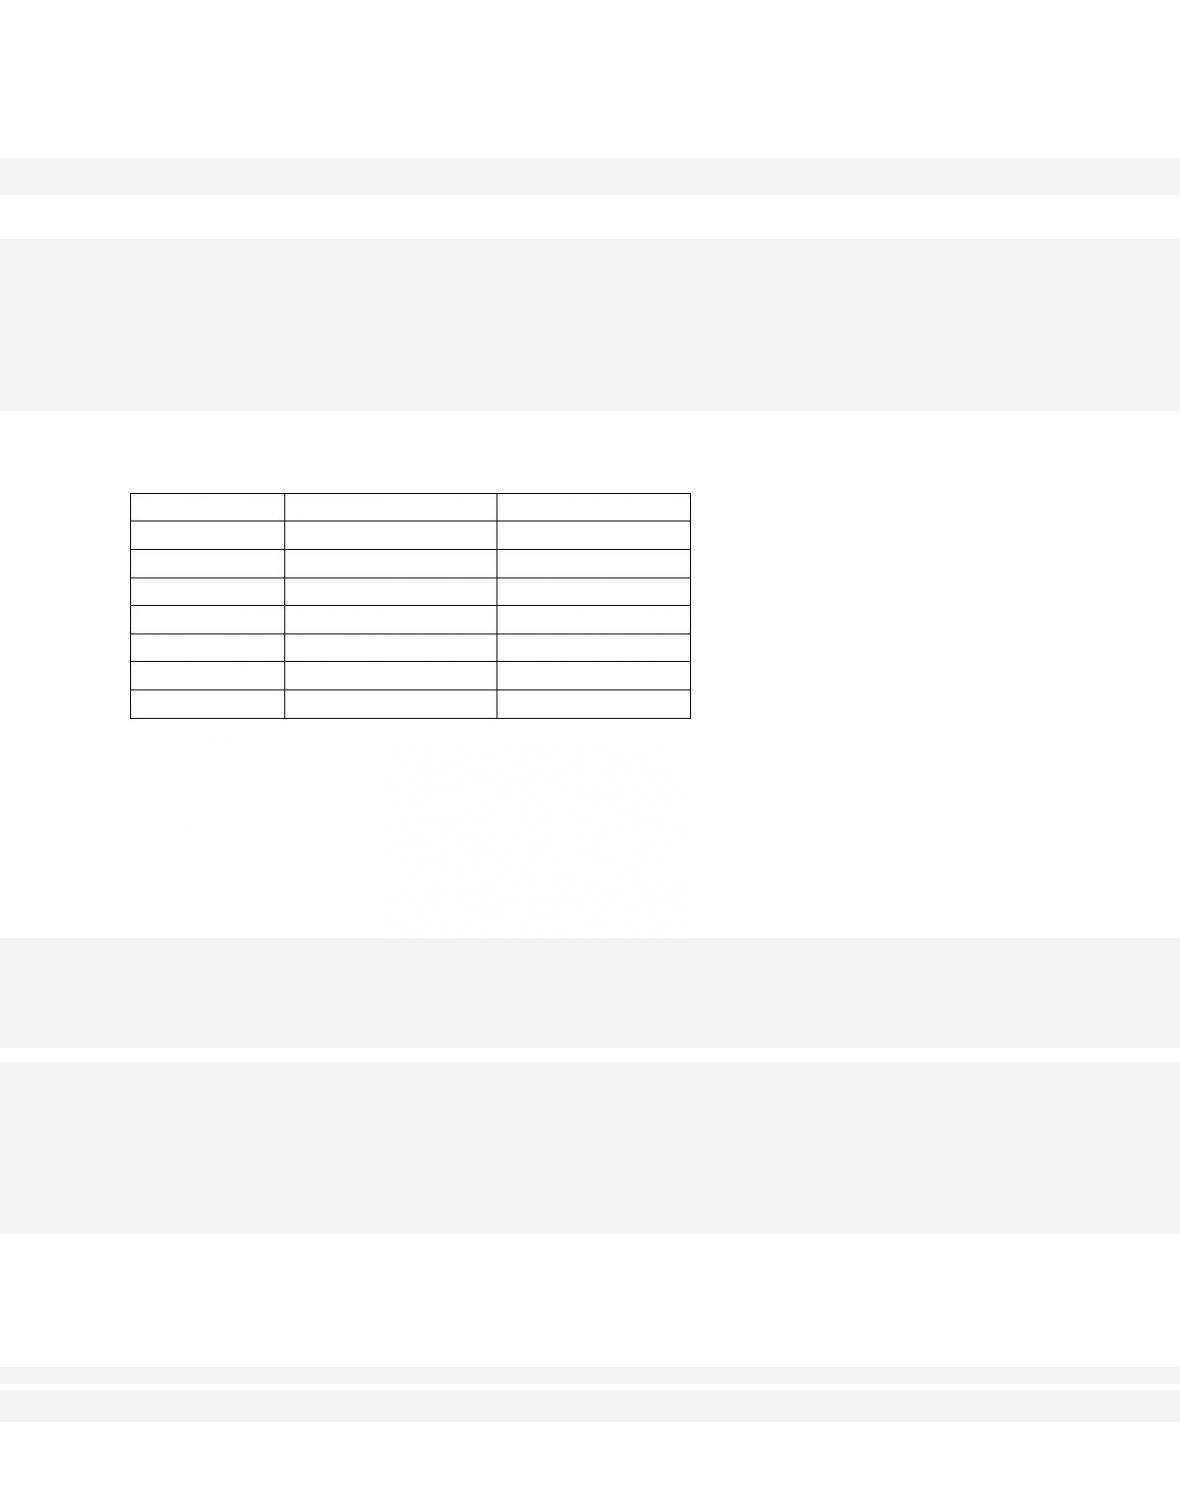
263.
Price Per Unit
Quantity Demanded
Quantity Supplied
$1
50
10
2
40
20
3
30
30
4
25
40
5
20
50
6
15
60
7
10
70
The table gives data for the market for a product. If an excise tax of $3 per unit is imposed on
this product, the new equilibrium price with tax will be
20-135
Copyright © 2018 McGraw-Hill Education. All rights reserved. No reproduction or distribution without the prior
written consent of McGraw-Hill Education.
C. $4.
D. $2.
264.
Price Per Unit
Quantity Demanded
Quantity Supplied
$1
50
10
2
40
20
3
30
30
4
25
40
5
20
50
6
15
60
7
10
70
The table gives data for the market for a product. If an excise tax of $3 per unit is imposed on
this product, the incidence of the tax will be
A. $3 on the buyers and $0 on the sellers.
265.