
19–81
Copyright © 2018 McGraw-Hill Education. All rights reserved. No reproduction or distribution without the prior
written consent of McGraw-Hill Education.
Accessibility:
Keyboard Navigation
Blooms: Understand
Di f f i cul t y :
02 Medium
Learning Objective: 19–01 Explain why falling birthrates mean that we are not likely to run
out of natural resources.
Test Bank: II
Topic:
Resource Supplies: Doom or Boom?
196.
The Malthusian prediction of Paul Ehrlich in The Population Bomb in 1968 proved to
be wrong because population growth
A. slowed dramatically as standards of living decreased.
197.
Commodity-pricing data from The Economist show a dramatic long-run decline in 25
important real commodity prices from 1850 to 2015. This decline
primarily occurred
because the
A. demand for commodities decreased drastically.
198.
The real cost of buying a market basket of 25 important commodities in 2015

compared to the cost in the 1845–1850 base period in The Economist’s
Commodity Price
Index is
A.
higher by about 100 percent.
199.
The long-run fall of commodity prices implies that commodity supplies have grown
A.
faster than the rate of productivity in the economy.
200.
The long-run total demand for commodity resources is driven by which of the
following forces?
D.
rising number of people alive and a decreasing amount of consumption per person

19–83
Copyright © 2018 McGraw-Hill Education. All rights reserved. No reproduction or distribution without the prior
written consent of McGraw-Hill Education.
Di f f i cul t y :
02 Medium
Learning Objective: 19–01 Explain why falling birthrates mean that we are not likely to run
out of natural resources.
Test Bank: II
Topic:
Resource Supplies: Doom or Boom?
201.
Future shortages in natural resource markets are not expected to occur widely due to
A. reduced hours at work.
202.
According to U.S. Geological Survey data from 1950 to 2010, total water use in the
United States has
A.
continually increased.
203.
Data from the U.S. Energy Information Administration on per capita energy
consumption in the United States for the 65-year period 1945–2014 show that it
has
A.
continually increased.

19–84
Copyright © 2018 McGraw-Hill Education. All rights reserved. No reproduction or distribution without the prior
written consent of McGraw-Hill Education.
C.
increased, leveled off, and started declining.
D. decreased, leveled off, and started rising.
204.
Data from the U.S. Environmental Protection Agency on per capita trash generation in
the United States indicate that since 1990 it has
A.
increased moderately.
205.
Governments in certain nations are considering adopting policies to raise their low
birthrates because of the concern with having
A.
high rates of inflation.

19–85
Copyright © 2018 McGraw-Hill Education. All rights reserved. No reproduction or distribution without the prior
written consent of McGraw-Hill Education.
Topic:
Resource Supplies: Doom or Boom?
206.
Russia, Australia, and France have adopted policies to encourage higher birthrates by
A.
decreasing benefits for single workers.
207.
The primary focus of energy economics is how
A.
energy consumption is increasing.
208.
In recent years, per capita energy use in developed countries such as the United States
has
A.
increased.

19–86
Copyright © 2018 McGraw-Hill Education. All rights reserved. No reproduction or distribution without the prior
written consent of McGraw-Hill Education.
Blooms: Understand
Di f f i cul t y :
02 Medium
Learning Objective: 19–02 Describe why using a mix of energy sources is efficient, even if
some of them are quite costly.
Test Bank: II
Topic:
Energy Economics
209.
If energy use per capita in developed countries had leveled off, while GDP per capita
had risen, then it must mean that
D.
the GDP–to–energy-use ratio had fallen.
210.
From 1950 to 2014, according to data from the U.S. Energy Information
Administration, the ratio of real GDP to energy consumption in the United States has
been
A.
relatively constant.
211.
An increasing ratio of real GDP to BTU of energy consumption suggests that
A.
increased energy consumption led to increased energy production.

19–87
Copyright © 2018 McGraw-Hill Education. All rights reserved. No reproduction or distribution without the prior
written consent of McGraw-Hill Education.
B.
increased energy production led to increased energy consumption.
C.
the discovery of energy sources greatly increased energy supply.
D.
advances in technology greatly increased energy efficiency.
212.
Better technology means that more output in the U.S. economy can be produced
A. with a greater amount of energy input.
213.
To control production costs in the face of huge intraday fluctuations in electricity
demand, electricity companies often
A.
operate all plants at full capacity.

19–88
Copyright © 2018 McGraw-Hill Education. All rights reserved. No reproduction or distribution without the prior
written consent of McGraw-Hill Education.
Topic:
Energy Economics
214.
Energy efficiency requires that we employ
A.
only the lowest-cost energy inputs.
215.
According to U.S. Energy Information Administration data, about what percentage of
U.S. electricity was generated by coal-fired plants in 2014?
A. 10 percent
216.
In 2014, according to U.S. Energy Information Administration data, which of the
following sources of energy contributed the smallest share to U.S.
electricity generation?
A.
petroleum

19–89
Copyright © 2018 McGraw-Hill Education. All rights reserved. No reproduction or distribution without the prior
written consent of McGraw-Hill Education.
Accessibility:
Keyboard Navigation
Blooms: Understand
Di f f i cul t y :
02 Medium
Learning Objective: 19–02 Describe why using a mix of energy sources is efficient, even if
some of them are quite costly.
Test Bank: II
Topic:
Energy Economics
217.
In 2014, according to U.S. Energy Information Administration data, which of the
following sources of energy contributed the largest share to U.S. electricity
generation?
A.
petroleum
218.
If the world begins to run out of oil, which of the following statements would be
incorrect?
A. The relative price of oil would become very high.
219.
About what minimum price per barrel of oil is necessary for biodiesel to become
economically viable as an alternative energy source?

A.
$30 per barrel
220.
Which one of the following is a correct description of the relationship between the
price of oil and the production of alternative energy sources?
A.
As the price of oil falls, the production of alternative energy sources rises.
221.
If predictions that the world will run out of oil or petroleum in the next century become
true, then
A. the world would run out of energy.

19–91
Copyright © 2018 McGraw-Hill Education. All rights reserved. No reproduction or distribution without the prior
written consent of McGraw-Hill Education.
Learning Objective: 19–03 Discuss why running out of oil would not mean running out of
energy.
Test Bank: II
Topic:
Running Out of Energy?
222.
Negative externalities from energy production should be considered when comparing
the cost of an energy source, because they
223.
Which of the following factors fosters the survival of alternative-energy companies?
A.
low price of conventional energy
224.
Because wind turbines supply no energy on windless days, and solar power is only
generated when the sun is up and out, one inherent problem with both
wind and solar
power is the
A.
government subsidy problem.

19–92
Copyright © 2018 McGraw-Hill Education. All rights reserved. No reproduction or distribution without the prior
written consent of McGraw-Hill Education.
C.
energy storage problem.
D. oil-complementarity problem.
225.
The primary focus of natural resource economics is to develop policies for harvesting
or extracting natural resources that
A. minimize the net costs from doing so.
226.
An example of a renewable resource would be
A.
oil.
227.
An example of a nonrenewable resource would be

A.
forests.
228.
The key to optimally managing renewable and nonrenewable resources is to design
incentive structures that
A.
reduce the costs of production to the lowest possible level.
229.
In time-value of money analysis, an increase in interest rates
A. raises the present value of a future amount.

19–94
230.
In time-value of money analysis, a decrease in interest rates
D.
has no effect on present or future amount.
231.
An oil producer discovers an oil supply in Texas that can be pumped for a profit of $50
per barrel now, $60 per barrel in three years, $80 per barrel in five
years, or $90 a barrel
in seven years. The current market rate of interest is 3 percent. When should the oil
producer extract the oil to obtain the most profit per barrel in present value terms?
A.
today
232.
A farmer discovers a natural gas reserve on his property. He can extract the natural gas
for a profit of $40 per unit now, $55 per unit in one year, $57 per
unit in two years, and $60
in three years. The current market rate of interest is 6 percent. When should the farmer
extract the natural gas to obtain the most profit per unit in present value terms?
A. today

19–95
Copyright © 2018 McGraw-Hill Education. All rights reserved. No reproduction or distribution without the prior
written consent of McGraw-Hill Education.
AACSB: Knowledge Application
Accessibility:
Keyboard Navigation
Blooms: Understand
Di f f i cul t y :
02 Medium
Learning Objective: 19–04 Show how the profit motive can encourage resource conservation.
Test Bank: II
Topic:
Natural Resource Economics
233.
A Middle Eastern country has an oil reserve that it can extract for a profit of $60 a
barrel today, $65 a barrel in two years, $70 a barrel in three years, and $75 in four years.
The current market rate of interest is 7 percent. When should this country tap into its oil
reserve to obtain the most profit per barrel in present value terms?
D.
four years
234.
An oil company has the opportunity to extract oil from a reserve in three years with a
per barrel profit of $70 per barrel. The current market rate of interest
is 4 percent. The
present value of this future extraction is about
235.
A mining company has the opportunity to extract from a coal reserve this year for a

profit of $40 per pound. The current market rate of interest is 5 percent.
The present value
of this future extraction is
A. $36.
236.
An electricity company has the opportunity to use natural gas to generate electricity at a
cost of $30 per unit in 2 years. The current market rate is 4 percent.
The present value of
this cost is about
D. $32.
237.
A logging company is considering logging an area for a current cost of $500 per acre to
obtain a profit the next year of $600 per acre. The market rate of
interest is 10 percent.
Should the company make the investment?
A.
Yes, the future value of the profit is greater than the present value of the cost.

19–97
Copyright © 2018 McGraw-Hill Education. All rights reserved. No reproduction or distribution without the prior
written consent of McGraw-Hill Education.
Blooms: Understand
Di f f i cul t y :
02 Medium
Learning Objective: 19–04 Show how the profit motive can encourage resource conservation.
Test Bank: II
Topic:
Natural Resource Economics
238.
An electricity company is considering damming a small river to generate electricity at
a cost of $160,000 and a profit of $200,000 in 5 years. The current
market rate is 5 percent.
Should the company make the investment?
A.
Yes, the future value of the profit is greater than the present value of the cost.
239.
An oil company is considering drilling in the Gulf at a current cost of $300,000 with an
expected profit of $500,000 in three years. The current market rate
is 10 percent. Should
the company make the investment?
A.
Yes, the future value of the profit is greater than the present value of the cost.
240.
An energy company has recently discovered a natural gas reserve. The company can
tap this reserve at a cost of $350,000 and obtain a profit of $450,000 in
three years. The
current market rate is 15 percent. Should the company make the investment?

A.
Yes, the future value of the profit is greater than the present value of the cost.
241.
The use of present value calculations in valuing natural resources is important because
it
A.
ensures that net benefits are minimized over time.
242.
The user cost of nonrenewable resources is
A.
the current cost of extracting and selling the resource.

243.
A mining company’s extraction costs curve is
D.
downward-sloping because the more the company extracts, the more its marginal
extraction costs decrease.
244.
At any level of a mining firm‘s output, total cost will be equal to extraction costs
D.
divided by user costs.
245.
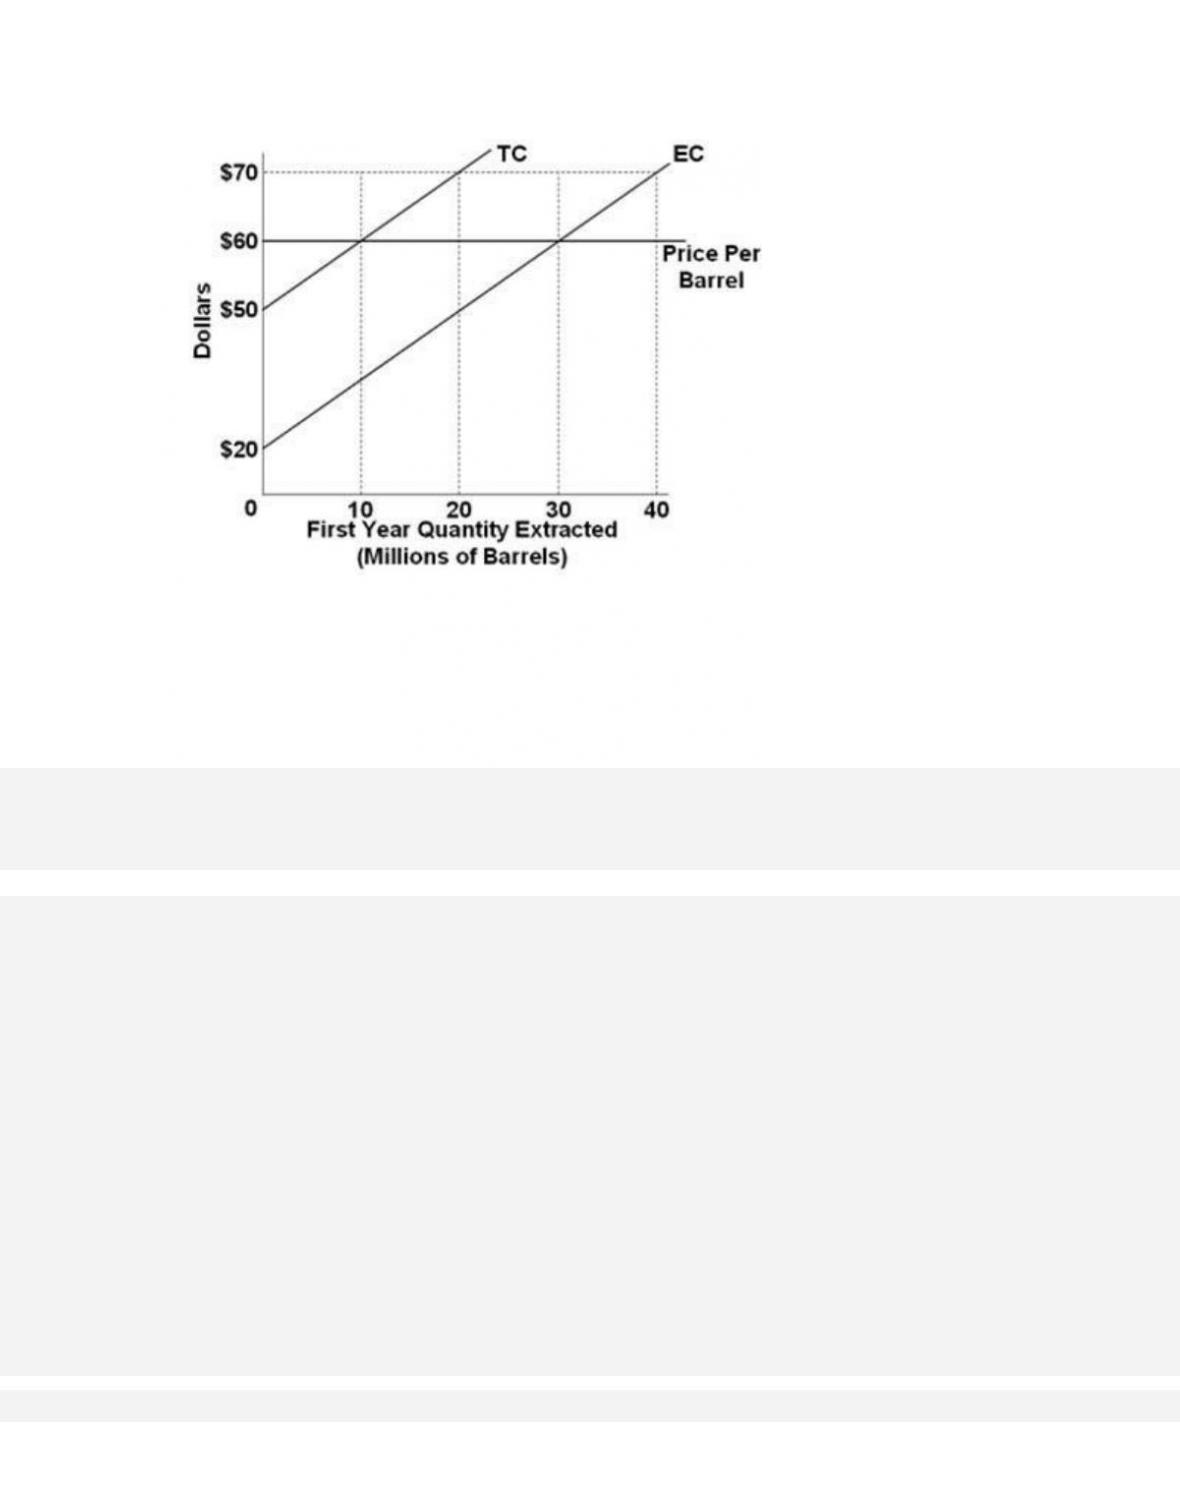
The graph shows the extraction costs for TX Oil Company in the first year in a situation
where it will extract oil from a reserve over two years. If the
current market price is $60
and user costs are not considered, the extraction quantity is
A.
10 units.