
53.
According to the concept of present value, a $50 barrel of oil today is worth
A. less than a $50 barrel in 2 years.
54.
Unless people can benefit from conservation, there is a temptation to
A.
delay resource extraction as long as possible.
55.
When the benefits of conservation and future use are excluded from a cost-benefit
analysis, there is a tendency to
A.
more efficiently allocate resources.

19–22
Copyright © 2018 McGraw-Hill Education. All rights reserved. No reproduction or distribution without the prior
written consent of McGraw-Hill Education.
Topic:
Natural Resource Economics
56.
The user cost of extracting a nonrenewable resource is
A. the sum of the dollar expenditures incurred to extract the resource.
57.
The user cost of extracting a nonrenewable resource is
D.
inversely related to the expected future price of the resource.
58.
The cost of not being able to extract and sell a nonrenewable resource in the future
(because it is being extracted in the present) is known by natural resource
economists as
the
A.
extraction cost.

19–23
Copyright © 2018 McGraw-Hill Education. All rights reserved. No reproduction or distribution without the prior
written consent of McGraw-Hill Education.
Blooms: Understand
Di f f i cult y:
02 Medium
Learning Objective: 19–04 Show how the profit motive can encourage resource conservation.
Test Bank: I
Topic:
Natural Resource Economics
59.
Quantity of Gold Bars (in
thousands)
Extraction Cost (in millions of
dollars)
User Cost (in millions of
dollars)
0
$10
$5
1
15
5
2
20
5
3
25
5
4
30
5
5
35
5
The table shows the quantity of gold bars (Qb) in thousands, the extraction cost for each
thousand bars (in millions of dollars), and the user cost of each
thousand bars (in millions
of dollars) facing the OZ Mining Company this year. If the current price of a bar of gold is
$25,000, how many bars (in thousands)
should OZ extract and sell this year in order to
maximize profits?
A. 1
60.
Quantity of Gold Bars (in
thousands)
Extraction Cost (in millions of
dollars)
User Cost (in millions of
dollars)
0
$10
$5

19–24
1
15
5
2
20
5
3
25
5
4
30
5
5
35
5
The table shows the quantity of gold bars (Qb) in thousands, the extraction cost for each
thousand bars (in millions of dollars), and the user cost of each
thousand bars (in millions
of dollars) facing the OZ Mining Company this year. If the price of a bar of gold is $30,000
this year, how many bars (in
thousands) should OZ extract and sell?
61.
Quantity of Gold Bars (in
thousands)
Extraction Cost (in millions of
dollars)
User Cost (in millions of
dollars)
0
$10
$5
1
15
5
2
20
5
3
25
5
4
30
5
5
35
5
The table shows the quantity of gold bars (Qb) in thousands, the extraction cost for each
thousand bars (in millions of dollars), and the user cost of each
thousand bars (in millions
of dollars) facing the OZ Mining Company this year. Suppose that a new government
regulation is going to shut down OZ‘s mining
operation one year from now. If the current

price per bar of gold is $25,000, how many bars (in thousands) should OZ extract and sell
this year?
D.
As many as possible.
62.
Quantity of Gold Bars (in
thousands)
Extraction Cost (in millions of
dollars)
User Cost (in millions of
dollars)
0
$10
$5
1
15
5
2
20
5
3
25
5
4
30
5
5
35
5
The table shows the quantity of gold bars (Qb) in thousands, the extraction cost for each
thousand bars (in millions of dollars), and the user cost of each
thousand bars (in millions
of dollars) facing the OZ Mining Company this year. Suppose that a new government
regulation is going to shut down OZ‘s mining
operation one year from now. Assuming that
all gold extracted is sold in the same year (cannot be stockpiled for later sale), how will the
regulation affect
the user cost?
A.
It will have no effect on the user cost.

19–26
Copyright © 2018 McGraw-Hill Education. All rights reserved. No reproduction or distribution without the prior
written consent of McGraw-Hill Education.
Blooms: Understand
Di f f i cult y:
02 Medium
Learning Objective: 19–04 Show how the profit motive can encourage resource conservation.
Test Bank: I
Topic:
Natural Resource Economics
Type: Table
63.
Higher interest rates will, all else equal,
A.
increase the extraction cost of a resource.
64.
A user cost of zero implies that
A. a firm will extract all of a resource in the present.
65.
A profit-maximizing company should extract a nonrenewable resource in the present up
to the quantity where the
D.
extraction cost of the resource equals the user cost of the resource.

19–27
Copyright © 2018 McGraw-Hill Education. All rights reserved. No reproduction or distribution without the prior
written consent of McGraw-Hill Education.
AACSB: Knowledge Application
Accessibility:
Keyboard Navigation
Blooms: Understand
Di f f i cult y:
02 Medium
Learning Objective: 19–04 Show how the profit motive can encourage resource conservation.
Test Bank: I
Topic:
Natural Resource Economics
66.
Extraction costs of a nonrenewable resource include the
A. cost of removal from the ground only.
67.
The optimal extraction level in the present for a nonrenewable resource is
A.
zero.
68.
A company’s extraction cost curve slopes upward to reflect
19–28
Copyright © 2018 McGraw-Hill Education. All rights reserved. No reproduction or distribution without the prior
written consent of McGraw-Hill Education.
B.
that user costs rise as the company extracts more of the resource.
C.
that the price of the nonrenewable resource increases as the amount extracted increases.
D.
all of these.
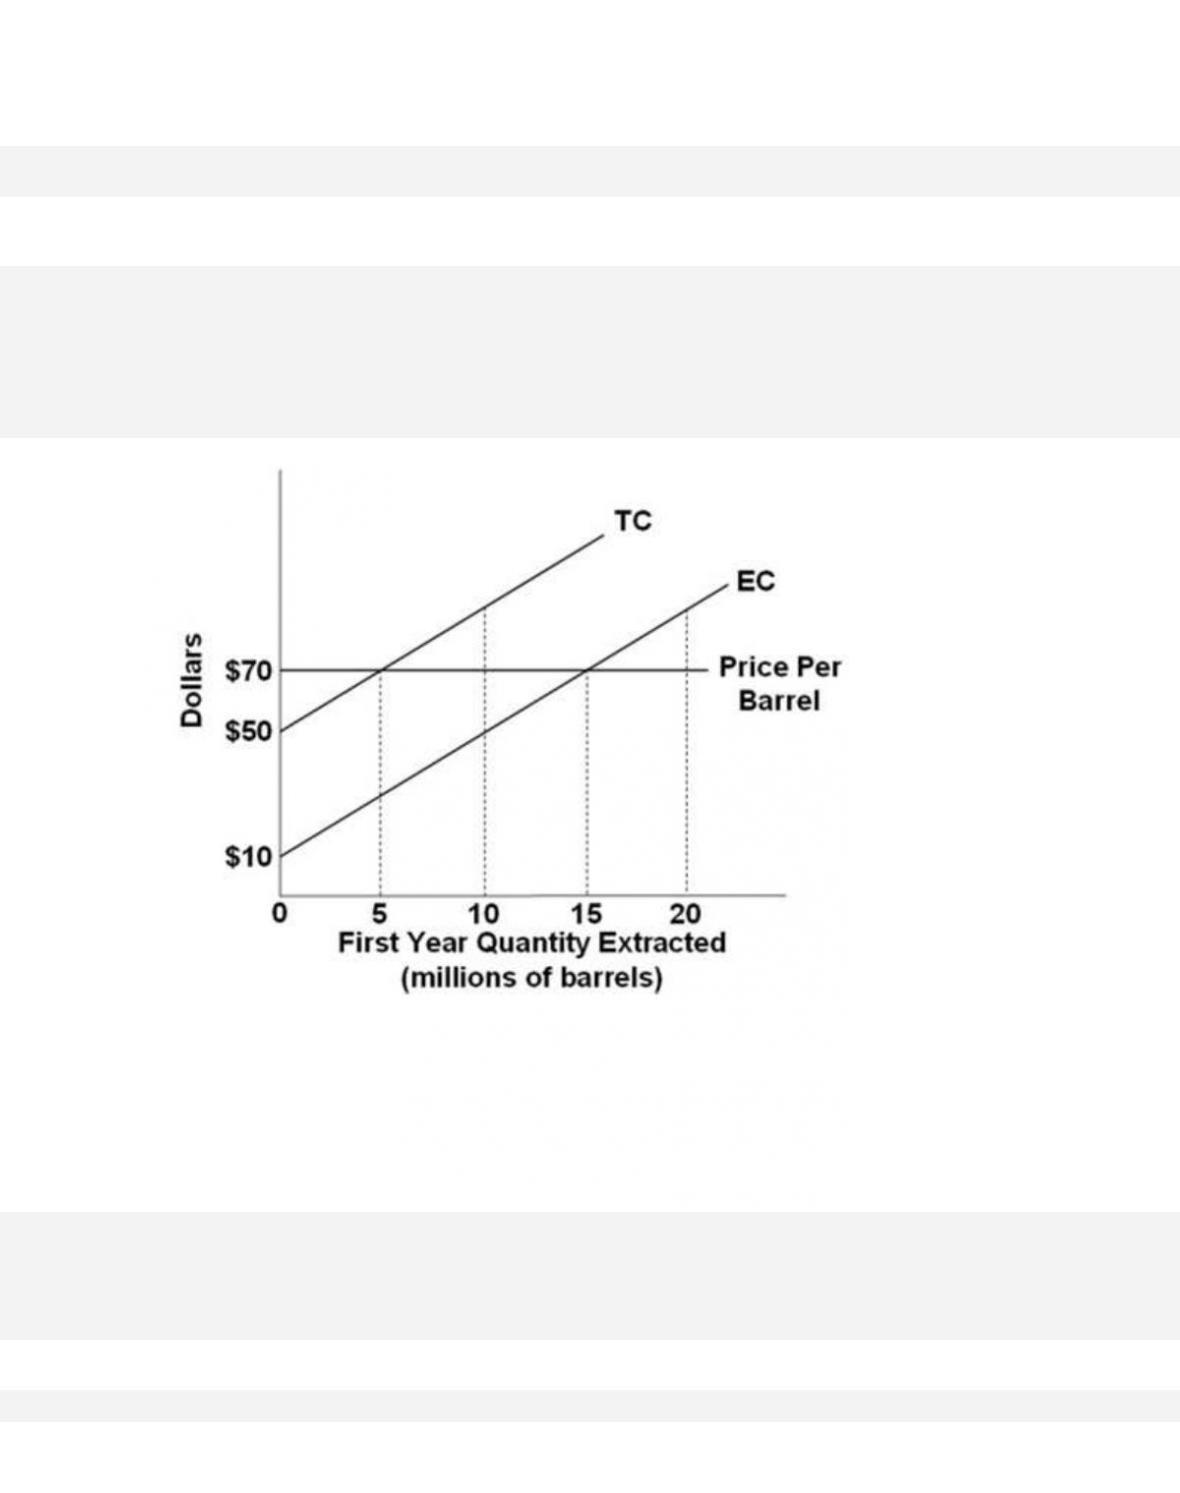
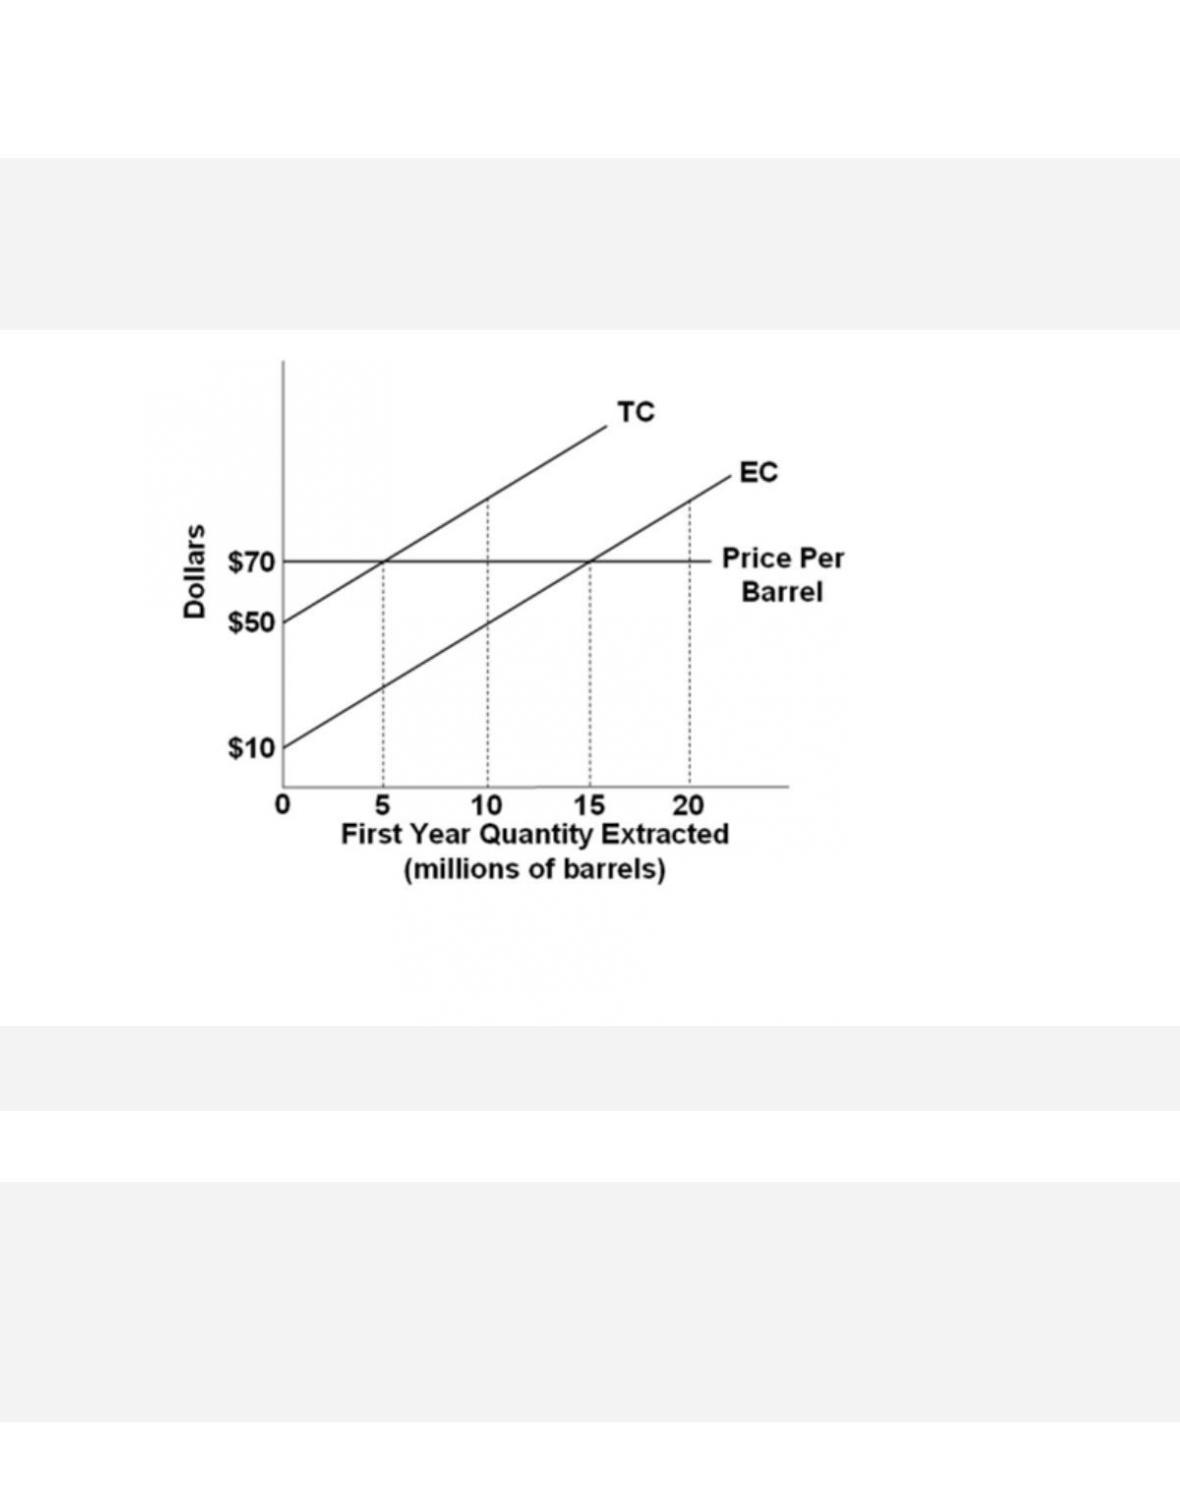
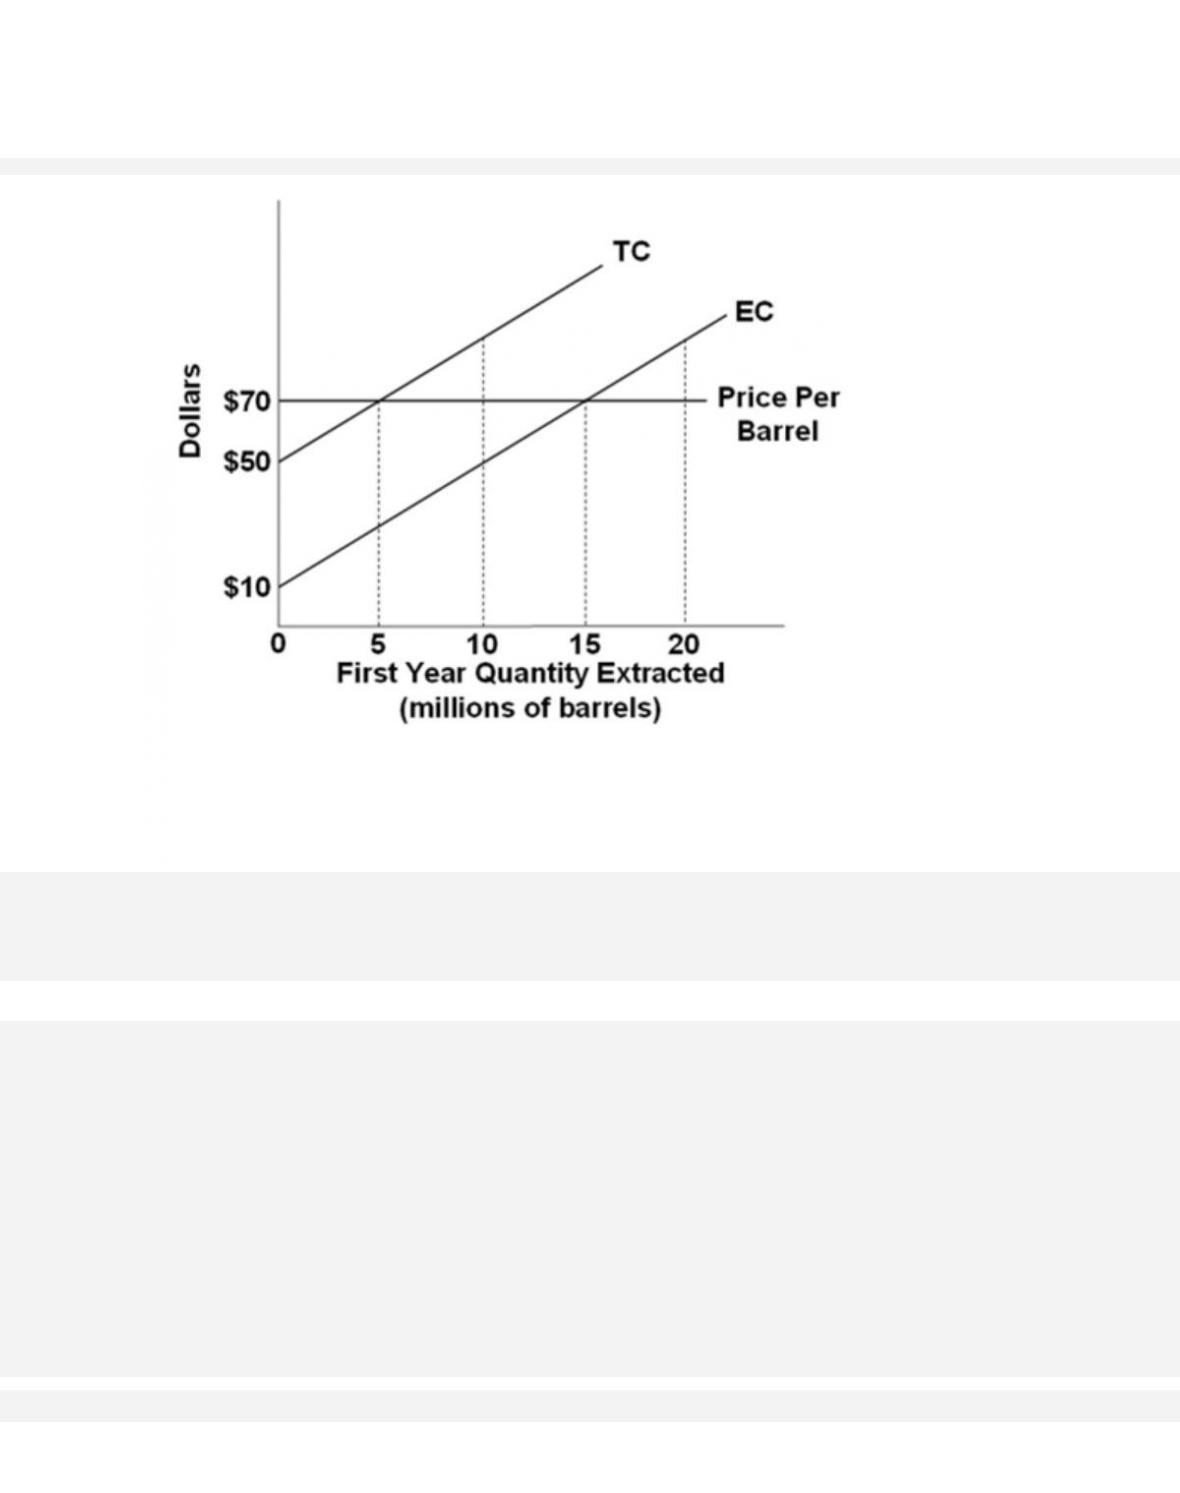
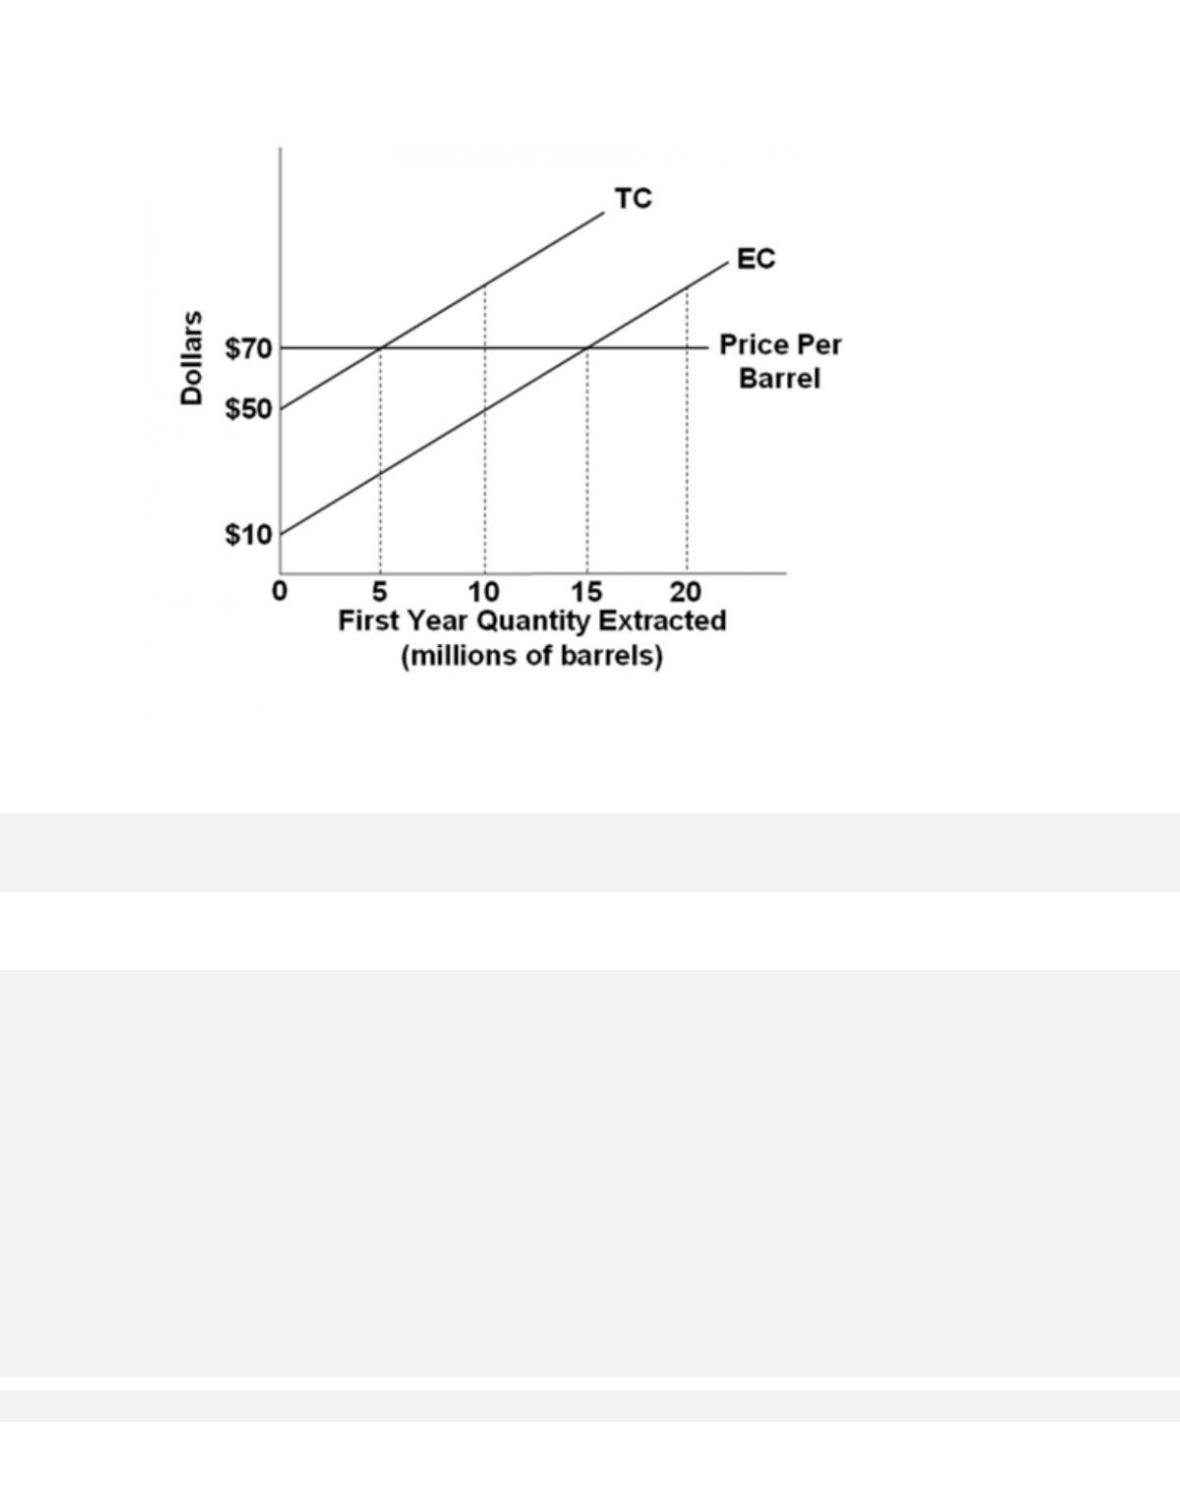
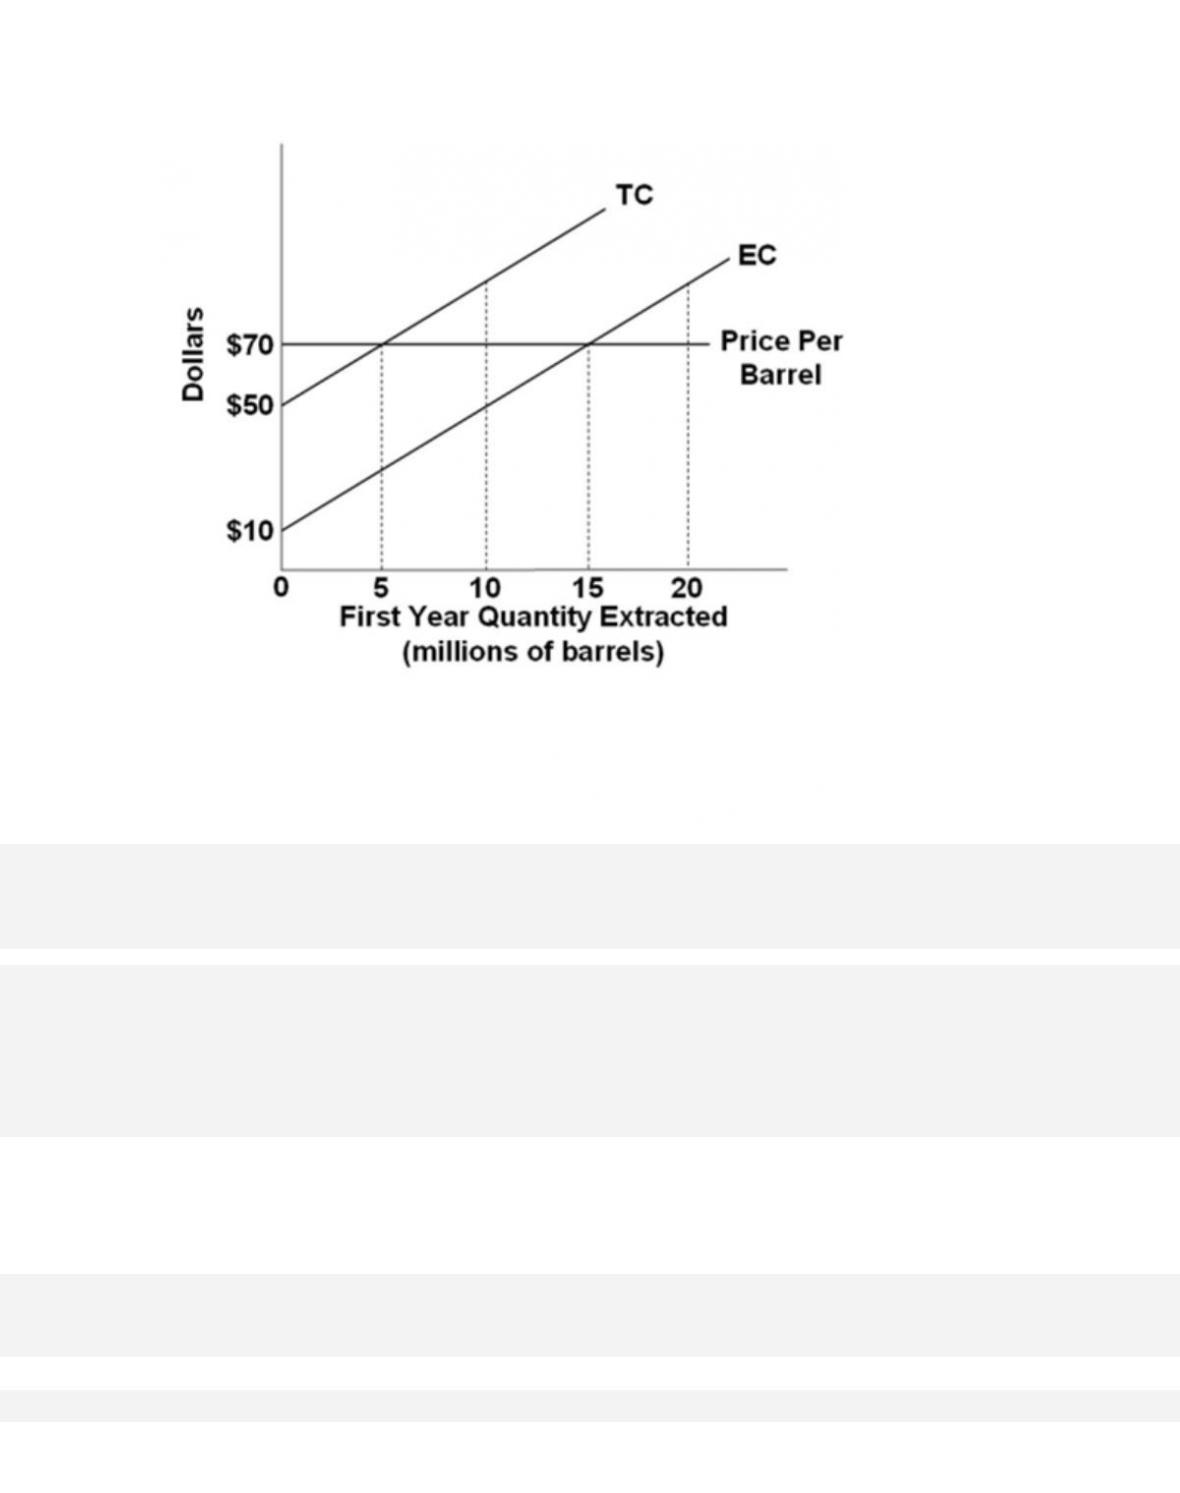
69.
Refer to the diagram, representing Slippery Slope Oil Company. What is the user cost of
extracting a barrel of oil this year?
A. $20
19–29
Copyright © 2018 McGraw-Hill Education. All rights reserved. No reproduction or distribution without the prior
written consent of McGraw-Hill Education.
AACSB: Knowledge Application
Blooms: Understand
Di f f i cult y:
02 Medium
Learning Objective: 19–04 Show how the profit motive can encourage resource conservation.
Test Bank: I
Topic:
Natural Resource Economics
Type: Graph
70.
Refer to the diagram, representing Slippery Slope Oil Company. How many million barrels
should Slippery Slope extract and sell this year?
D.
It cannot be determined with the information given.
19–30
Copyright © 2018 McGraw-Hill Education. All rights reserved. No reproduction or distribution without the prior
written consent of McGraw-Hill Education.
Type: Graph
71.
Refer to the diagram, representing Slippery Slope Oil Company. A $10 increase in the user
cost would shift
A.
up the extraction cost curve only and reduce the amount of oil extracted in the present.
72.
Refer to the diagram, representing Slippery Slope Oil Company. A $5 decrease in the user
cost would
C.
not affect the optimal quantity extracted in the present.
D.
reduce extraction costs in the present.
19–32
73.
Refer to the diagram, representing Slippery Slope Oil Company. What price of oil would
make 15 million barrels the optimal quantity to extract and sell this
year?
A. $50
74.
Which of the following would cause the present optimal extraction level of a
nonrenewable resource to fall?
A.
a reduction in extraction costs

19–33
Copyright © 2018 McGraw-Hill Education. All rights reserved. No reproduction or distribution without the prior
written consent of McGraw-Hill Education.
D.
a reduction in the price of the resource
75.
Which of the following would cause the present optimal extraction level of a
nonrenewable resource to rise?
A.
a decrease in the price of the resource
76.
Which of the following would cause the present optimal extraction level of a
nonrenewable resource to fall?
D.
an increase in the current price of the resource
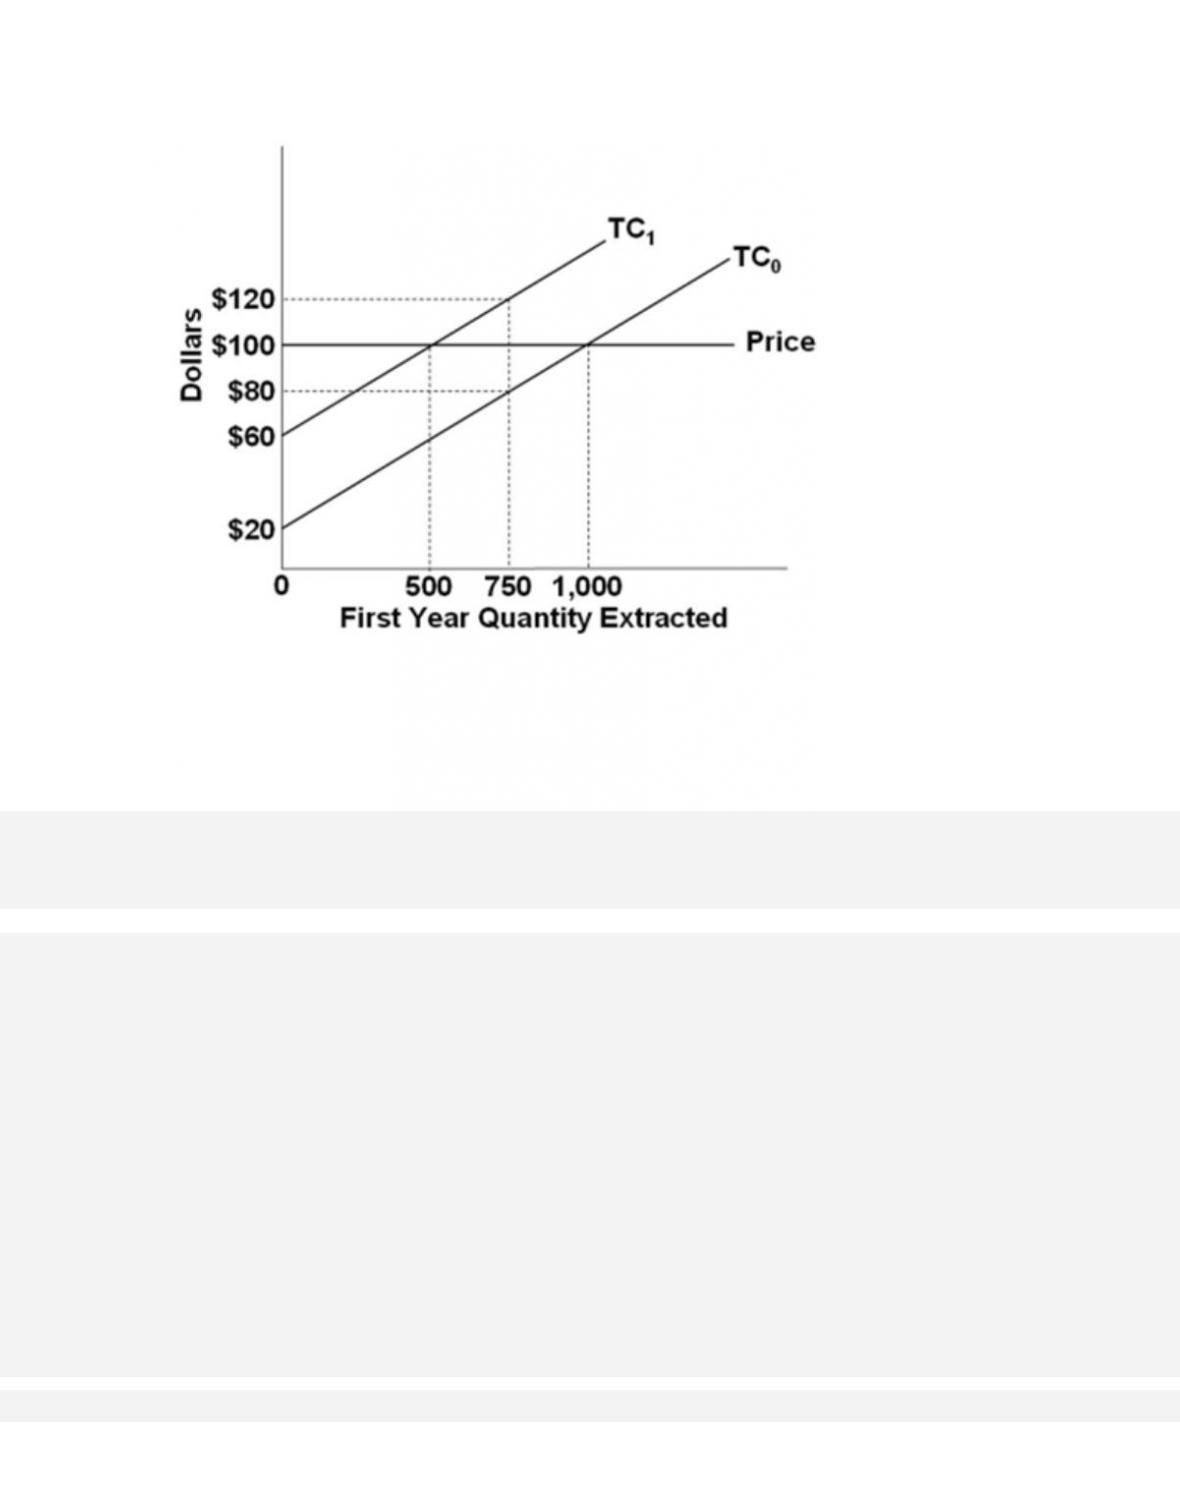
77.
Refer to the diagram, assuming that the firm represented is operating on curve TC0. What is
the user cost of extracting a unit of this resource?
A. $20

78.
Refer to the diagram, assuming that the firm represented is operating on curve TC0. How
much will the firm extract this year?
A. 500
79.
Refer to the diagram, assuming that the firm represented is operating on curve TC0. If the
user cost increases by $20 at the beginning of the year, the quantity
extracted in the first
year will
A. remain unchanged.
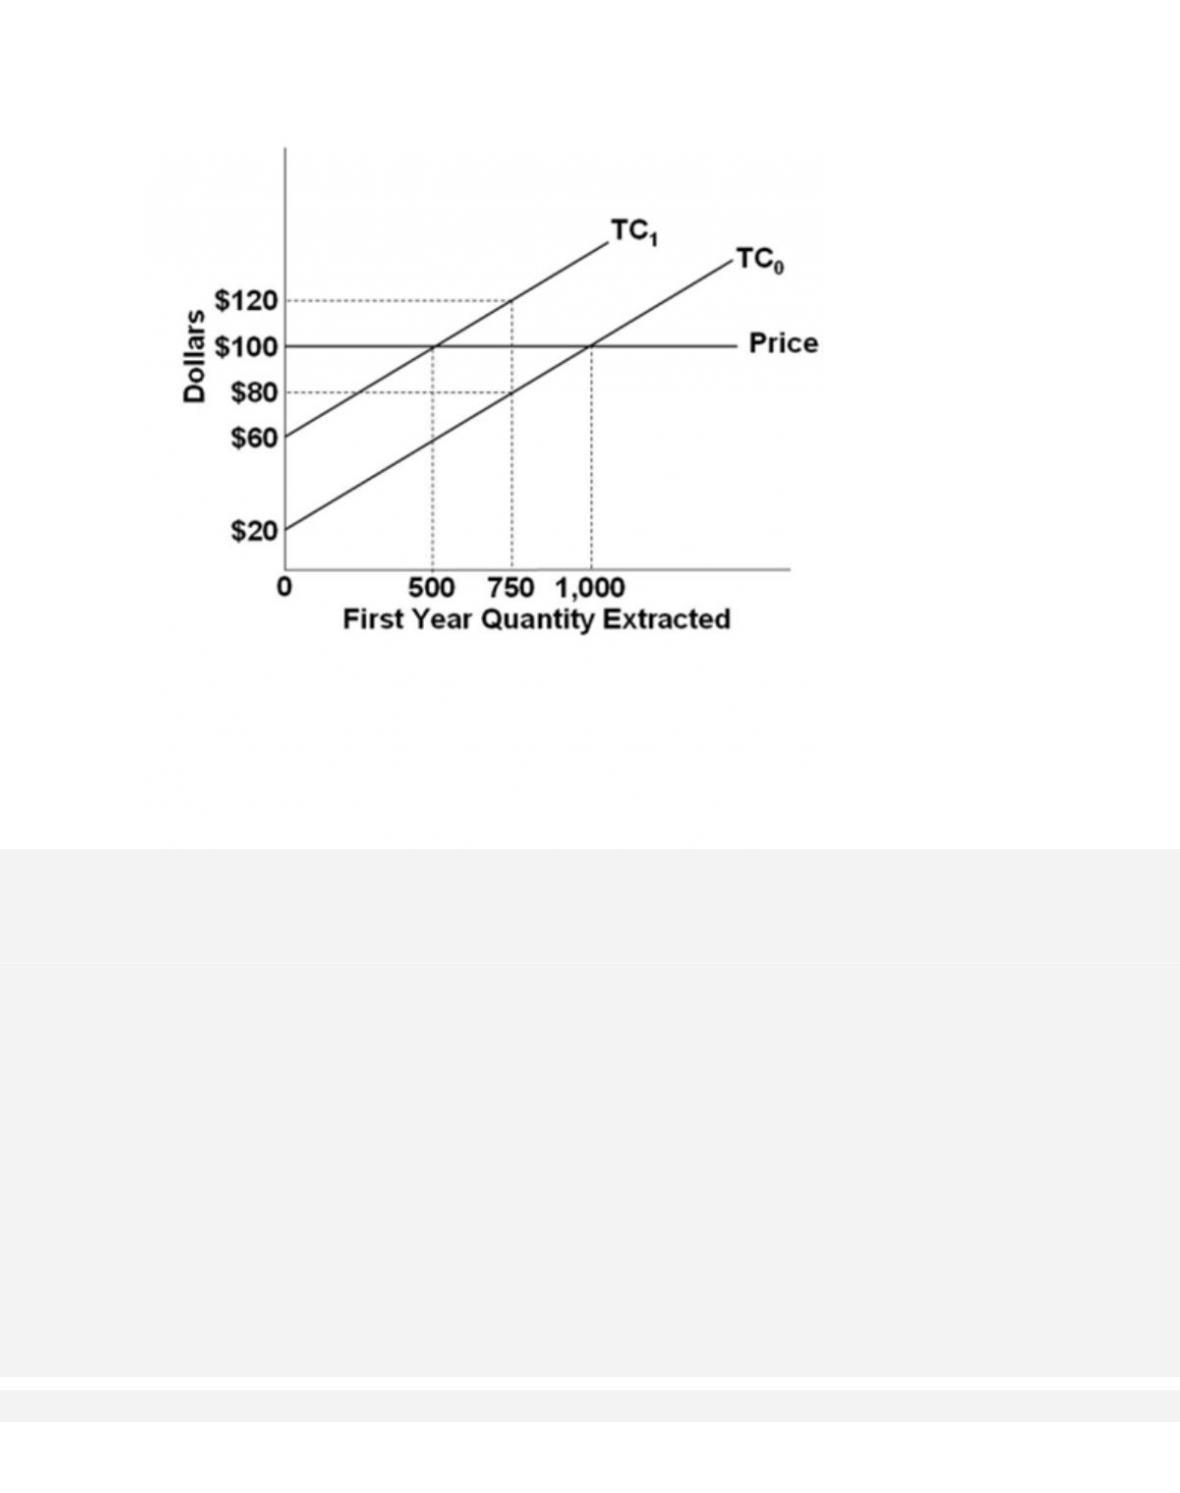
80.
Refer to the diagram, assuming that the firm represented is operating on curve TC1. If the
current price of the resource rises by $20, the optimal quantity
extracted in the first year
will
D.
remain unchanged.

81.
Refer to the diagram, assuming that the firm represented is operating on curve TC0. A
change from TC0 to TC1 could be caused by
A. a decrease in extraction costs.
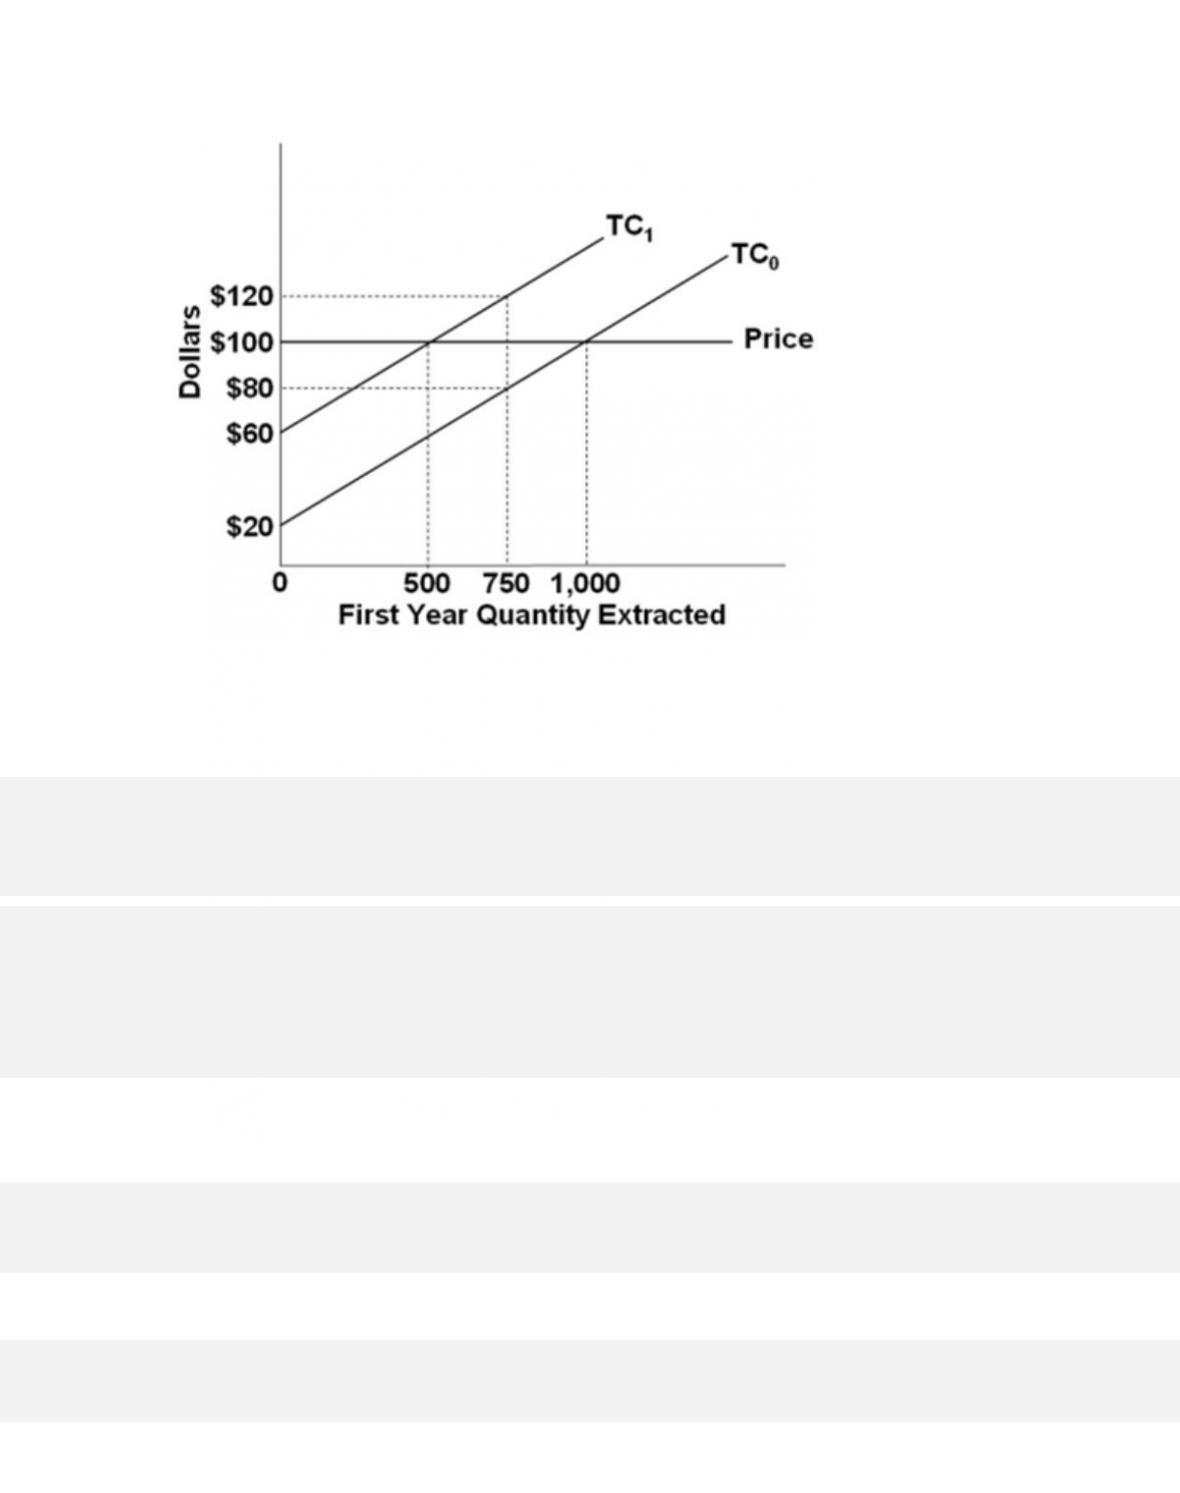
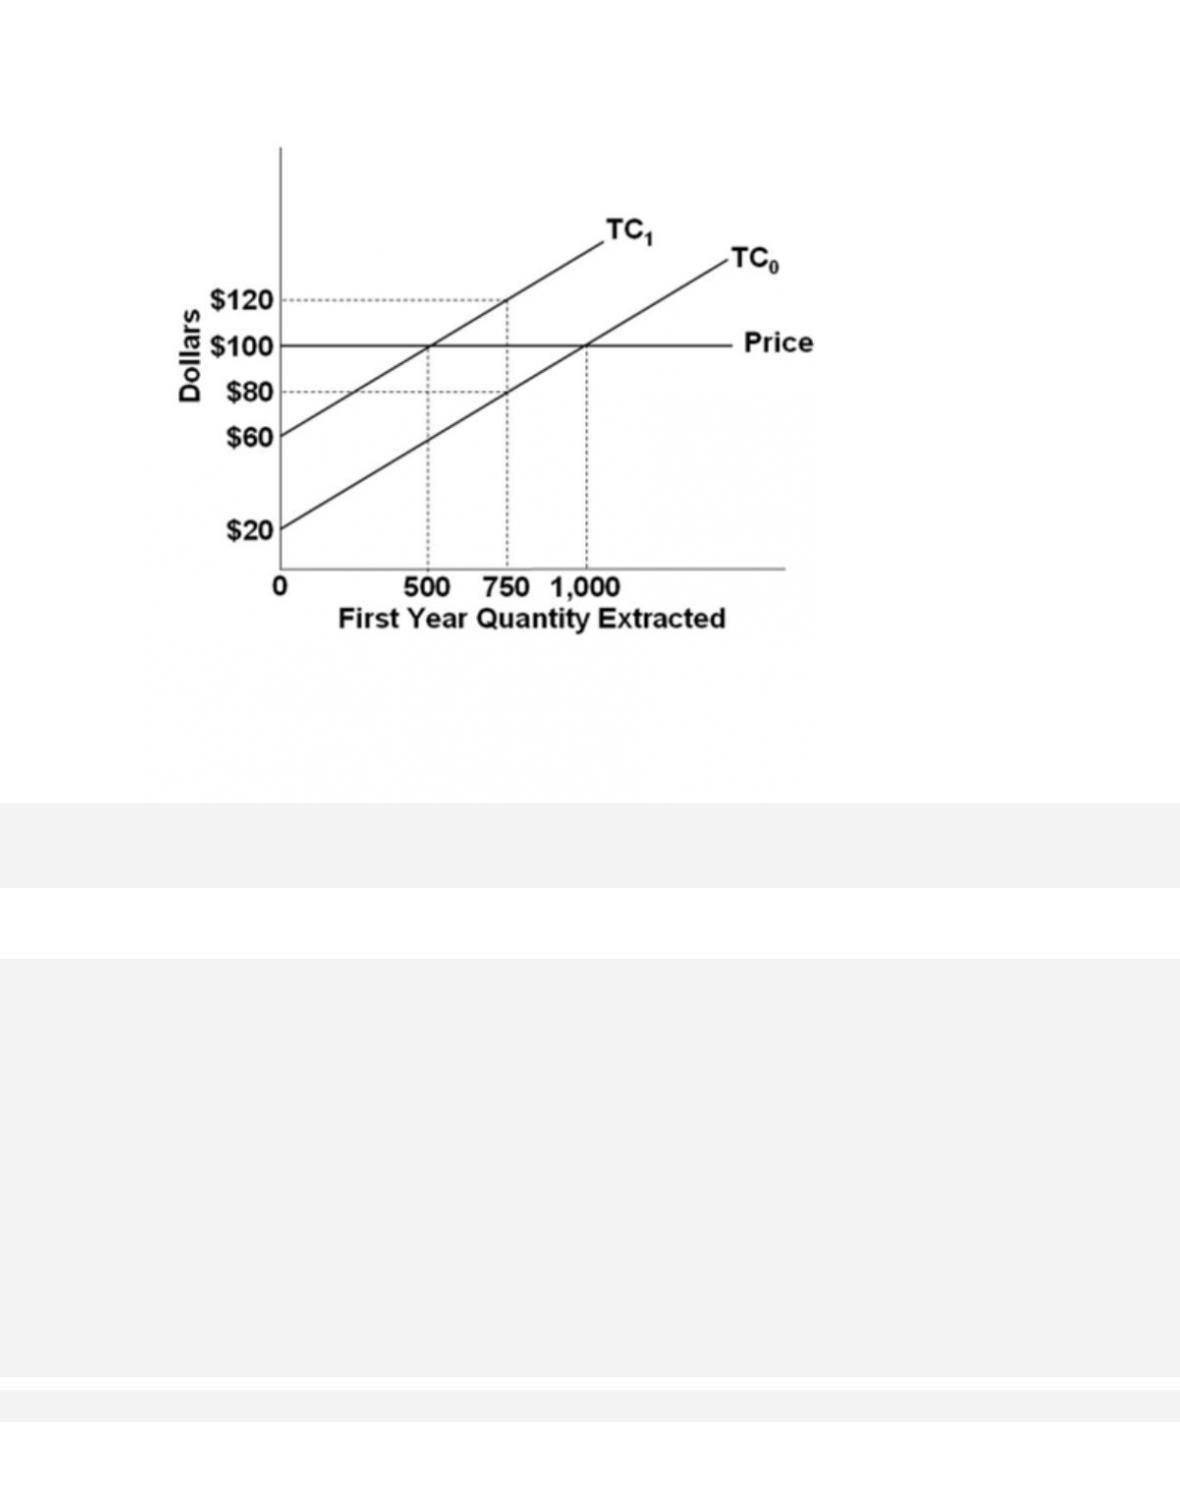
82.
Refer to the diagram. An increase in extraction costs could be shown by
A.
an increase in the first-year quantity extracted.
83.
An increase in the present value of the profit that can be obtained by delaying resource
extraction will lead profit-maximizing firms to
D.
hire more workers to support current production.

19–40
Copyright © 2018 McGraw-Hill Education. All rights reserved. No reproduction or distribution without the prior
written consent of McGraw-Hill Education.
Accessibility:
Keyboard Navigation
Blooms: Understand
Di f f i cult y:
02 Medium
Learning Objective: 19–04 Show how the profit motive can encourage resource conservation.
Test Bank: I
Topic:
Natural Resource Economics
84.
Profit-maximizing extraction companies will attempt to
A.
extract resources as quickly as possible.
85.
Which of the following is the best example of a market failure that would lead a firm to
extract resources at a rate that is faster than the rate that would
maximize its long-term
stream of profits?
A. The market price of the resource rises.
86.
If property rights are weak or uncertain, resource extraction will tend to