Chapter 17 Wage Determination Answer Key
Multiple Choice Questions
1. Real wages in the United States in the long run
A. show no discernible relationship to output per worker.
2. The long-run trend of real wages
A. cannot be determined from available data on nominal wages and the price level.
3. If the nominal wages of carpenters rose by 5 percent in 2013 and the price level increased by
3 percent, then the real wages of carpenters
A. decreased by 2 percent.
17-2
Copyright © 2018 McGraw-Hill Education. All rights reserved. No reproduction or distribution without the prior
written consent of McGraw-Hill Education.
A c c e s s i b i l i t y :
Keyboard Navigation
Blooms: Understand
Dif fi c ul t y:
02 Medium
Learning Objective: 17–01 Explain why labor productivity and real hourly compensation track
so closely over time.
Test Bank: I
Topic:
Labor, Wages, and Earnings
4. Over the long run, real earnings per worker can increase only at about the same rate as the
economy‘s rate of growth of
A. total output.
5. Increases in the productivity of labor result partly from
A. the law of diminishing returns.
6. Real wages in the United States are
A. the highest in the world.
17-3
Copyright © 2018 McGraw-Hill Education. All rights reserved. No reproduction or distribution without the prior
written consent of McGraw-Hill Education.
B. relatively high, but not as high as in some other industrially advanced nations.
C. much higher than output per worker.
D. higher than nominal wages.
AACSB: Knowledge Application
A c c e s s i b i l i t y :
Keyboard Navigation
Blooms: Understand
Dif fi c ul t y:
02 Medium
Learning Objective: 17–01 Explain why labor productivity and real hourly compensation track
so closely over time.
Test Bank: I
Topic:
Labor, Wages, and Earnings
7. According to international comparisons, which nation had the highest hourly pay in U.S.
dollar terms in 2013?
A. United States
8. According to international comparisons, which of these nations was not in the top 5 for
hourly pay in U.S. dollar terms in 2013?
A. Sweden
17-4
Copyright © 2018 McGraw-Hill Education. All rights reserved. No reproduction or distribution without the prior
written consent of McGraw-Hill Education.
Test Bank: I
Topic:
Labor, Wages, and Earnings
9. The real wage will rise if the nominal wage
A. falls more rapidly than the general price level.
10. Which of the following is correct?
A. The nominal wage may fall, but the real wage can never decline.
11. The productivity and real wages of workers in industrially advanced economies have risen
historically partly because
A. workers have acquired less education and training over time.
17-5
Copyright © 2018 McGraw-Hill Education. All rights reserved. No reproduction or distribution without the prior
written consent of McGraw-Hill Education.
A c c e s s i b i l i t y :
Keyboard Navigation
Blooms: Understand
Dif fi c ul t y:
02 Medium
Learning Objective: 17–01 Explain why labor productivity and real hourly compensation track
so closely over time.
Test Bank: I
Topic:
Labor, Wages, and Earnings
12. If the nominal wage rises by 4 percent and the price level rises by 7 percent, the real wage
will
A. be unaffected.
13. If the nominal wage rises by 6 percent and the price level falls by 2 percent, the real wage
will
A. be unaffected.
14. Long-run real wages in the United States have
17-6
Copyright © 2018 McGraw-Hill Education. All rights reserved. No reproduction or distribution without the prior
written consent of McGraw-Hill Education.
A. risen because growth in the demand for labor has exceeded growth in the supply of labor.
B. risen because the supply of labor has fallen over time.
C. fallen because growth in the supply of labor has exceeded growth in the demand for labor.
D. fallen because the demand for labor has fallen over time.
15. Since 1960, real hourly compensation in the United States has approximately
A. remained the same.
16. Marginal revenue product (MRP) of labor refers to the
A. increase in total revenue resulting from selling an additional unit of output.
Test Bank: I
Topic:
A Purely Competitive Labor Market
17. Marginal resource cost refers to the
A. increase in total revenue resulting from the sale of the extra output of one more worker.
18. If a firm is hiring a certain type of labor under purely competitive conditions,
A. its labor demand curve will be perfectly elastic at the market-determined wage rate.
19. The market supply curve for labor is upsloping because
A. of diminishing returns.
17-8
Copyright © 2018 McGraw-Hill Education. All rights reserved. No reproduction or distribution without the prior
written consent of McGraw-Hill Education.
AACSB: Knowledge Application
A c c e s s i b i l i t y :
Keyboard Navigation
Blooms: Understand
Dif fi c ul t y:
02 Medium
Learning Objective: 17–02 Show how wage rates and employment levels are determined in
competitive labor markets.
Test Bank: I
Topic:
A Purely Competitive Labor Market
20. A firm operating in a purely competitive resource market faces a resource supply curve that
is
A. perfectly inelastic.
21. A firm that is hiring labor in a purely competitive labor market and selling its product in a
purely competitive product market will maximize its profit by hiring labor until
A. marginal revenue product is zero.
22. A profit-maximizing firm will
D. reduce employment if marginal revenue product equals marginal resource cost.
23. A profit-maximizing firm will
A. expand employment if marginal revenue product equals marginal resource cost.
24. A firm hiring labor in a perfectly competitive labor market faces a
A. downsloping labor supply curve and upsloping labor demand curve.
17–10
Copyright © 2018 McGraw-Hill Education. All rights reserved. No reproduction or distribution without the prior
written consent of McGraw-Hill Education.
competitive labor markets.
Test Bank: I
Topic:
A Purely Competitive Labor Market
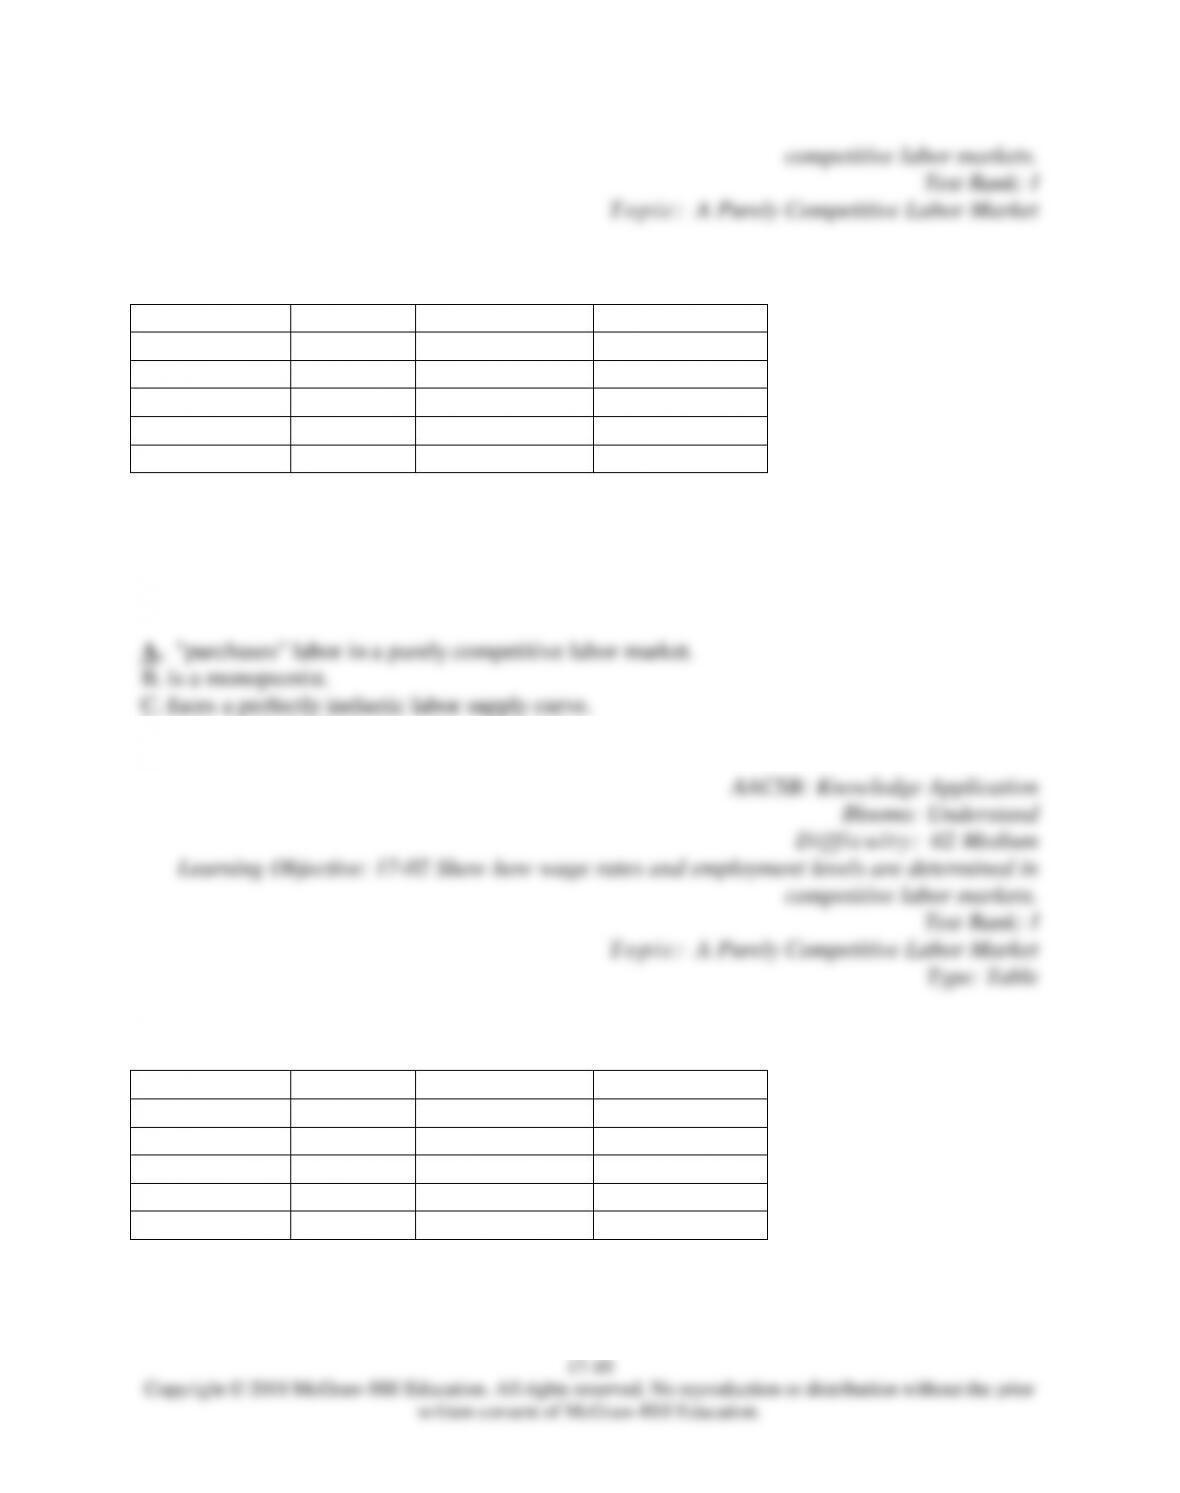
25.
Units of Labor
Wage Rate
MRC (of Labor)
MRP (of Labor)
1
$8
$8
$12
2
8
8
$10
3
8
8
8
4
8
8
6
5
8
8
4
Refer to the given data. If there is neither a union nor a minimum wage, we can conclude that
this firm
D. has a perfectly elastic labor demand curve.
26.
Units of Labor
Wage Rate
MRC (of Labor)
MRP (of Labor)
1
$8
$8
$12
2
8
8
$10
3
8
8
8
4
8
8
6
5
8
8
4
Refer to the given data. In maximizing its profit, this firm will employ
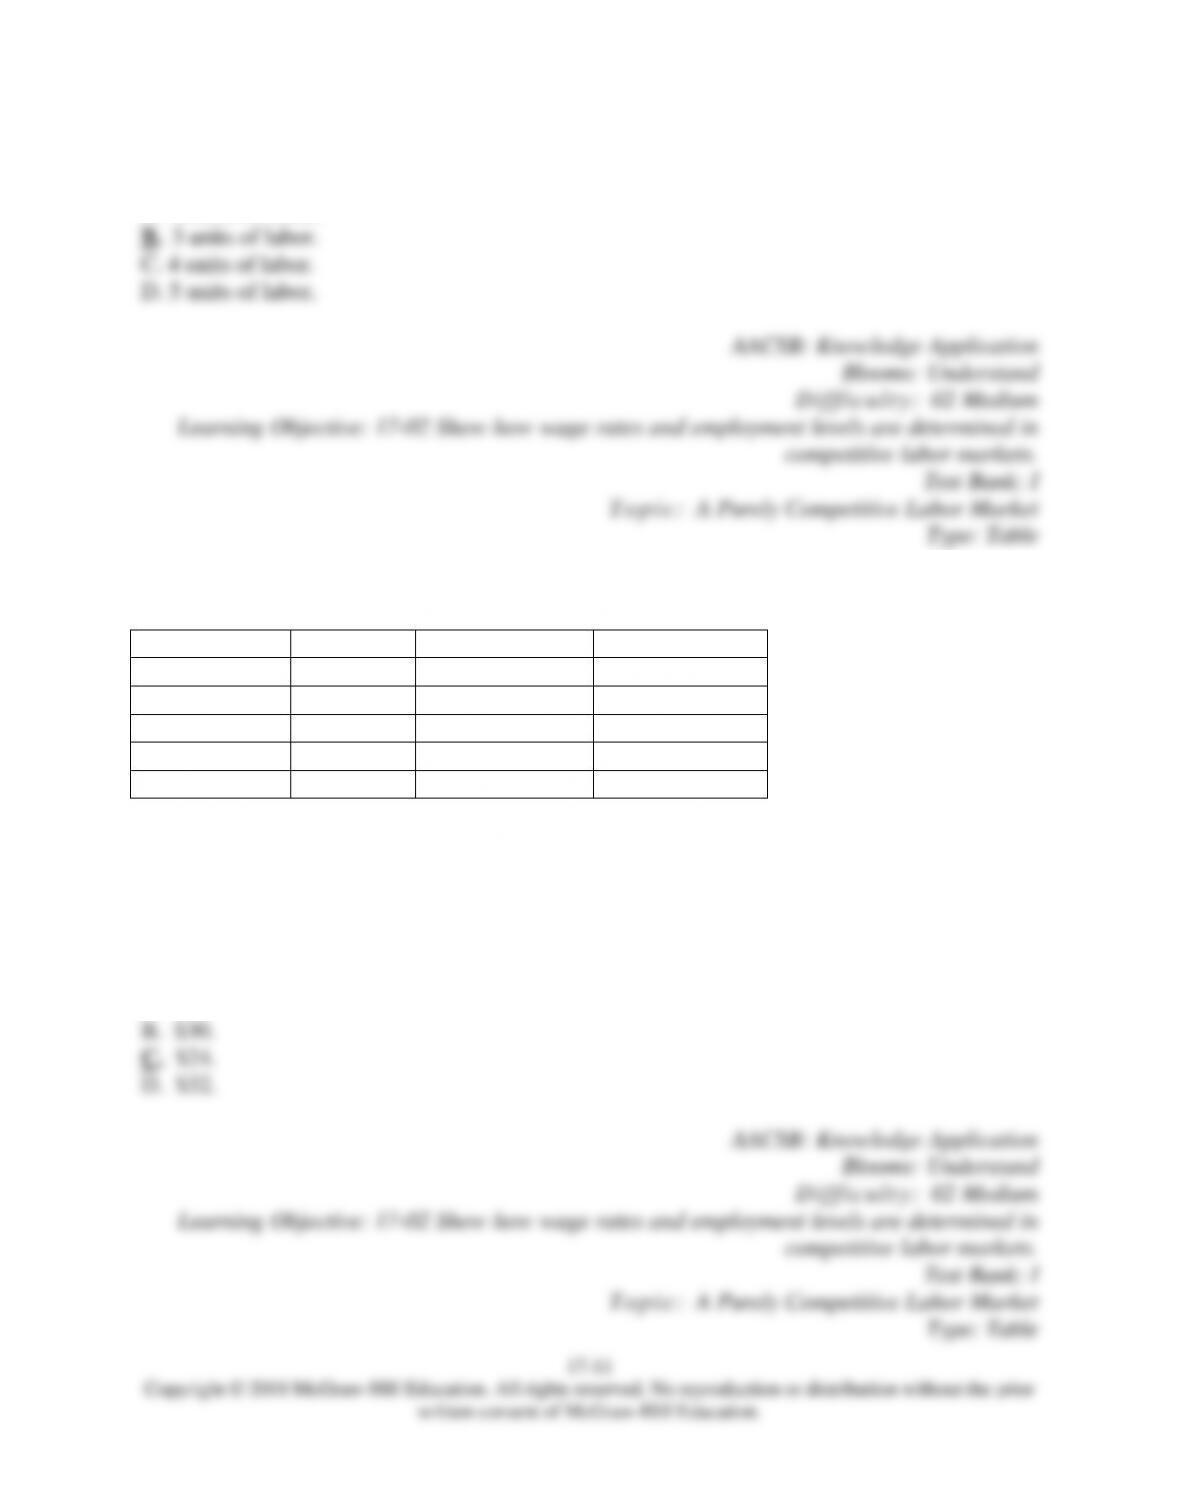
A. 2 units of labor.
27.
Units of Labor
Wage Rate
MRC (of Labor)
MRP (of Labor)
1
$8
$8
$12
2
8
8
$10
3
8
8
8
4
8
8
6
5
8
8
4
Refer to the given data. At the profit-maximizing level of employment, this firm‘s total labor
cost will be
A. $16.
17–12
28.
Units of Labor
Wage Rate
MRC (of Labor)
MRP (of Labor)
1
$8
$8
$12
2
8
8
$10
3
8
8
8
4
8
8
6
5
8
8
4
Refer to the given data. At the profit-maximizing level of employment, this firm‘s total revenue
will be
A. $16.
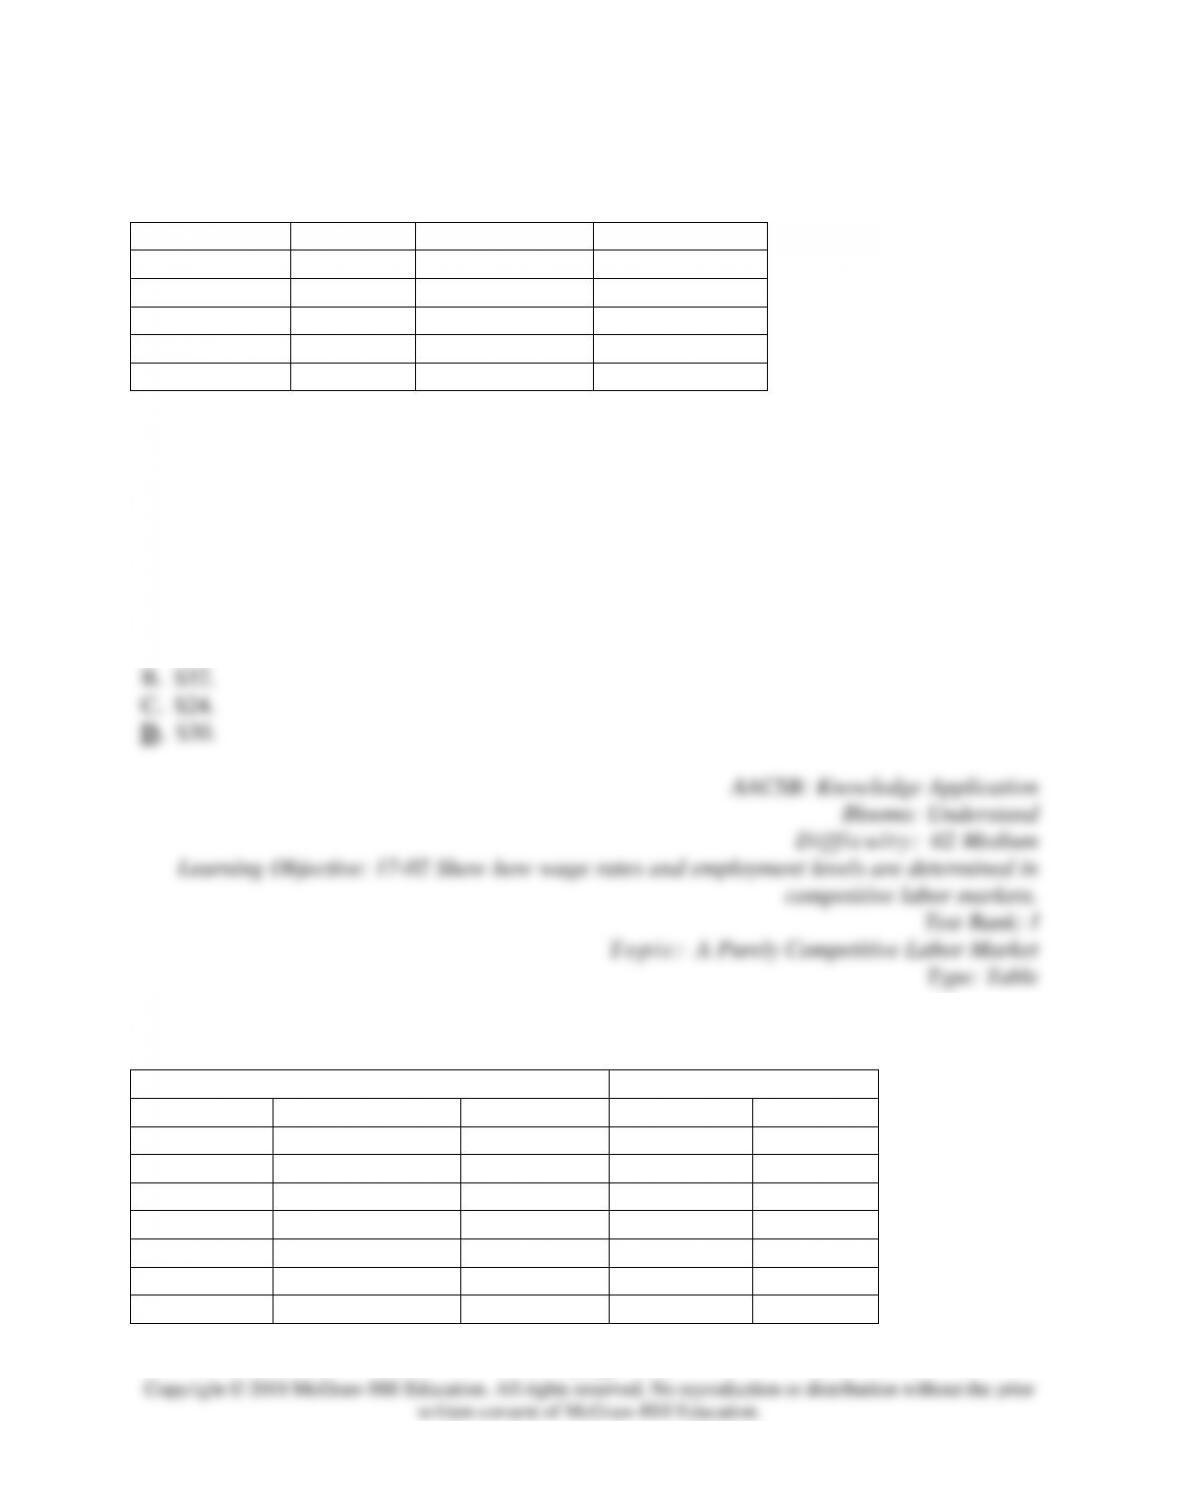
29.
Labor Demand Data
Labor Supply Data
Employment
Marginal Product
Product Price
Employment
Wage Rate
0
0
$3
0
$11
1
14
3
1
11
2
12
3
2
11
3
9
3
3
11
4
7
3
4
11
5
4
3
5
11
6
2
3
6
11
The table shows labor demand data on the left and labor supply data on the right. On the basis
of the given information, we
A. can say that the labor supply curve facing the firm is nonexistent.
30.
Labor Demand Data
Labor Supply Data
Employment
Marginal Product
Product Price
Employment
Wage Rate
0
0
$3
0
$11
1
14
3
1
11
2
12
3
2
11
3
9
3
3
11
4
7
3
4
11
5
4
3
5
11
6
2
3
6
11
The table shows labor demand data on the left and labor supply data on the right. The labor
supply curve facing this firm is
A. such that it does not intersect the labor demand curve.
17–14
Copyright © 2018 McGraw-Hill Education. All rights reserved. No reproduction or distribution without the prior
written consent of McGraw-Hill Education.
AACSB: Knowledge Application
Blooms: Understand
Dif fi c ul t y:
02 Medium
Learning Objective: 17–02 Show how wage rates and employment levels are determined in
competitive labor markets.
Test Bank: I
Topic:
A Purely Competitive Labor Market
Type: Table
31.
Labor Demand Data
Labor Supply Data
Employment
Marginal Product
Product Price
Employment
Wage Rate
0
0
$3
0
$11
1
14
3
1
11
2
12
3
2
11
3
9
3
3
11
4
7
3
4
11
5
4
3
5
11
6
2
3
6
11
The table shows labor demand data on the left and labor supply data on the right. The firm is
hiring labor
A. at a wage rate that exceeds labor’s MRP.
32.
Labor Demand Data
Labor Supply Data
Employment
Marginal Product
Product Price
Employment
Wage Rate
0
0
$3
0
$11
1
14
3
1
11
2
12
3
2
11
3
9
3
3
11
4
7
3
4
11
5
4
3
5
11
6
2
3
6
11
The table shows labor demand data on the left and labor supply data on the right. The firm will
maximize profits (or minimize losses) by employing
A. 2 workers.
17–16
Copyright © 2018 McGraw-Hill Education. All rights reserved. No reproduction or distribution without the prior
written consent of McGraw-Hill Education.
33.
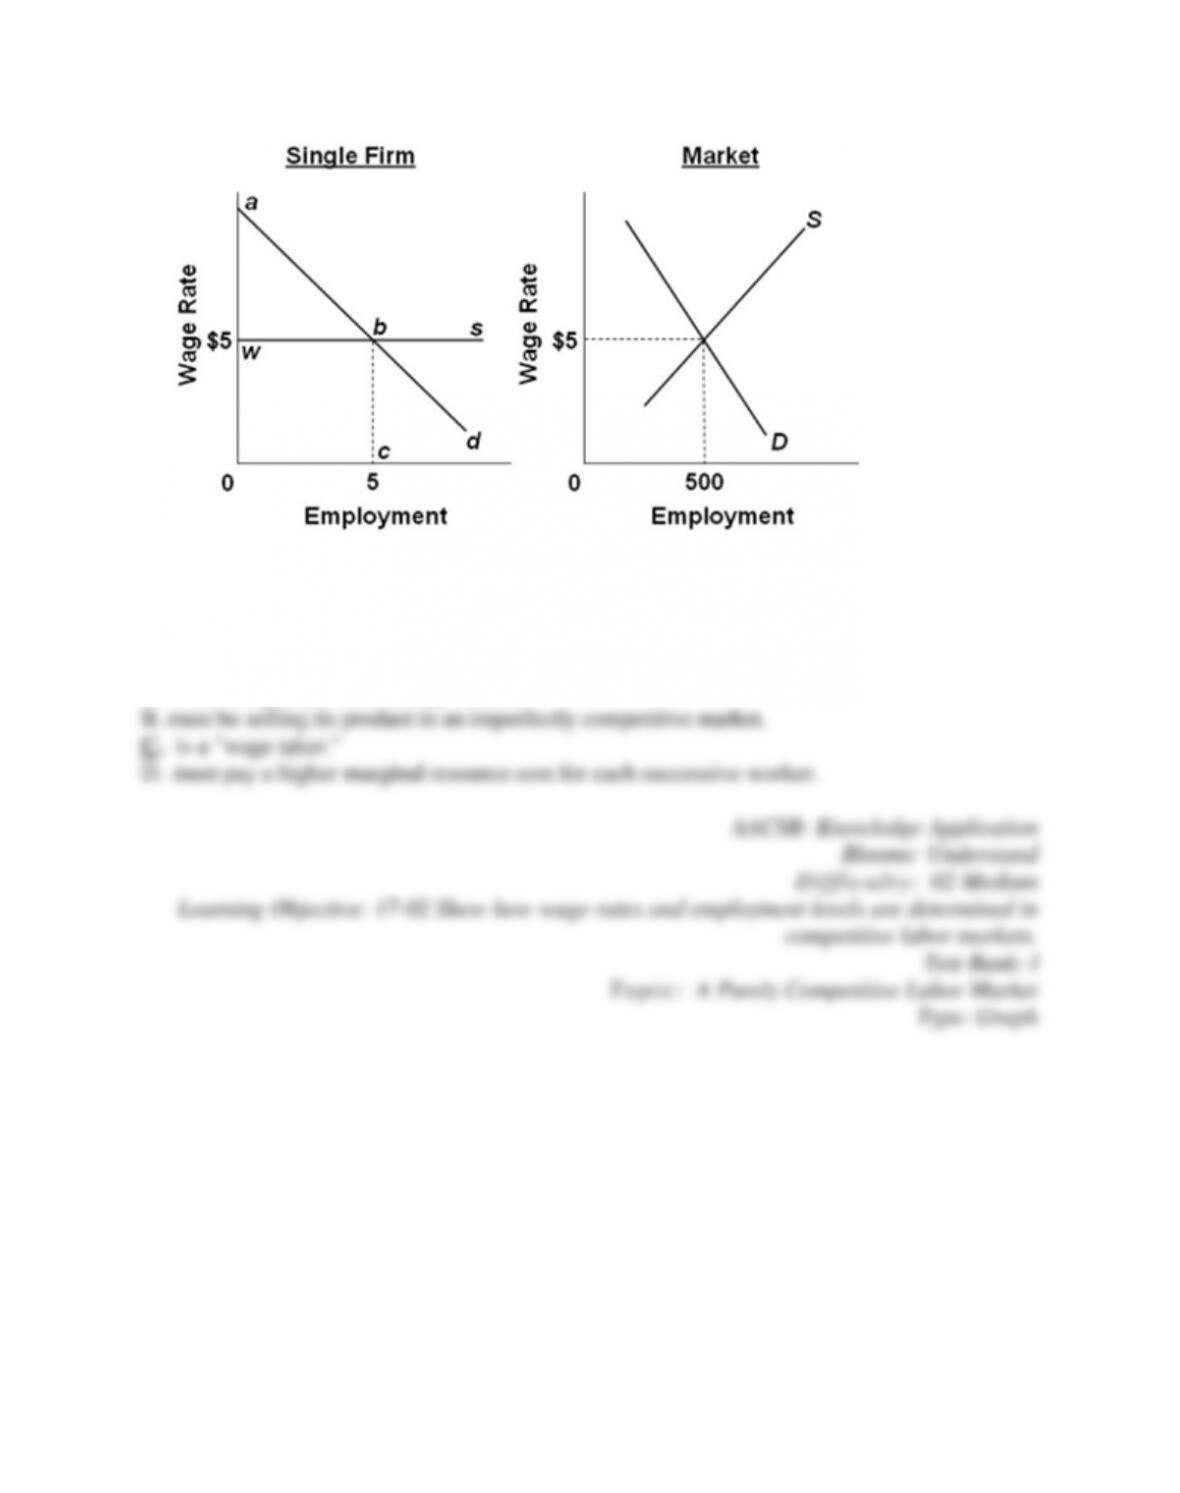
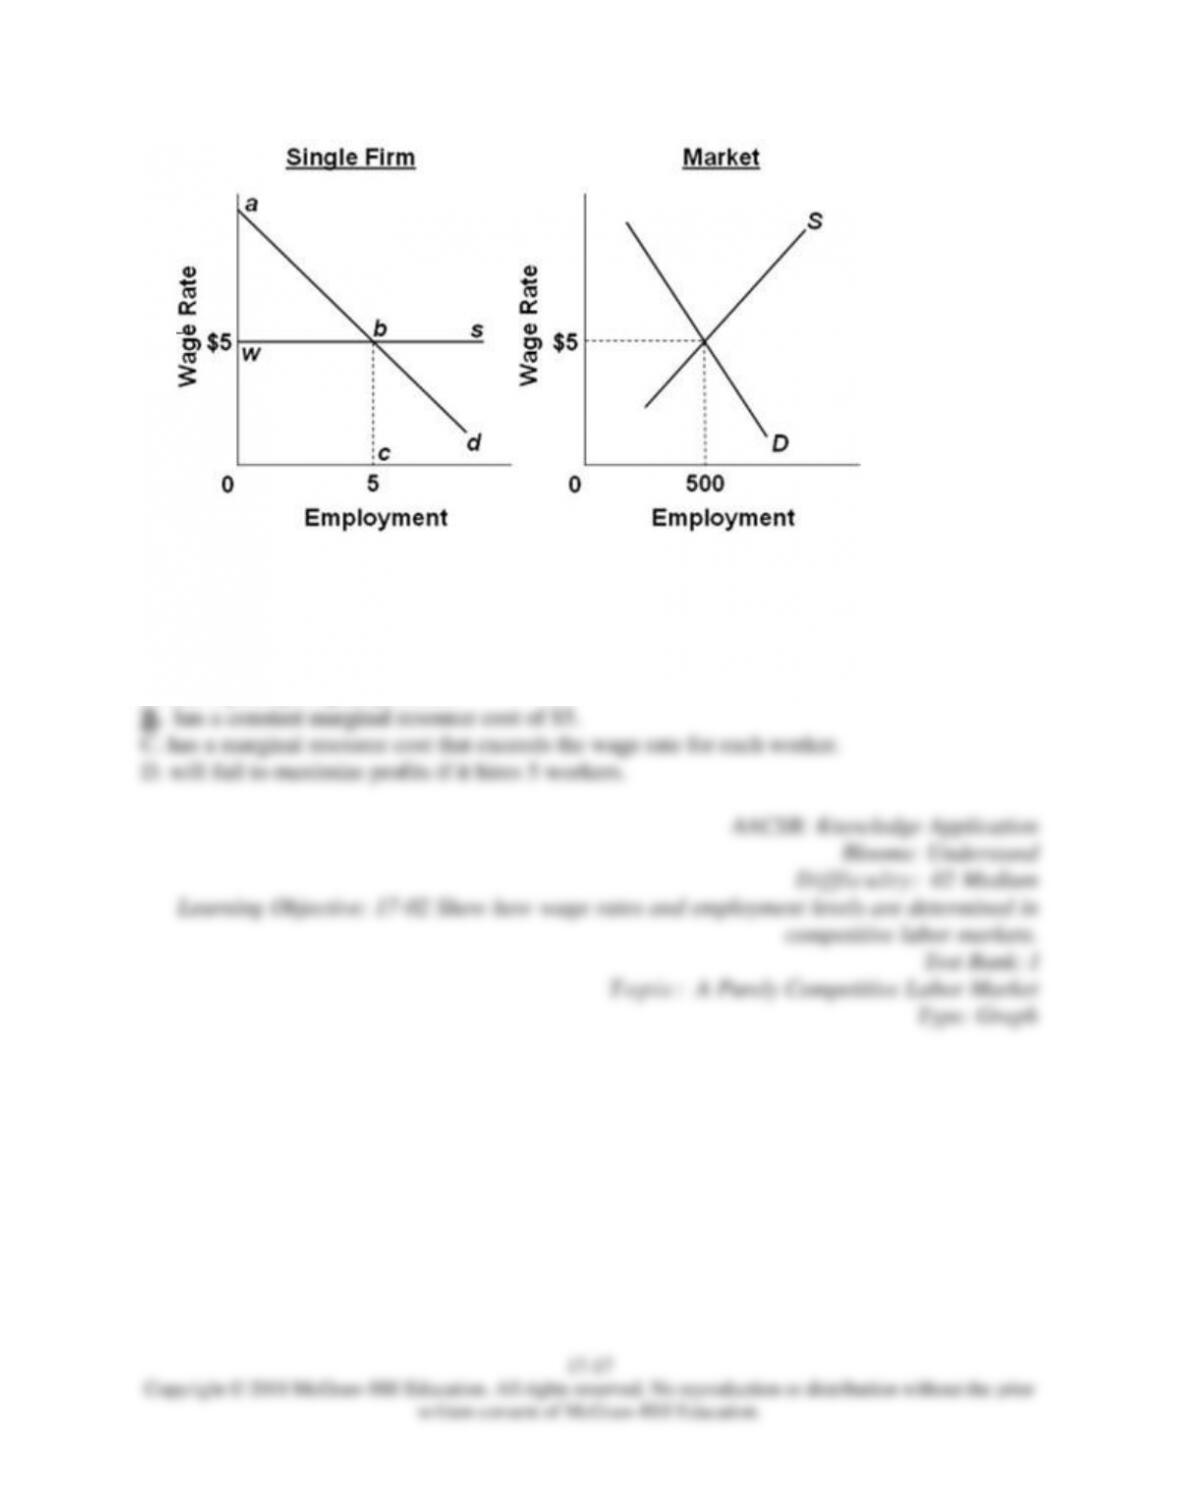
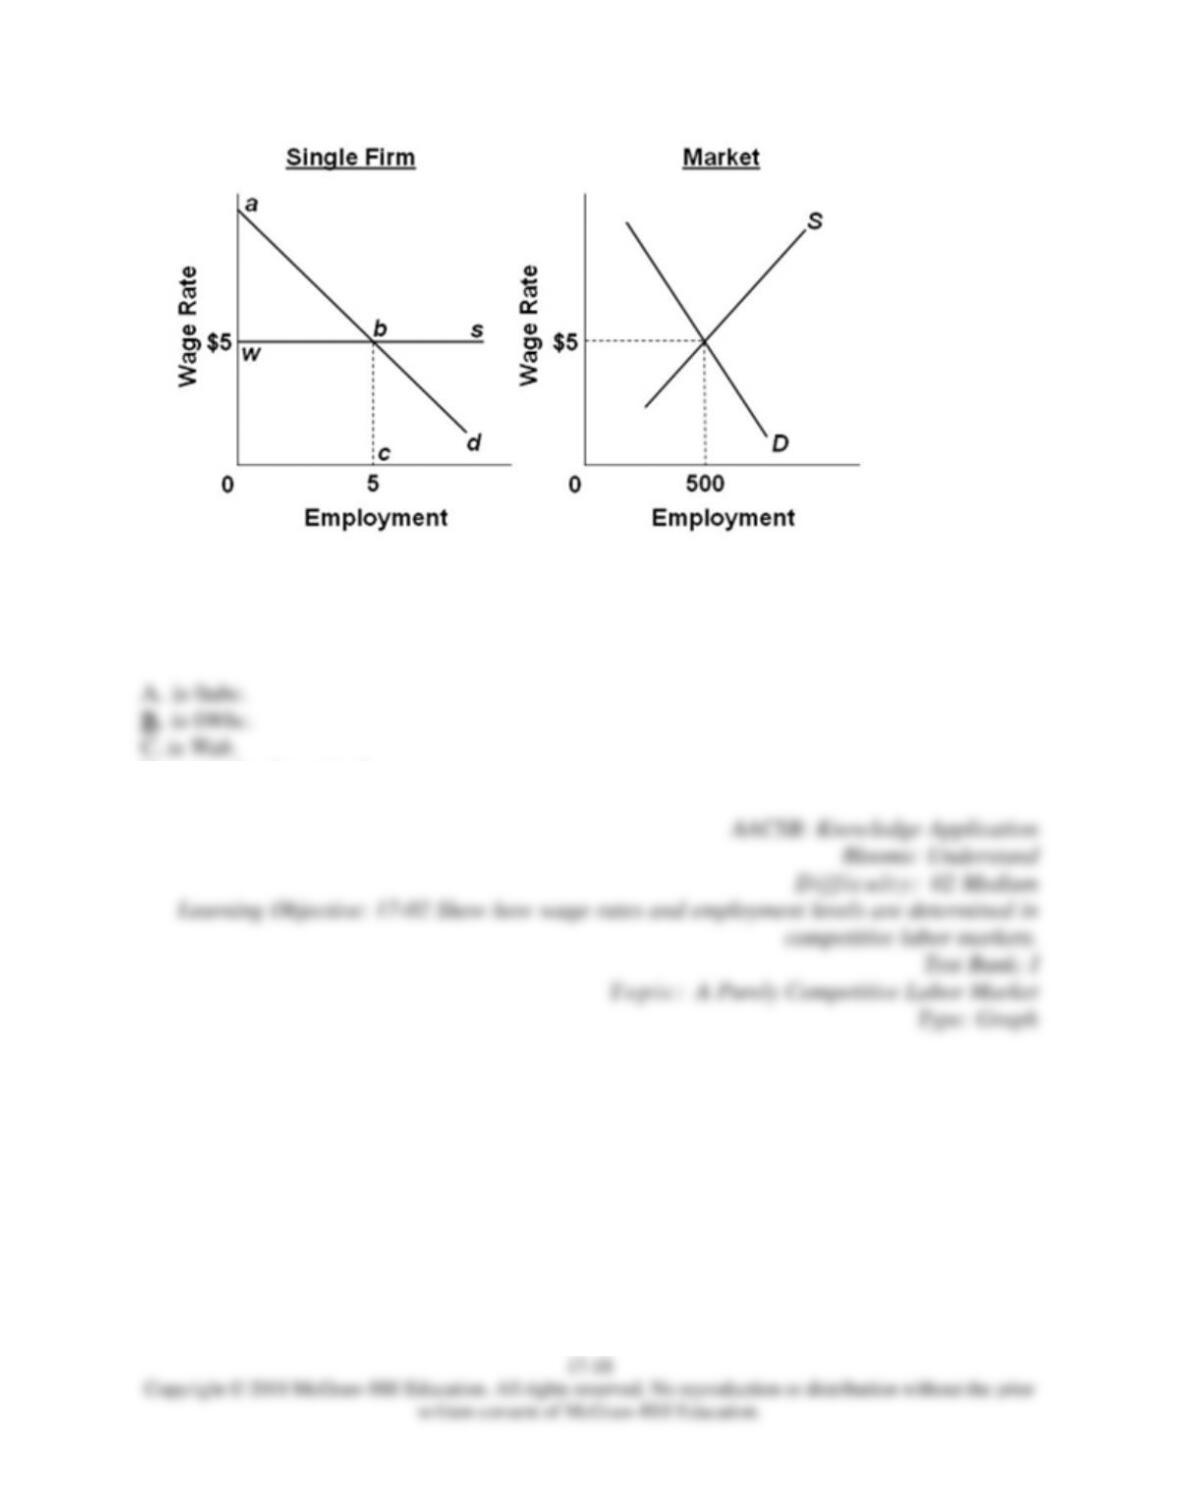
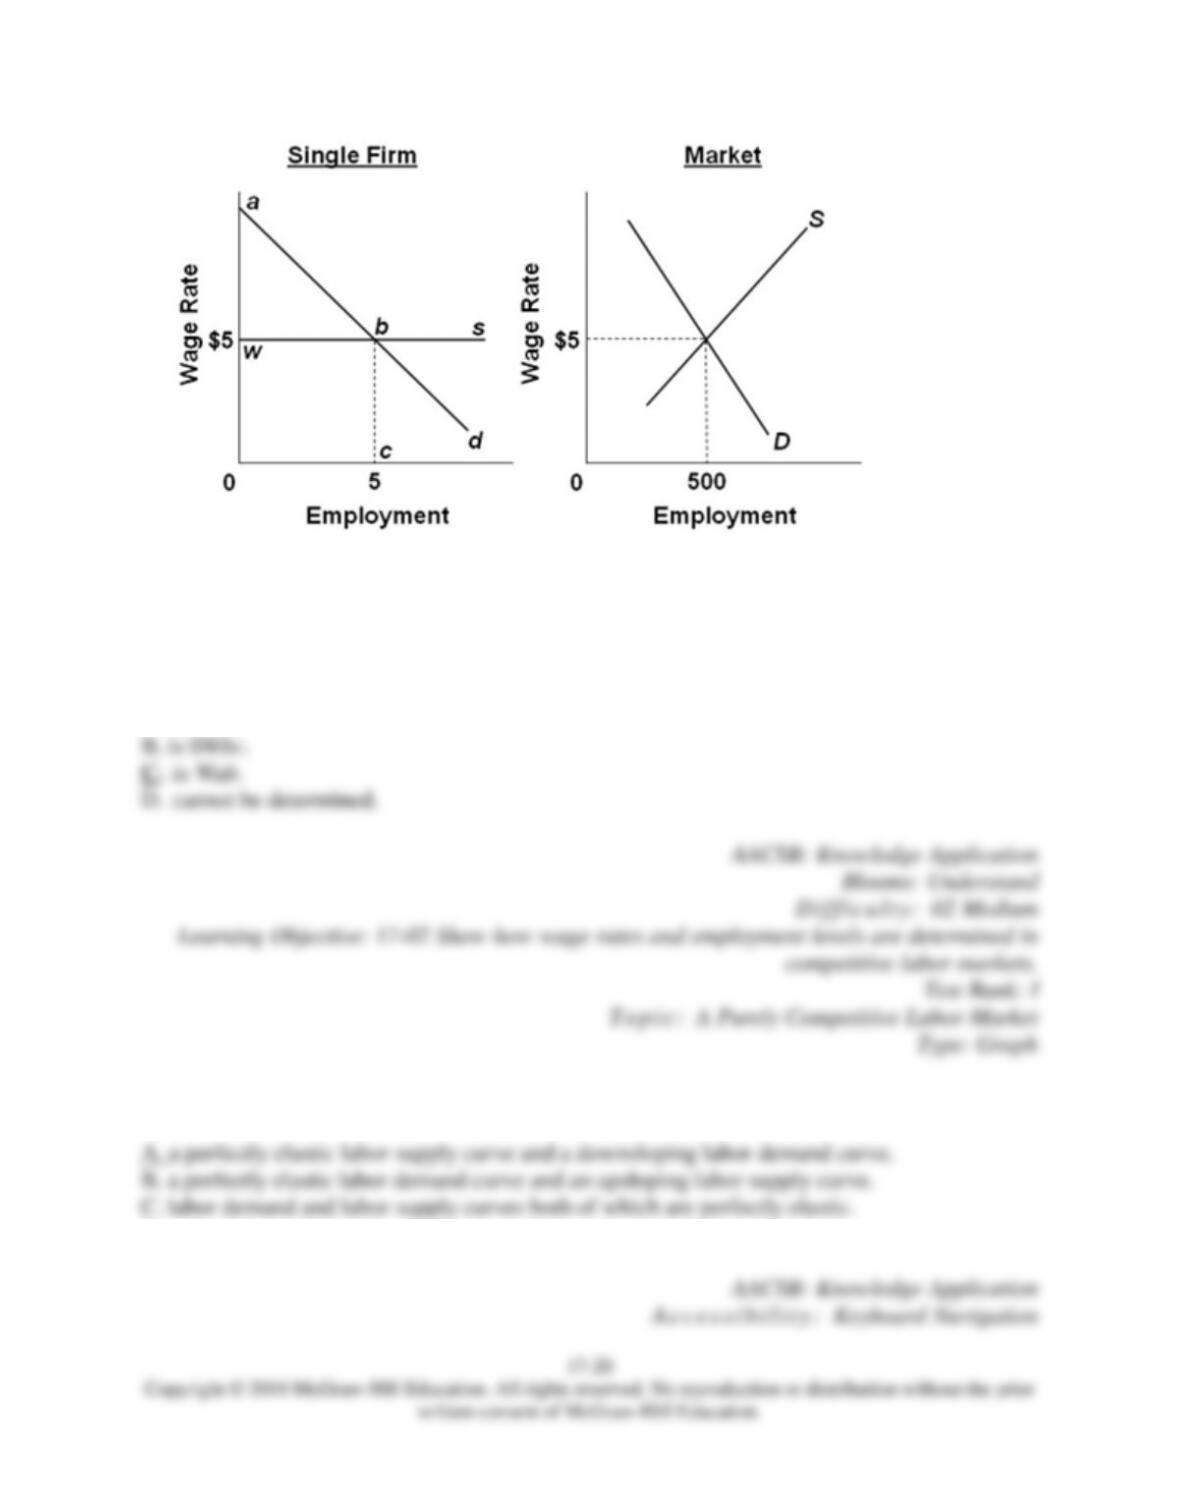
Refer to the diagrams. The firm
A. is a monopsonist in the hiring of labor.
34.
Refer to the diagrams. The firm
A. has a principal-agent problem.
35.
Refer to the diagrams. The profit-maximizing firm’s total wage cost
D. cannot be determined.

36.
Refer to the diagrams. The profit-maximizing firm’s total revenue
D. cannot be determined.
37.
Refer to the diagrams. At the profit-maximizing level of employment for this firm, the amount
available to pay to nonlabor resources
A. is 0abc.
38. The individual firm in a purely competitive labor market faces
D. a downsloping labor demand curve and an upsloping labor supply curve.