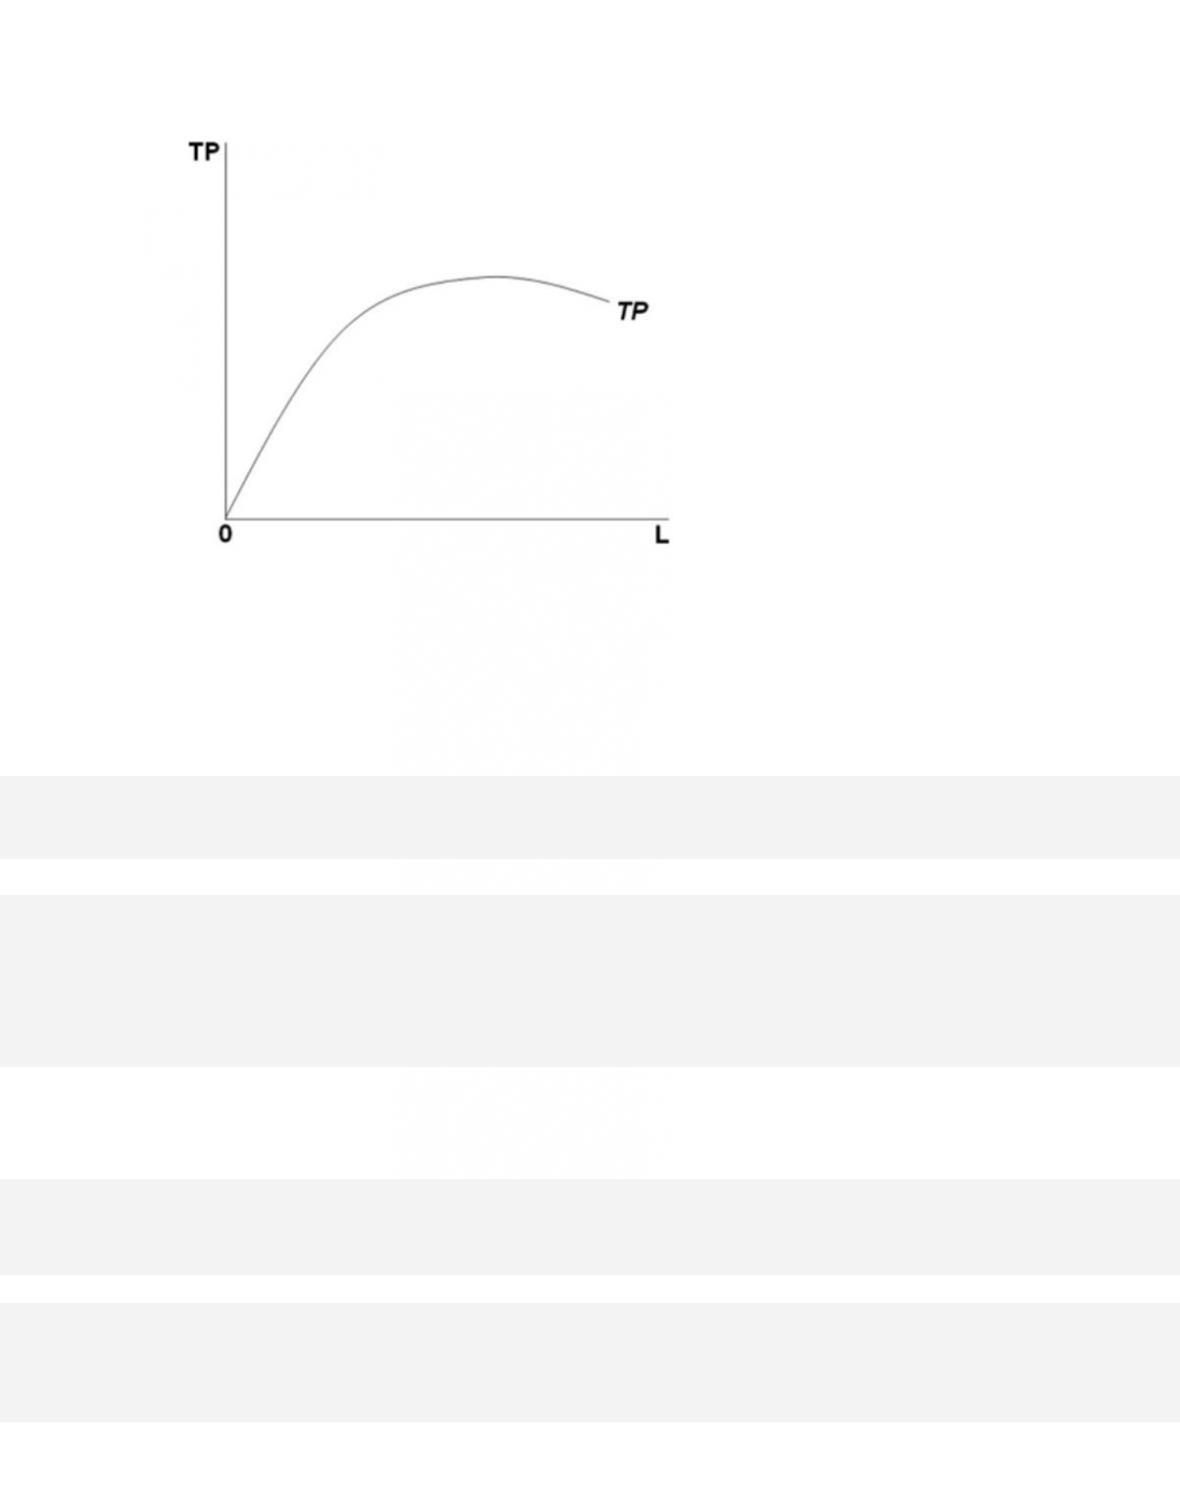
174.
Refer to the graph, where TP = total product and L = labor input. If this graph is for a firm
that sells its product in a purely competitive market, then its marginal revenue
product of
labor (MRP)
A.
is constant at all levels of L.
175.
Marginal revenue product describes the
A.
output produced by the last unit of labor employed.

16–82
Copyright © 2018 McGraw-Hill Education. All rights reserved. No reproduction or distribution without the prior
written consent of McGraw-Hill Education.
Blooms: Understand
Difficulty:
02 Medium
Learning Objective: 16–02 Convey how the marginal revenue productivity of a resource
relates to a firms demand for that resource.
Test Bank: II
To pic:
Marginal Productivity Theory of Resource Demand
176.
The marginal revenue product of a resource depends on the following factors, except
D.
the marginal product of the resource.
177.
Workers
Total Revenue
1
$1,000
2
1,400
3
2,000
4
1,600
5
800
Wayne‘s Jacket Shop sells Wayne‘s jackets for $20 each. Wayne finds that when he hires
different numbers of workers, the corresponding total revenues are as shown in
the table.
What is the marginal revenue product of the third worker?
D. $6,000

16–83
Copyright © 2018 McGraw-Hill Education. All rights reserved. No reproduction or distribution without the prior
written consent of McGraw-Hill Education.
Blooms: Understand
Difficulty:
02 Medium
Learning Objective: 16–02 Convey how the marginal revenue productivity of a resource
relates to a firms demand for that resource.
Test Bank: II
To pic:
Marginal Productivity Theory of Resource Demand
178.
Workers
Total Revenue
1
$1,000
2
1,400
3
2,000
4
1,600
5
800
Wayne‘s Jacket Shop sells Wayne‘s jackets for $20 each. Wayne finds that when he hires
different numbers of workers, the corresponding total revenues are as shown in
the table.
What is the marginal revenue product of the fifth worker?
A. $160
179. Marginal resource cost is
A.
the increase in variable costs resulting from producing one more unit of output.

16–84
Copyright © 2018 McGraw-Hill Education. All rights reserved. No reproduction or distribution without the prior
written consent of McGraw-Hill Education.
AACSB: Knowledge Application
A c c e s s i b i l i t y :
Keyboard Navigation
Blooms: Understand
Difficulty:
02 Medium
Learning Objective: 16–02 Convey how the marginal revenue productivity of a resource
relates to a firms demand for that resource.
Test Bank: II
To pic:
Marginal Productivity Theory of Resource Demand
180.
Units of Resource
Total Product
1
24
2
42
3
54
4
64
5
72
The table shows a total-product schedule for a resource. Assume that the quantities of other
resources the firm employs remain constant. If the product the firm produces
sells for a
constant $2 per unit, the marginal revenue product of the third unit of the resource is
A. $6.
181.
Units of Resource
Total Product
1
24
2
42
3
54
4
64
5
72

The table shows a total-product schedule for a resource. Assume that the quantities of other
resources the firm employs remain constant. If the firm’s product sells for a
constant $2 and
the price of the resource is a constant $16, the firm will employ how many units of the
resource?
D.
2
182.
Units of Resource
Total Product
1
24
2
42
3
54
4
64
5
72
The table shows a total-product schedule for a resource. Assume that the quantities of other
resources the firm employs remain constant. If the firm can sell 24 units of
output at a price
of $1.00 and 42 units of output at a price of $0.80, the marginal revenue product of the
second unit of the resource is
A. $5.40.

16–86
Copyright © 2018 McGraw-Hill Education. All rights reserved. No reproduction or distribution without the prior
written consent of McGraw-Hill Education.
Blooms: Understand
Difficulty:
02 Medium
Learning Objective: 16–02 Convey how the marginal revenue productivity of a resource
relates to a firms demand for that resource.
Test Bank: II
To pic:
Marginal Productivity Theory of Resource Demand
183.
Units of Resource
Total Product
1
24
2
42
3
54
4
64
5
72
The table shows a total-product schedule for a resource. Assume that the quantities of other
resources the firm employs remain constant. If the firm can produce 24 units
at a price of
$1.00, 42 units at a price of $0.80, and 54 units at a price of $0.60, then the firm is
A. selling in a purely competitive market.
184.
The marginal resource cost of labor for a firm refers to the
D.
same concept as the marginal revenue product of a firm.

16–87
Copyright © 2018 McGraw-Hill Education. All rights reserved. No reproduction or distribution without the prior
written consent of McGraw-Hill Education.
A c c e s s i b i l i t y :
Keyboard Navigation
Blooms: Understand
Difficulty:
02 Medium
Learning Objective: 16–02 Convey how the marginal revenue productivity of a resource
relates to a firms demand for that resource.
Test Bank: II
To pic:
Marginal Productivity Theory of Resource Demand
185.
A profit–maximizing firm will employ labor up to the point where the
D.
MP = MC.
186.
If the marginal revenue product (MRP) of labor is less than the wage rate,
A.
the firm is making profits.
187.
A profit–maximizing firm should hire an input as long as the
A.
firm can increase its total revenue.

16–88
Copyright © 2018 McGraw-Hill Education. All rights reserved. No reproduction or distribution without the prior
written consent of McGraw-Hill Education.
C.
marginal revenue product of the input is at least as much as the cost of hiring the input.
D. marginal revenue product of the input is greater than the marginal revenue product of
other inputs the firm is using.
188.
A competitive employer will hire inputs up to the point where the
A.
marginal product of the input reaches a maximum.
189.
Under pure competition, the market price of an output is $3. The output schedule of a
firm using input X is listed in the table. If the price of input X is $12, how many units
of
input X will the firm employ to maximize profits?
Units of X
Marginal
Product
1
10.0
2
9.9
3
8.8
4
7.7
5
6.6
6
5.5
7
4.4
8
3.3

16–89
9
2.2
A.
4
190. According to the marginal productivity theory of resource demand, the labor-demand
schedule for a producer selling in a purely competitive market is
A.
the same as the marginal resource cost schedule.
191.
Number of Workers
Total Product
Product Price ($)
0
0
3
1
16
3
2
26
3
3
34
3
4
40
3
5
44
3

The table is for a purely competitive market for resources. At a wage rate of $23 per worker,
the firm will choose to employ
A. 2 workers
192.
Number of Workers
Total Product
Product Price ($)
0
0
3
1
16
3
2
26
3
3
34
3
4
40
3
5
44
3
The table is for a purely competitive market for resources. How many more workers will the
firm hire when the wage rate is $15 instead of $30?
A. 1 worker

16–91
Copyright © 2018 McGraw-Hill Education. All rights reserved. No reproduction or distribution without the prior
written consent of McGraw-Hill Education.
Test Bank: II
To pic:
Marginal Productivity Theory of Resource Demand
193.
Number of Workers
Total Product
Product Price ($)
0
0
3
1
16
3
2
26
3
3
34
3
4
40
3
5
44
3
The table is for a purely competitive market for resources. If the product price increases
from $3 to $4, then at the wage rate of $15, the firm will hire
A.
2 workers.
194.
The labor demand curve of a firm that sells its product in an imperfectly competitive
market
A.
is downsloping, solely because of the law of diminishing returns.

16–92
Copyright © 2018 McGraw-Hill Education. All rights reserved. No reproduction or distribution without the prior
written consent of McGraw-Hill Education.
Blooms: Understand
Difficulty:
02 Medium
Learning Objective: 16–02 Convey how the marginal revenue productivity of a resource
relates to a firms demand for that resource.
Test Bank: II
To pic:
Marginal Productivity Theory of Resource Demand
195.
The labor demand curve of a firm that sells its product in a purely competitive market
A. is horizontal or perfectly elastic.
196.
Assume that the resource market is purely competitive. If the price of the resource falls,
other factors constant, then a firm that sells its product in a purely competitive
market will
D.
decrease production by a smaller amount than a firm with some monopoly power in its
product market.

16–93
Copyright © 2018 McGraw-Hill Education. All rights reserved. No reproduction or distribution without the prior
written consent of McGraw-Hill Education.
To pic:
Marginal Productivity Theory of Resource Demand
197.
Quantity of Resource Y Employed
Marginal Product of Y
Product Price
0
—
1
44
$2.00
2
42
1.90
3
36
1.80
4
32
1.70
5
24
1.60
6
14
1.50
7
2
1.40
Refer to the table. Assume that the quantities of other resources employed by the firm remain
constant. How many units of resource Y would the firm employ at a price of
$50 per unit of Y?
A. 2
198.
Units of Resource
Total Product
Product Price
0
0
$3.80
1
10
3.70
2
19
3.60
3
27
3.50
4
34
3.40
5
40
3.30

Refer to the table. The marginal revenue product of the fourth unit of input is approximately
A. $27.
199.
Workers
Marginal Product (Units/Day)
1
24
2
28
3
24
4
20
5
16
6
12
7
8
The table contains data for a profit–maximizing firm. The price of the firm’s product is $10
per unit, and the wage rate is a constant $110 a day. How many workers will
the firm hire,
assuming purely competitive product and resource markets?
A.
4

16–95
Copyright © 2018 McGraw-Hill Education. All rights reserved. No reproduction or distribution without the prior
written consent of McGraw-Hill Education.
relates to a firms demand for that resource.
Test Bank: II
To pic:
Marginal Productivity Theory of Resource Demand
200.
The marginal revenue product of an economic resource for a firm operating in purely
competitive product and resource markets
A. is the marginal product of the resource divided by the price of the final product.
D.
decreases as the quantity of output decreases.
201.
A profit–maximizing firm’s daily total revenue is $155 with 3 workers, $200 with 4
workers, and $230 with 5 workers. The cost of each worker is $40 per day. The firm
should
A. not hire a fourth worker.
202.
A profit–maximizing firm will use additional units of resources for production until
A.
total, average, and marginal cost are equal.

16–96
Copyright © 2018 McGraw-Hill Education. All rights reserved. No reproduction or distribution without the prior
written consent of McGraw-Hill Education.
C.
the marginal revenue product equals the marginal resource cost.
D. the marginal revenue product is greater than the marginal resource cost.
203.
Quantity of Resource X Employed
Total Product
0
0
1
24
2
44
3
60
4
72
5
80
6
84
7
86
The table shows the total output a firm will be able to produce if it employs varying amounts
of resource X while holding the amounts of the other resources constant.
Assume that the
product price is constant at $3.00 per unit. How many units of resource X will be employed
if its price is $24 per unit?
A.
3

204.
Units of Resource
0
1
2
3
4
5
Total Product
0
10
18
24
28
30
Total Revenue ($)
0
30
54
72
84
90
Refer to the table. The marginal revenue product of the third unit of resource is
A. $4.
205.
Units of Resource
0
1
2
3
4
5
Total Product
0
10
18
24
28
30
Total Revenue ($)
0
30
54
72
84
90
Refer to the table. The price of the product being produced by this resource is

16–98
Copyright © 2018 McGraw-Hill Education. All rights reserved. No reproduction or distribution without the prior
written consent of McGraw-Hill Education.
relates to a firms demand for that resource.
Test Bank: II
To pic:
Marginal Productivity Theory of Resource Demand
206.
Units of Resource
0
1
2
3
4
5
Total Product
0
10
18
24
28
30
Total Revenue ($)
0
30
54
72
84
90
Refer to the table. How many units of the resource would the profit-maximizing firm use if
the price of the resource was $18.00?
A.
1
207.
Units of Resource
0
1
2
3
4
5
Total Product
0
10
18
24
28
30
Total Revenue ($)
0
30
54
72
84
90
Refer to the table. The resource demand data indicate that the firm is
A.
buying its resource in an imperfectly competitive market.

16–99
Copyright © 2018 McGraw-Hill Education. All rights reserved. No reproduction or distribution without the prior
written consent of McGraw-Hill Education.
AACSB: Knowledge Application
Blooms: Understand
Difficulty:
02 Medium
Learning Objective: 16–02 Convey how the marginal revenue productivity of a resource
relates to a firms demand for that resource.
Test Bank: II
Topic :
Marginal Productivity Theory of Resource Demand
208.
Units of Resource
0
1
2
3
4
5
Total Product
0
6
11
15
18
20
Total Revenue ($)
0
36
55
60
54
40
Refer to the table. The marginal product of the third unit of the resource is
A. 3.
209.
Units of Resource
0
1
2
3
4
5
Total Product
0
6
11
15
18
20
Total Revenue ($)
0
36
55
60
54
40
Refer to the table. The marginal revenue product of the third unit of the resource is
A. $3.

16-100
Copyright © 2018 McGraw-Hill Education. All rights reserved. No reproduction or distribution without the prior
written consent of McGraw-Hill Education.
B.
$5.
C. $19.
D. $36.
210.
Units of Resource
0
1
2
3
4
5
Total Product
0
6
11
15
18
20
Total Revenue ($)
0
36
55
60
54
40
Refer to the table. The resource demand data indicate that the firm is
A.
buying its resource in an imperfectly competitive market.
211.
Units of Resource
0
1
2
3
4
5
Total Product
0
6
11
15
18
20
Total Revenue ($)
0
36
55
60
54
40