
14–21
Copyright © 2018 McGraw-Hill Education. All rights reserved. No reproduction or distribution without the prior
written consent of McGraw-Hill Education.
Di f f i cu l t y :
02 Medium
Learning Objective: 14–02 Discuss how game theory relates to oligopoly.
Test Bank: I
Topic:
Oligopoly Behavior: A Game-Theory Overview
50.
Game theory is best suited to analyze the pricing behavior of
A.
pure monopolists.
51.
Game theory can be used to demonstrate that oligopolists
A.
rarely consider the potential reactions of rivals.
52.
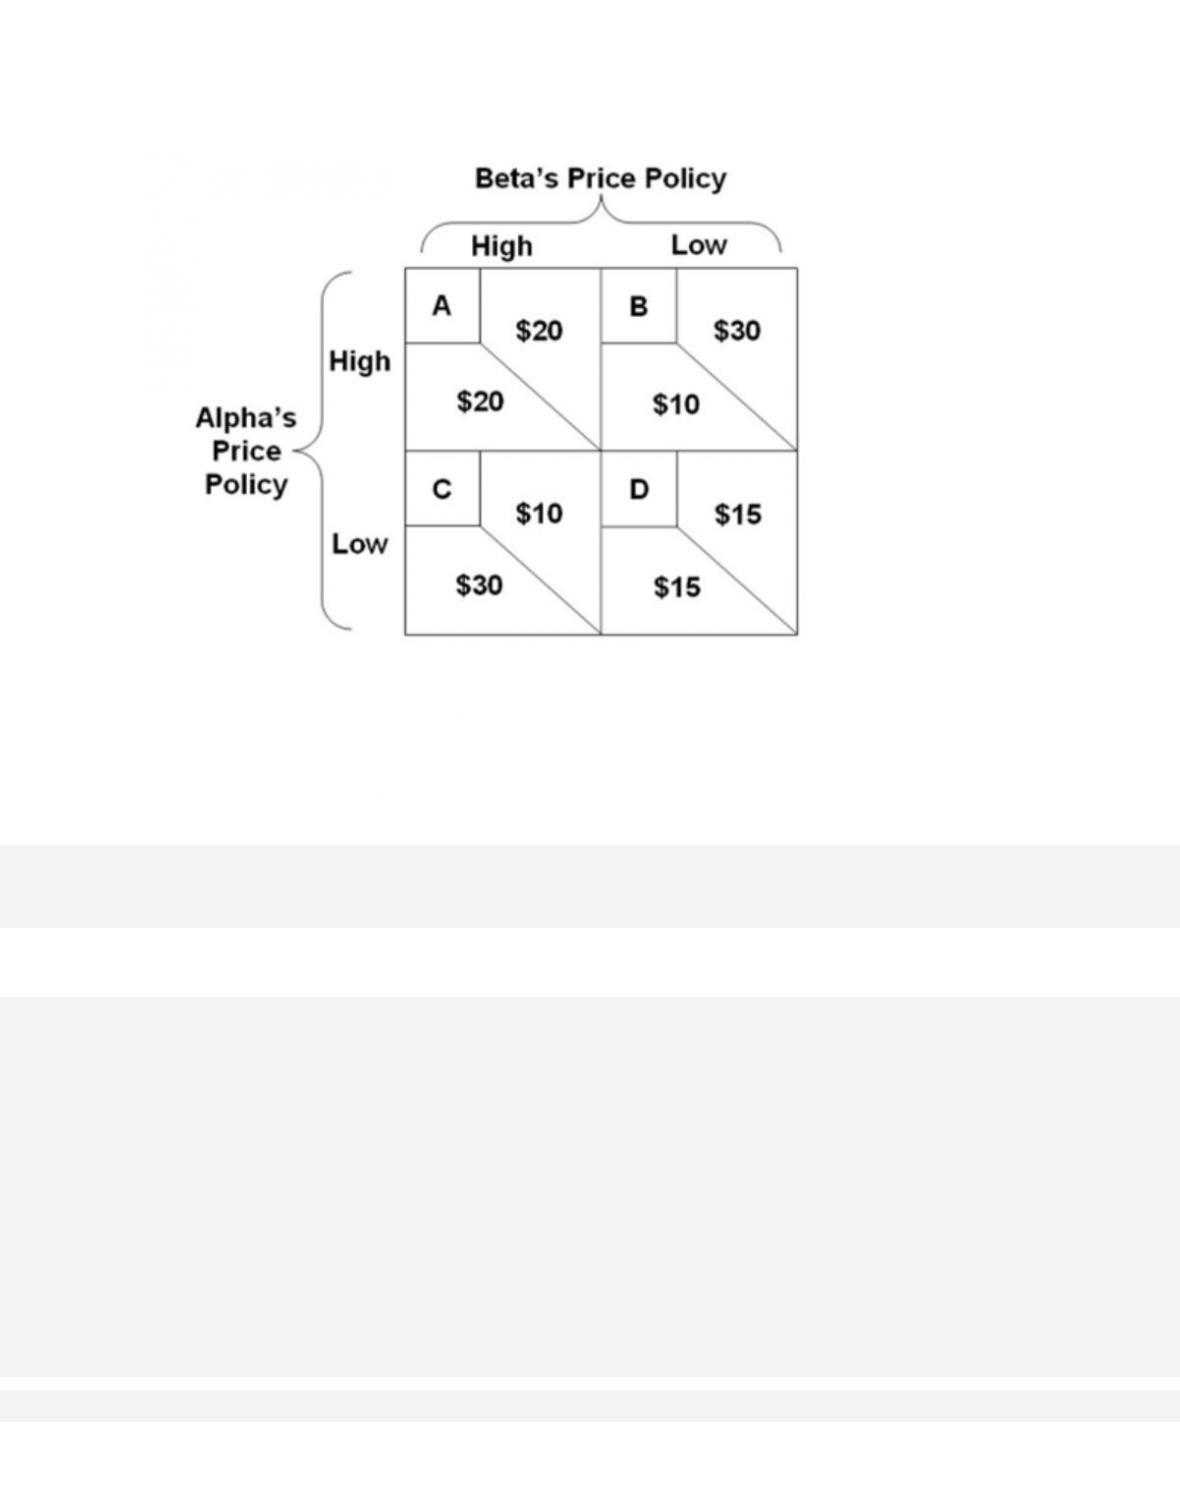
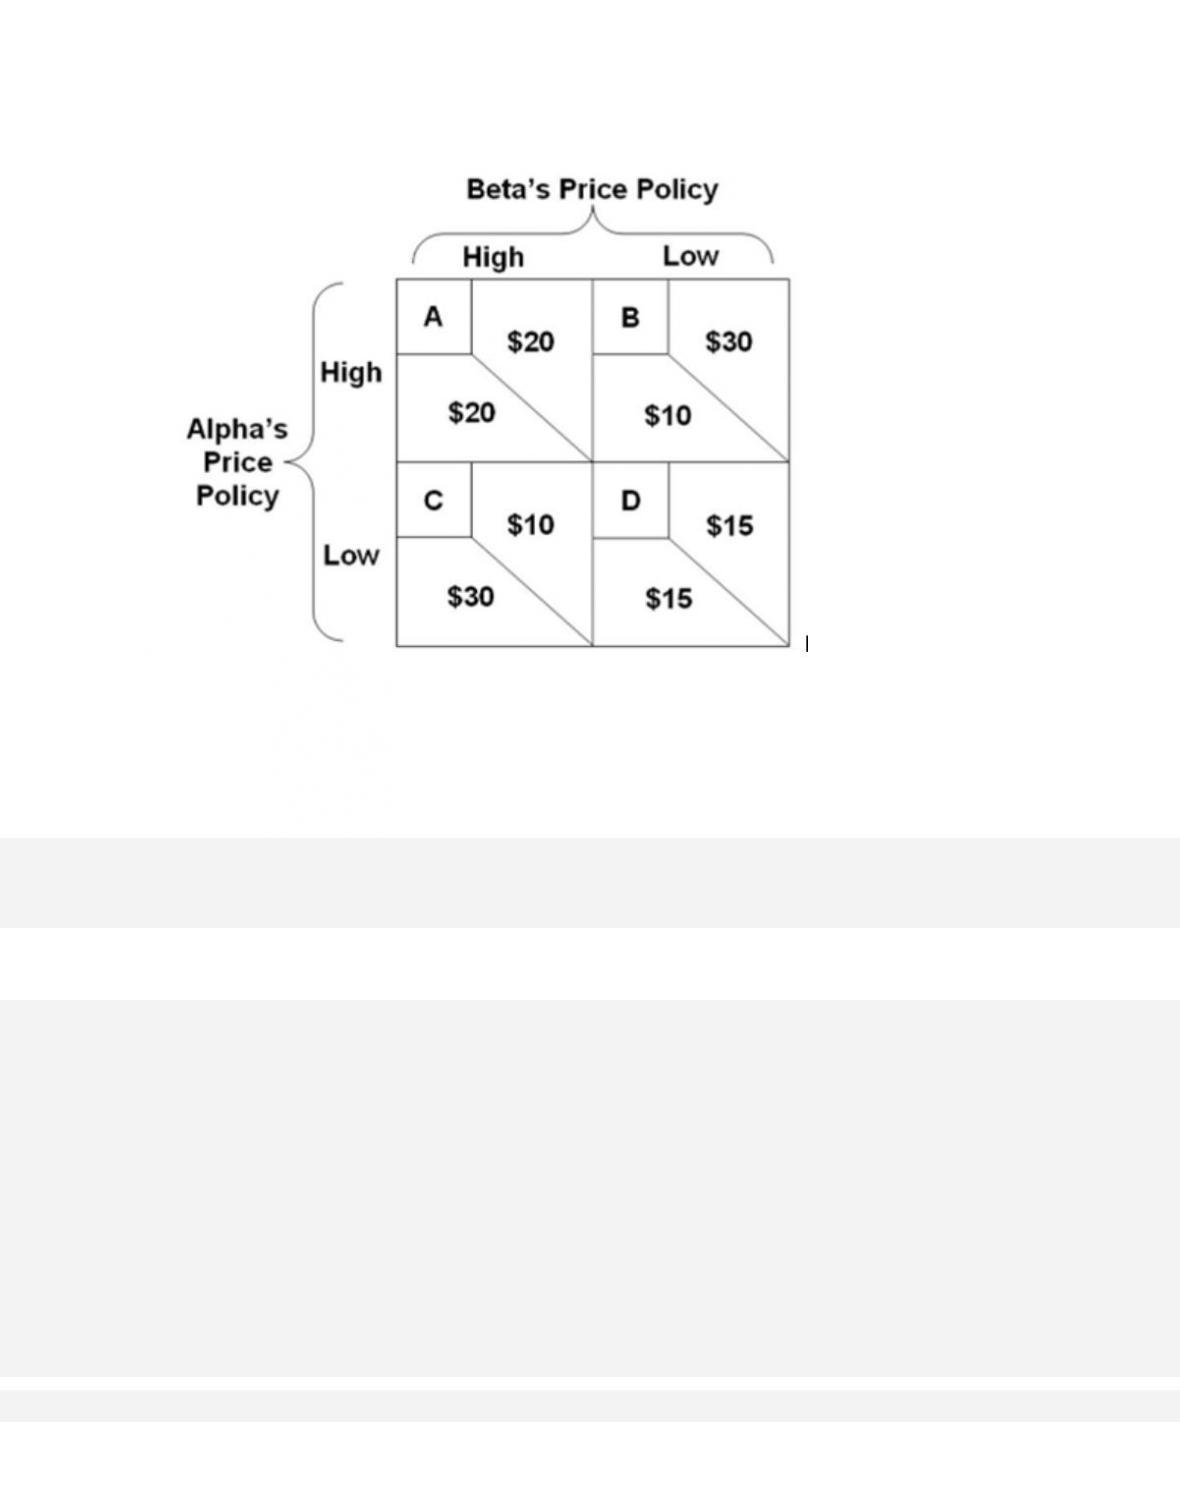
Refer to the diagram, where the numerical data show profits in millions of dollars. Beta‘s
profits are shown in the northeast corner and Alpha’s profits in the southwest corner of each
cell. If both firms follow a high-price policy,
D.
each will realize a $15 million profit.
53.
Refer to the diagram, where the numerical data show profits in millions of dollars. Beta‘s
profits are shown in the northeast corner and Alpha’s profits in the southwest corner of each
cell. If Beta commits to a high-price policy, Alpha will gain the largest profit by
A. also adopting a high-price policy.

54.
Refer to the diagram, where the numerical data show profits in millions of dollars. Beta‘s
profits are shown in the northeast corner and Alpha’s profits in the southwest corner of each
cell. With independent pricing, the outcome of this duopoly game will gravitate to cell
A.
A.
55.
Refer to the diagram, where the numerical data show profits in millions of dollars. Beta‘s
profits are shown in the northeast corner and Alpha’s profits in the southwest corner of each
cell. If Alpha and Beta engage in collusion, the outcome of the game will be at cell
C.
C.
D.
D.
56.
Refer to the diagram, where the numerical data show profits in millions of dollars. Beta‘s
profits are shown in the northeast corner and Alpha’s profits in the southwest corner of each
cell. If Alpha and Beta agree to a high-price policy through collusion, the temptation to cheat
on that agreement is demonstrated by the fact that
D.
Alpha can increase its profit by reducing its production costs.
57.
Refer to the diagram, where the numerical data show profits in millions of dollars. Beta‘s
profits are shown in the northeast corner and Alpha’s profits in the southwest corner of each
cell. Which cell represents a Nash equilibrium?
D.
There is no Nash equilibrium in this game.
58.
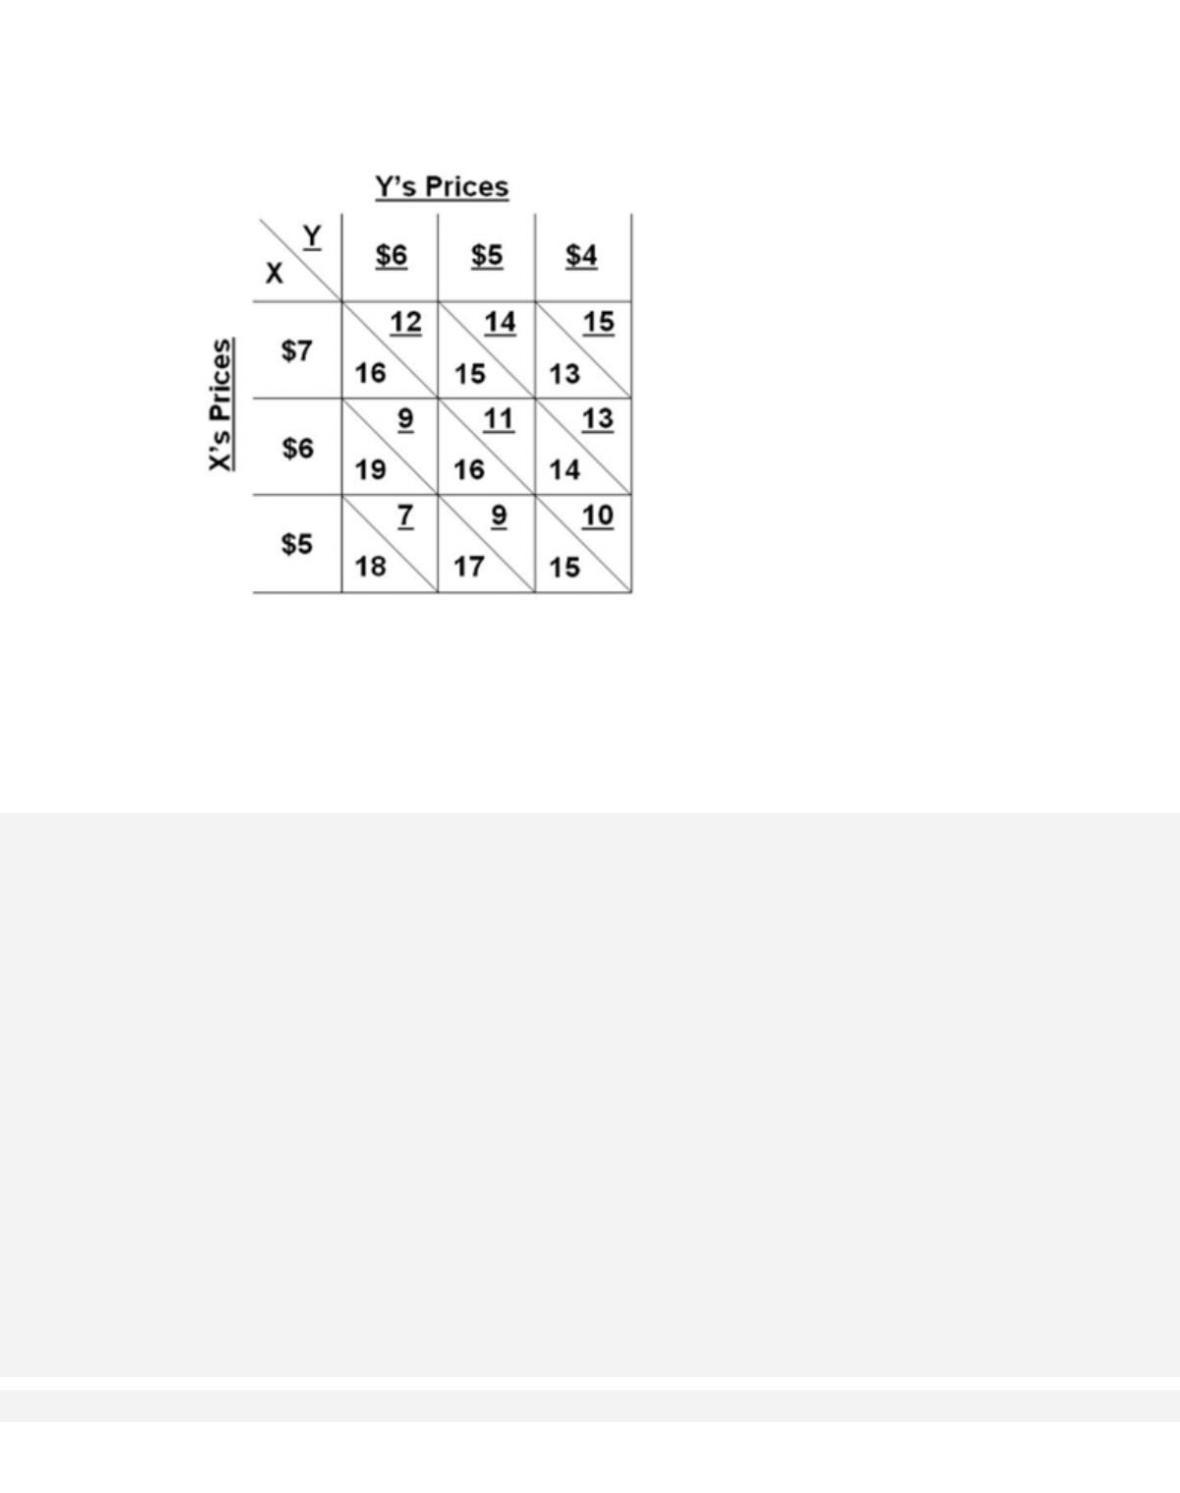
Refer to the profits-payoff table for a duopoly. If the firms are acting independently and firm X
sets its price at $6, firm Y will achieve the largest profit by selecting
A.
a price higher than $6.
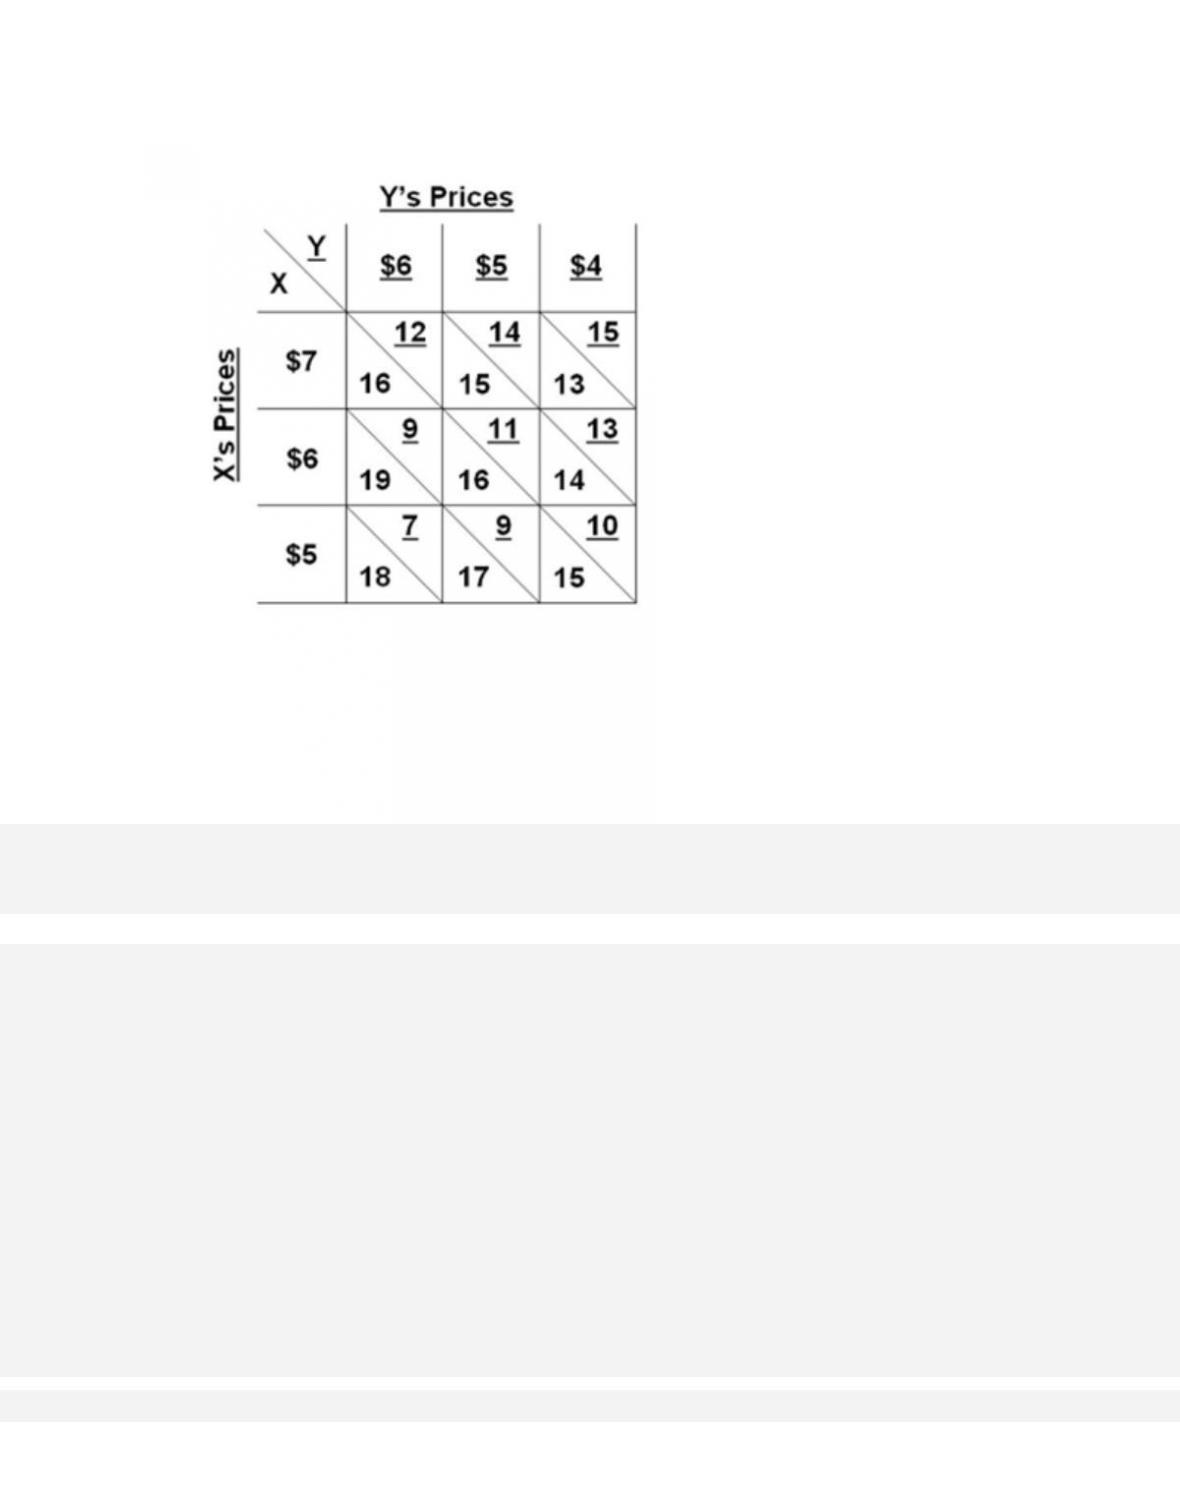
59.
Refer to the profits-payoff table for a duopoly. If initially firms X and Y are charging $5 and
$4, respectively,
A.
the two firms will be maximizing joint profits.
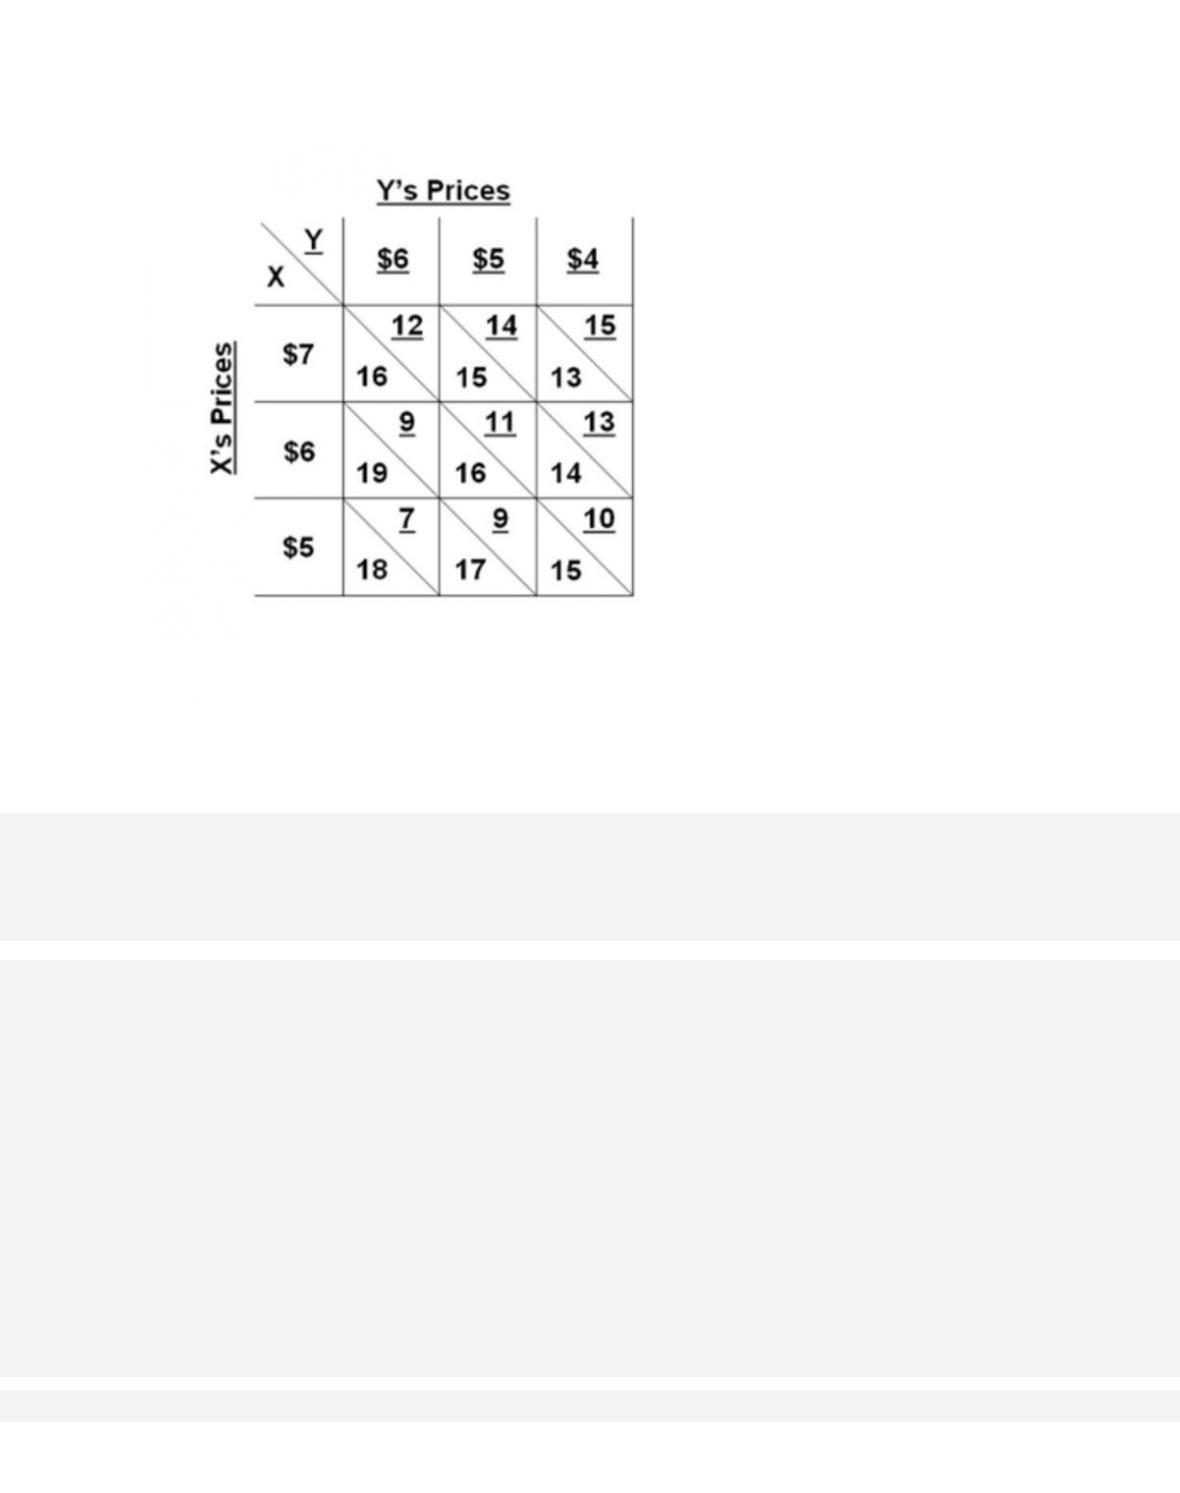
60.
Refer to the profits-payoff table for a duopoly. If initially firm X’s price was $6 and Y’s price
was $5,
A.
X would find it profitable to cut its price, provided Y also cut its price.
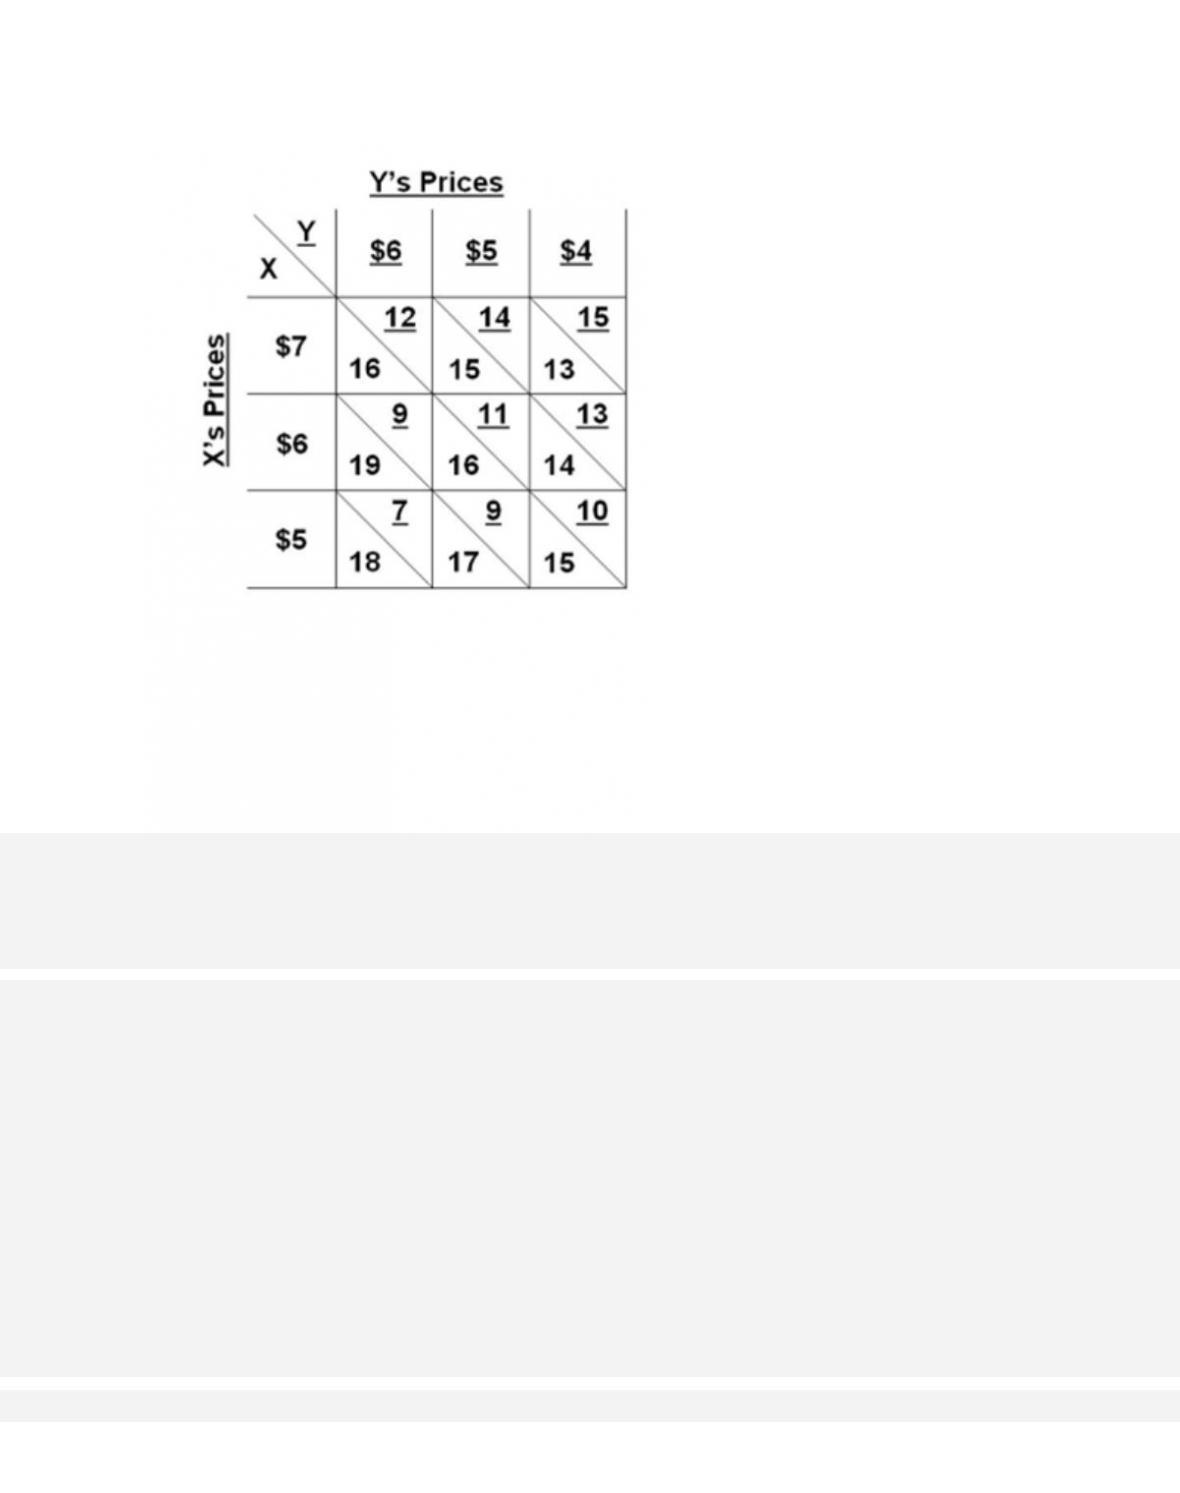
61.
Refer to the profits-payoff table for a duopoly. Which of the following statements is true about
Nash equilibrium in this game?
A.
A Nash equilibrium exists where X charges $7 and Y charges $5, because that is the cell
that maximizes the combined profits of the two firms.
62.
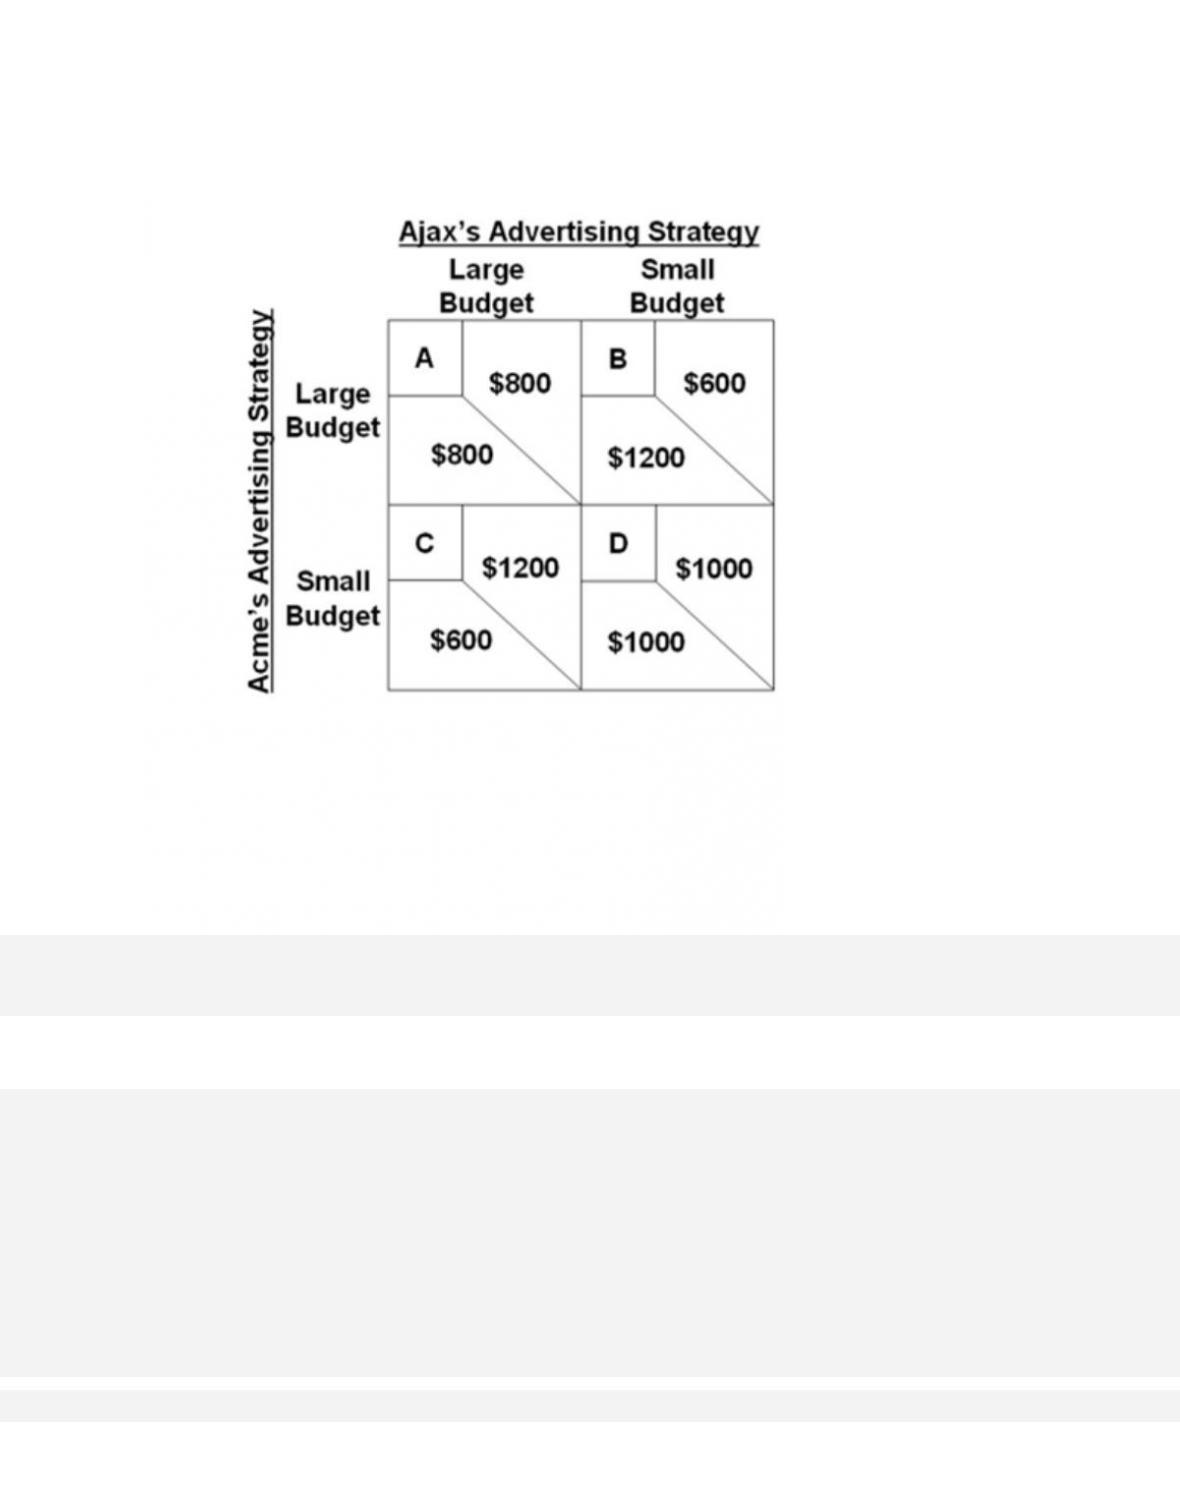
Refer to the game theory matrix, where the numerical data show the profits resulting from
alternative combinations of advertising strategies for Ajax and Acme. Ajax’s profits are
shown in the upper right part of each cell; Acme’s profits are shown in the lower left. Without
collusion, the outcome of the game is cell
D.
D.
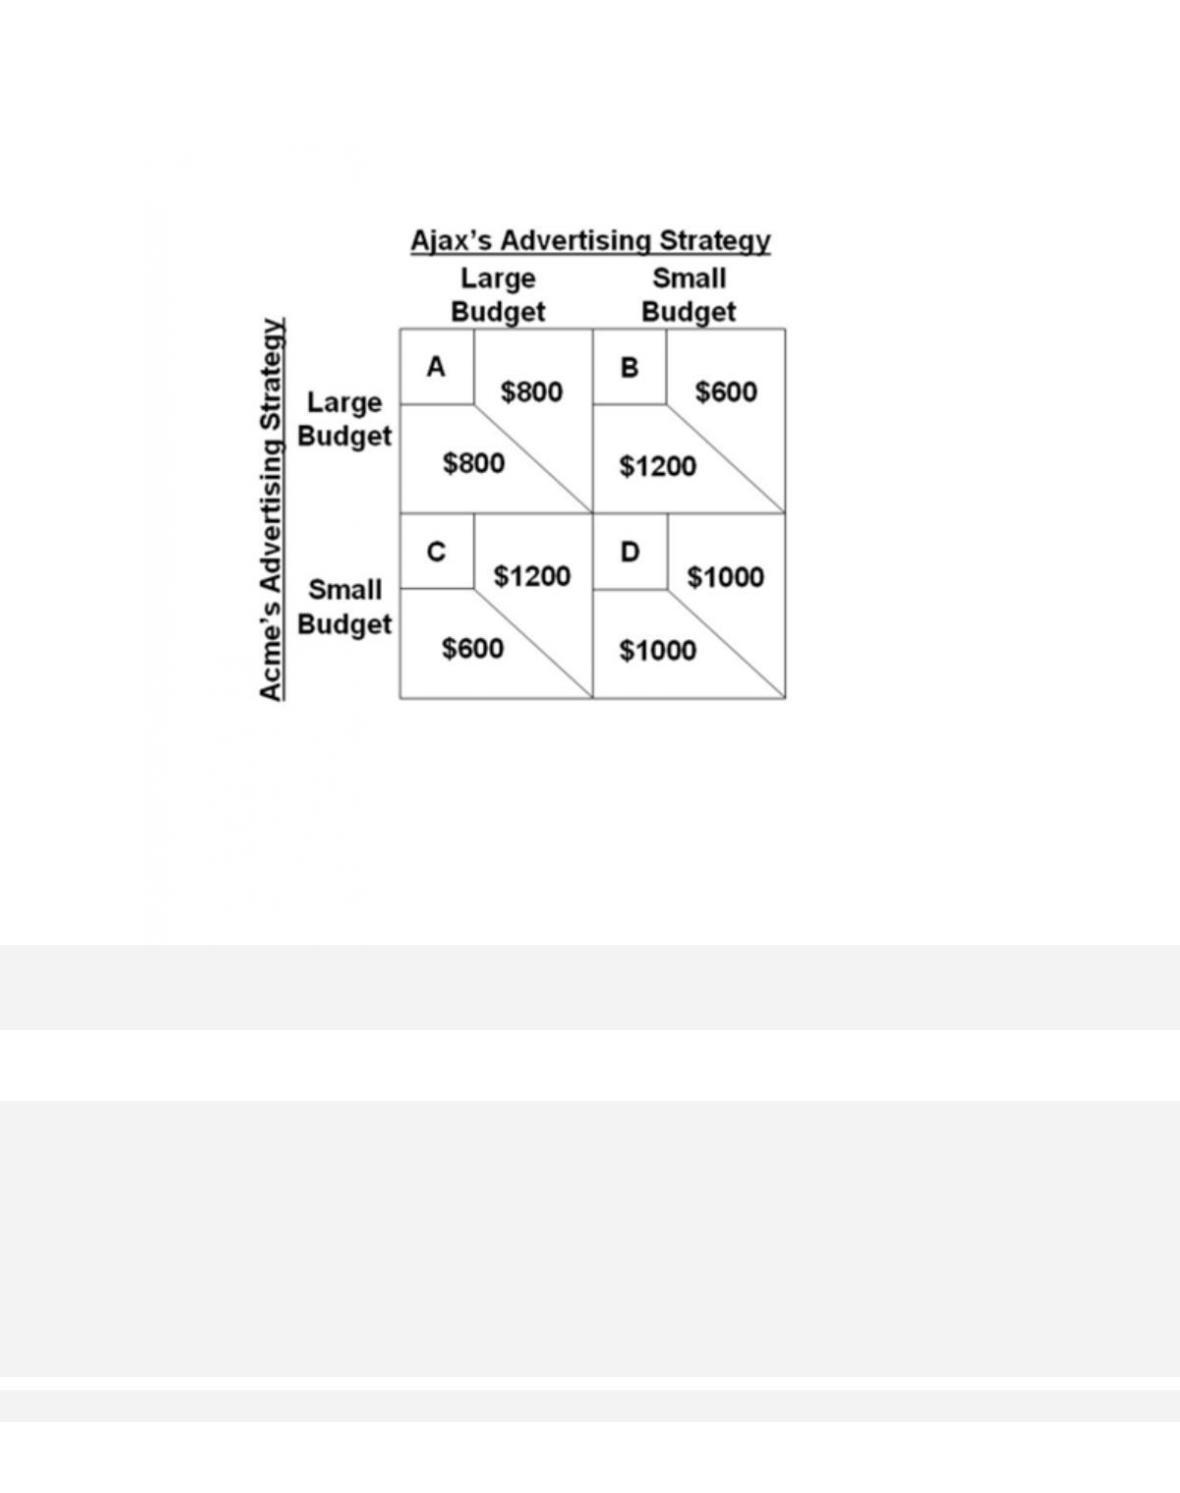
63.
Refer to the game theory matrix, where the numerical data show the profits resulting from
alternative combinations of advertising strategies for Ajax and Acme. Ajax’s profits are
shown in the upper right part of each cell; Acme’s profits are shown in the lower left. Without
collusion, Nash equilibrium is represented by which cell?
D.
There is no Nash equilibrium in this game.
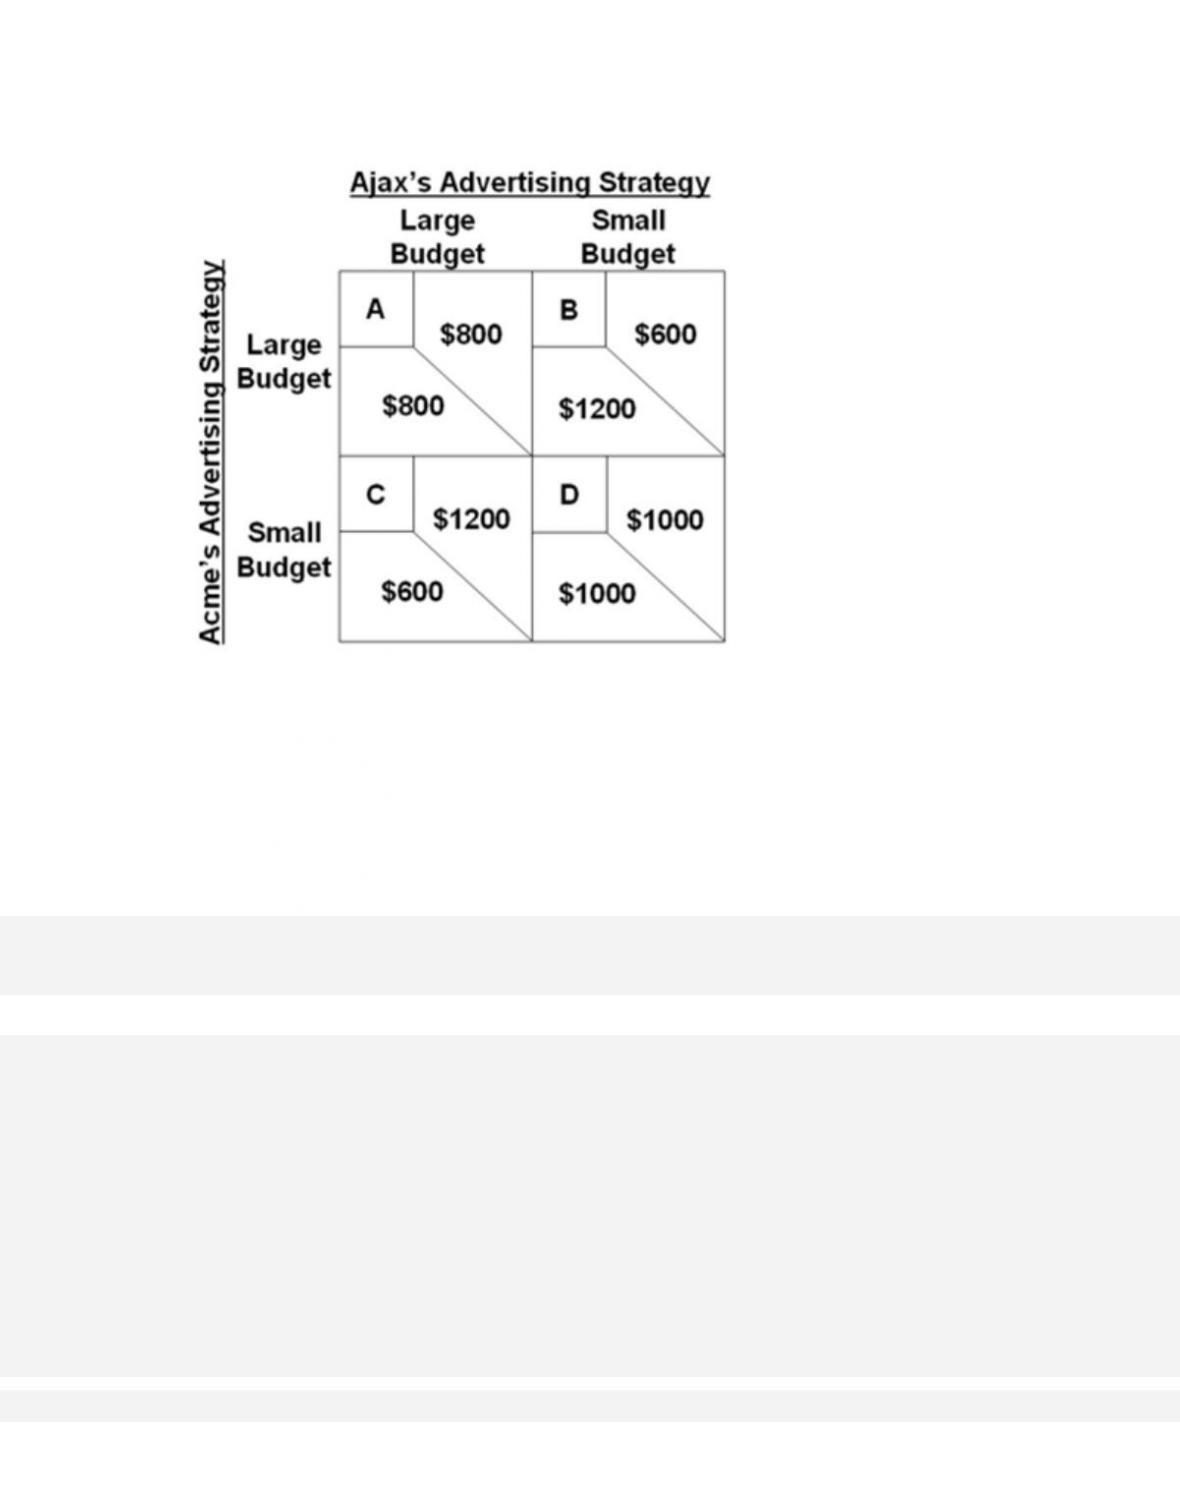
64.
Refer to the game theory matrix, where the numerical data show the profits resulting from
alternative combinations of advertising strategies for Ajax and Acme. Ajax’s profits are
shown in the upper right part of each cell; Acme’s profits are shown in the lower left. Without
collusion, the outcome of the game
A. maximizes joint profits for the firms.
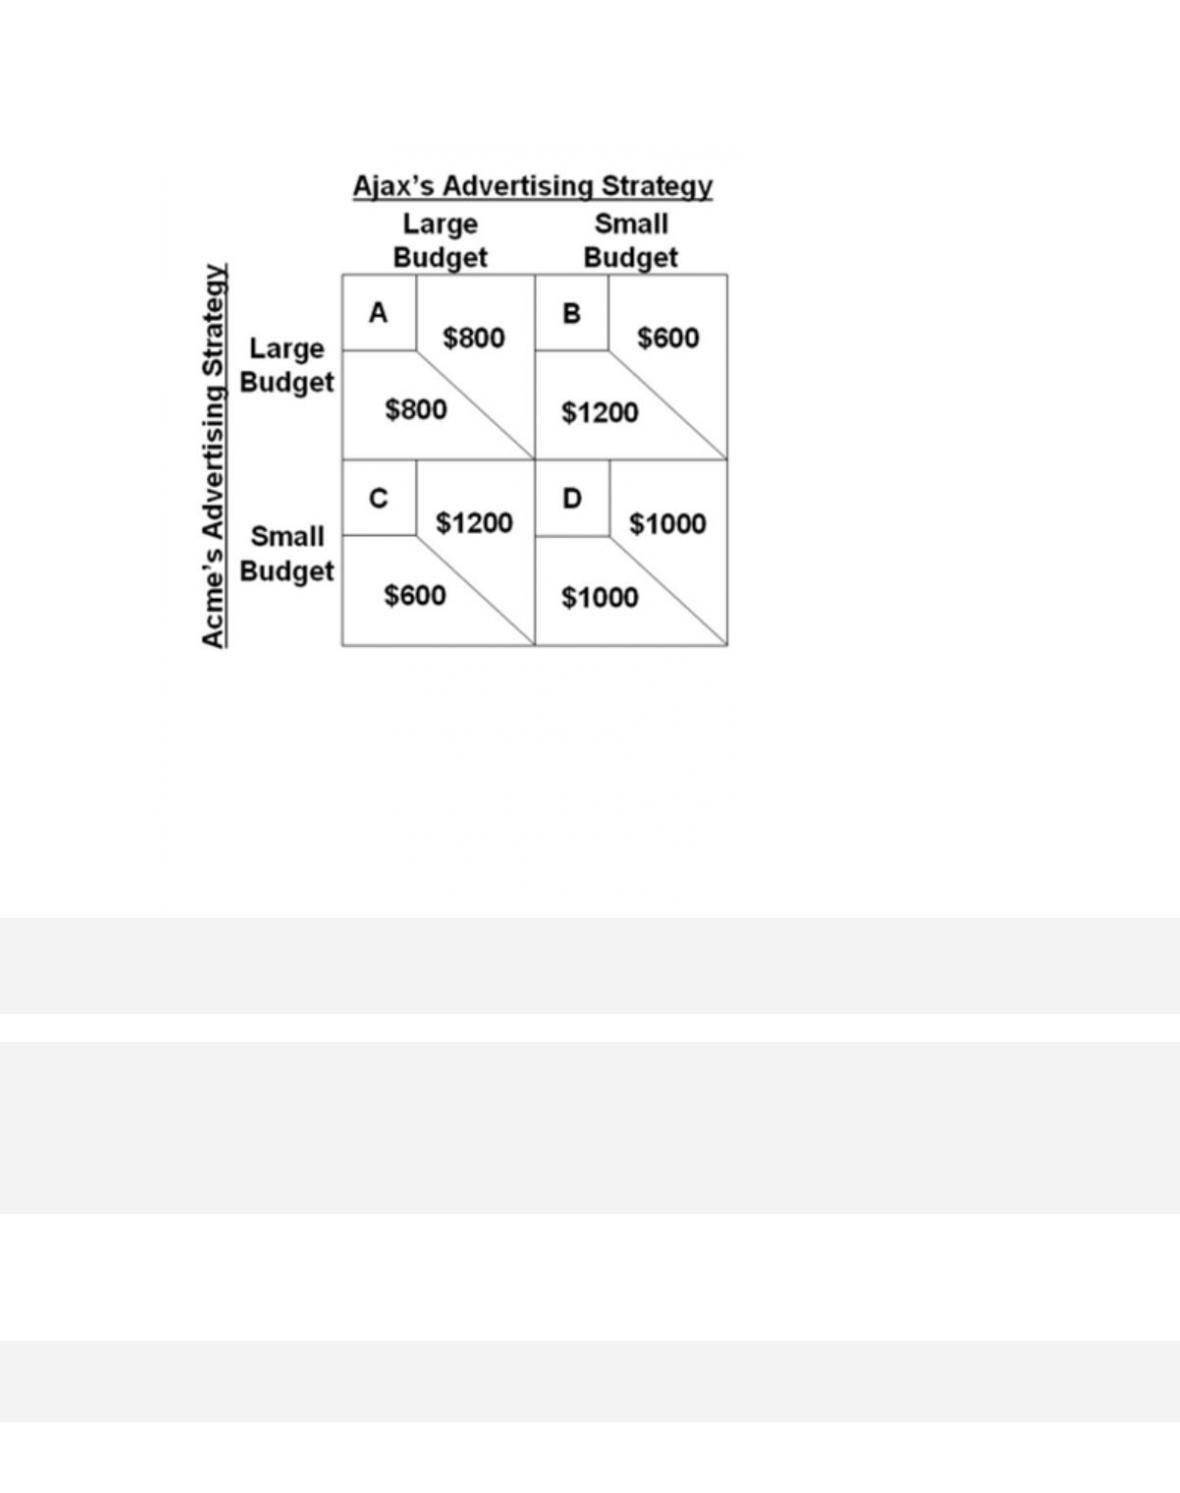
65.
Refer to the game theory matrix, where the numerical data show the profits resulting from
alternative combinations of advertising strategies for Ajax and Acme. Ajax’s profits are
shown in the upper right part of each cell; Acme’s profits are shown in the lower left. With
collusion and no cheating, the outcome of the game is cell
A.
A.
66.
Suppose an oligopolistic producer assumes its rivals will ignore a price increase but match
a price cut. In this case the firm perceives its

14–36
Copyright © 2018 McGraw-Hill Education. All rights reserved. No reproduction or distribution without the prior
written consent of McGraw-Hill Education.
B.
supply curve as kinked, being steeper below the going price than above.
C. demand curve as kinked, being steeper below the going price than above.
D. demand curve as kinked, being steeper above the going price than below.
AACSB: Knowledge Application
Ac c e s s i b i l i ty :
Keyboard Navigation
Blooms: Understand
Di f f i cu l t y :
02 Medium
Learning Objective: 14–03 Explain the three main models of oligopoly pricing and output:
kinked-demand theory, collusive pricing, and price leadership.
Test Bank: I
Topic:
Three Oligopoly Models
67.
The kinked-demand curve of an oligopolist is based on the assumption that
D.
there is no product differentiation.
68.
If an oligopoly is faced with a kinked-demand curve that is relatively elastic above, and
relatively inelastic below, the going price, then it will
A. increase total revenue by increasing price but lower total revenue by decreasing price.
14–37
Copyright © 2018 McGraw-Hill Education. All rights reserved. No reproduction or distribution without the prior
written consent of McGraw-Hill Education.
Topic:
Three Oligopoly Models
69.
The kinked-demand curve model of oligopoly is useful in explaining
A.
the way that collusion works.
70.
The kinked-demand curve model helps to explain price rigidity because
D.
the associated marginal revenue curve is perfectly elastic at the going price.
71.
If competing oligopolists completely ignore oligopolist X’s price changes, then X’s
A. demand curve will be less elastic than if the other oligopolists matched X’s price changes.

14–38
Copyright © 2018 McGraw-Hill Education. All rights reserved. No reproduction or distribution without the prior
written consent of McGraw-Hill Education.
Blooms: Understand
Di f f i cu l t y :
02 Medium
Learning Objective: 14–03 Explain the three main models of oligopoly pricing and output:
kinked-demand theory, collusive pricing, and price leadership.
Test Bank: I
Topic:
Three Oligopoly Models
72.
If an oligopolist is faced with a marginal revenue curve that has a gap in it, we may assume
that
A. it is colluding with its rivals to maximize joint profits.
73.
The kinked-demand curve model of oligopoly
A. assumes a firm’s rivals will ignore a price cut but match a price increase.
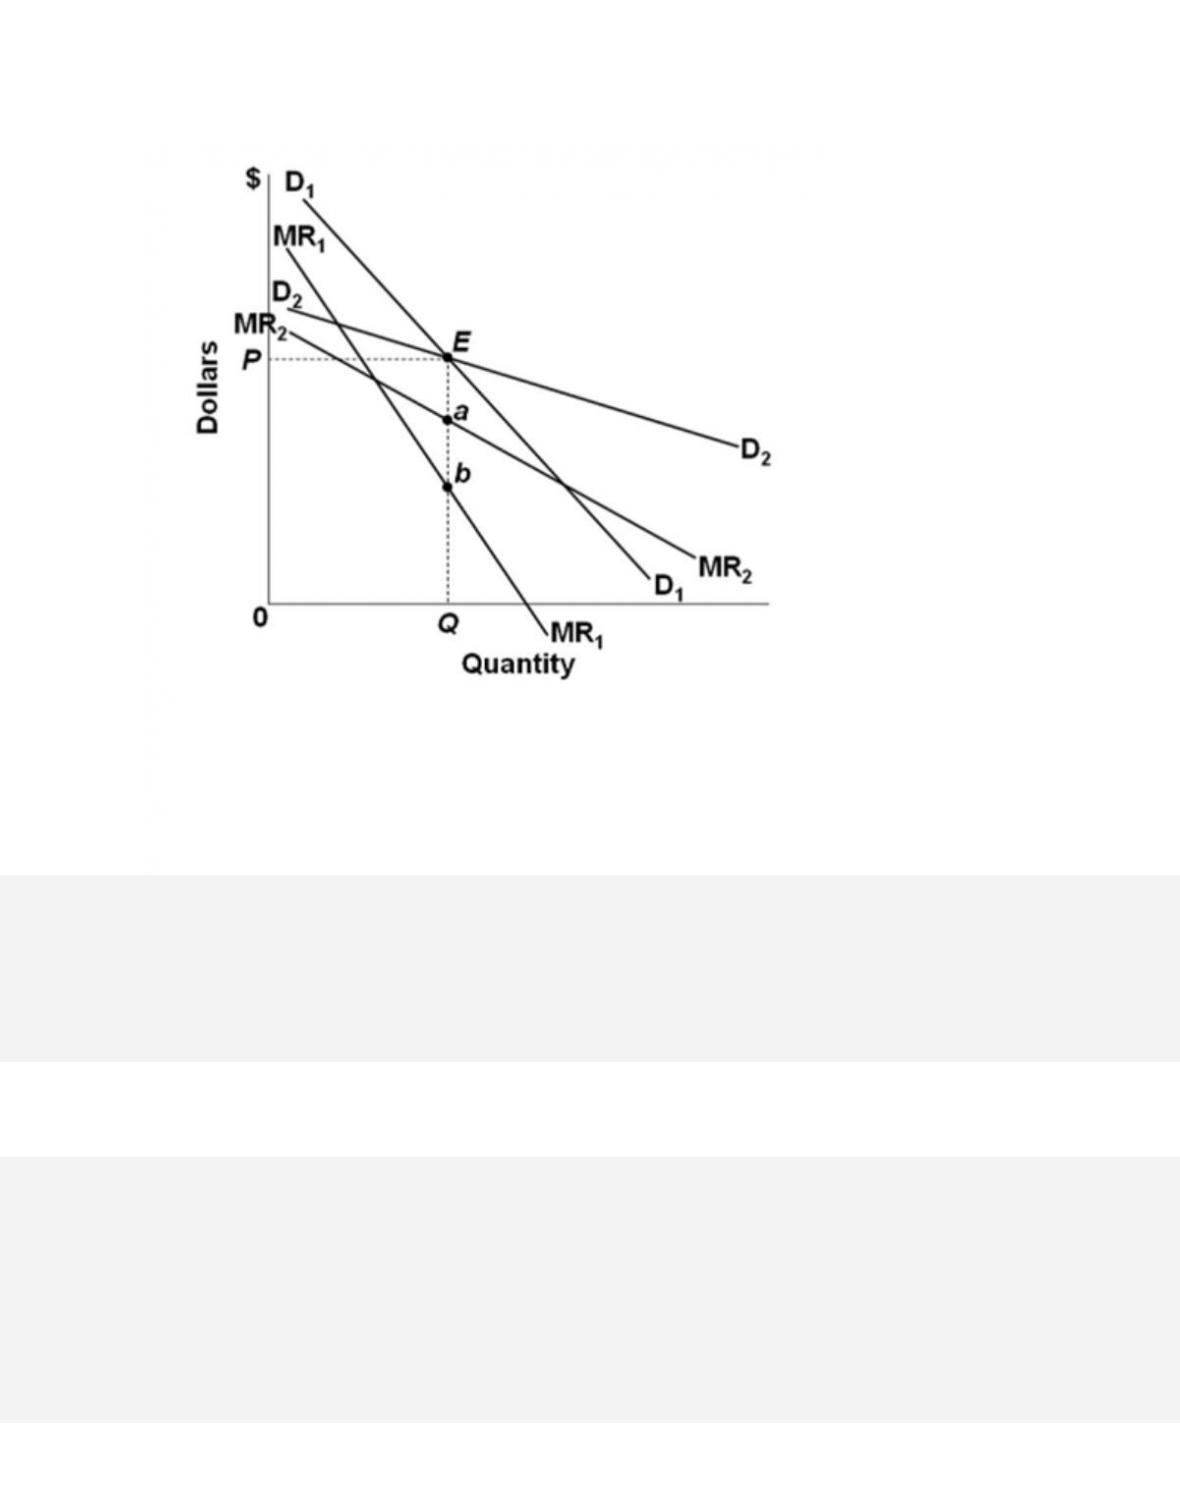
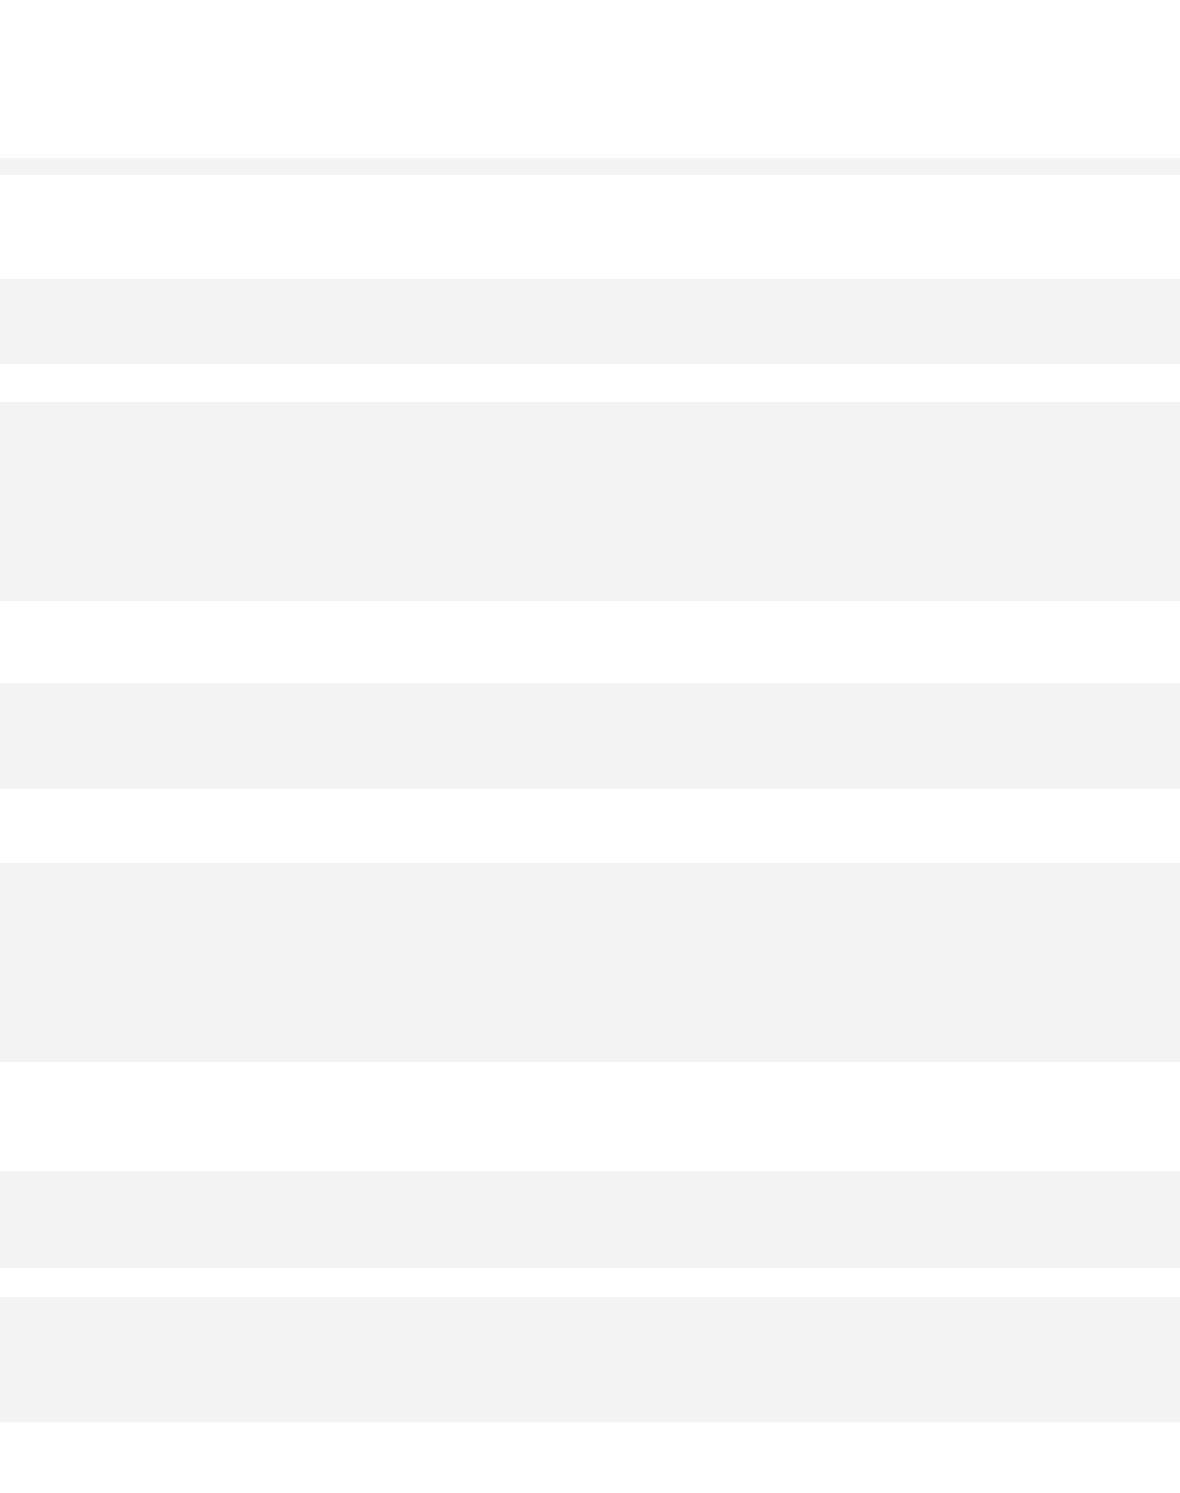
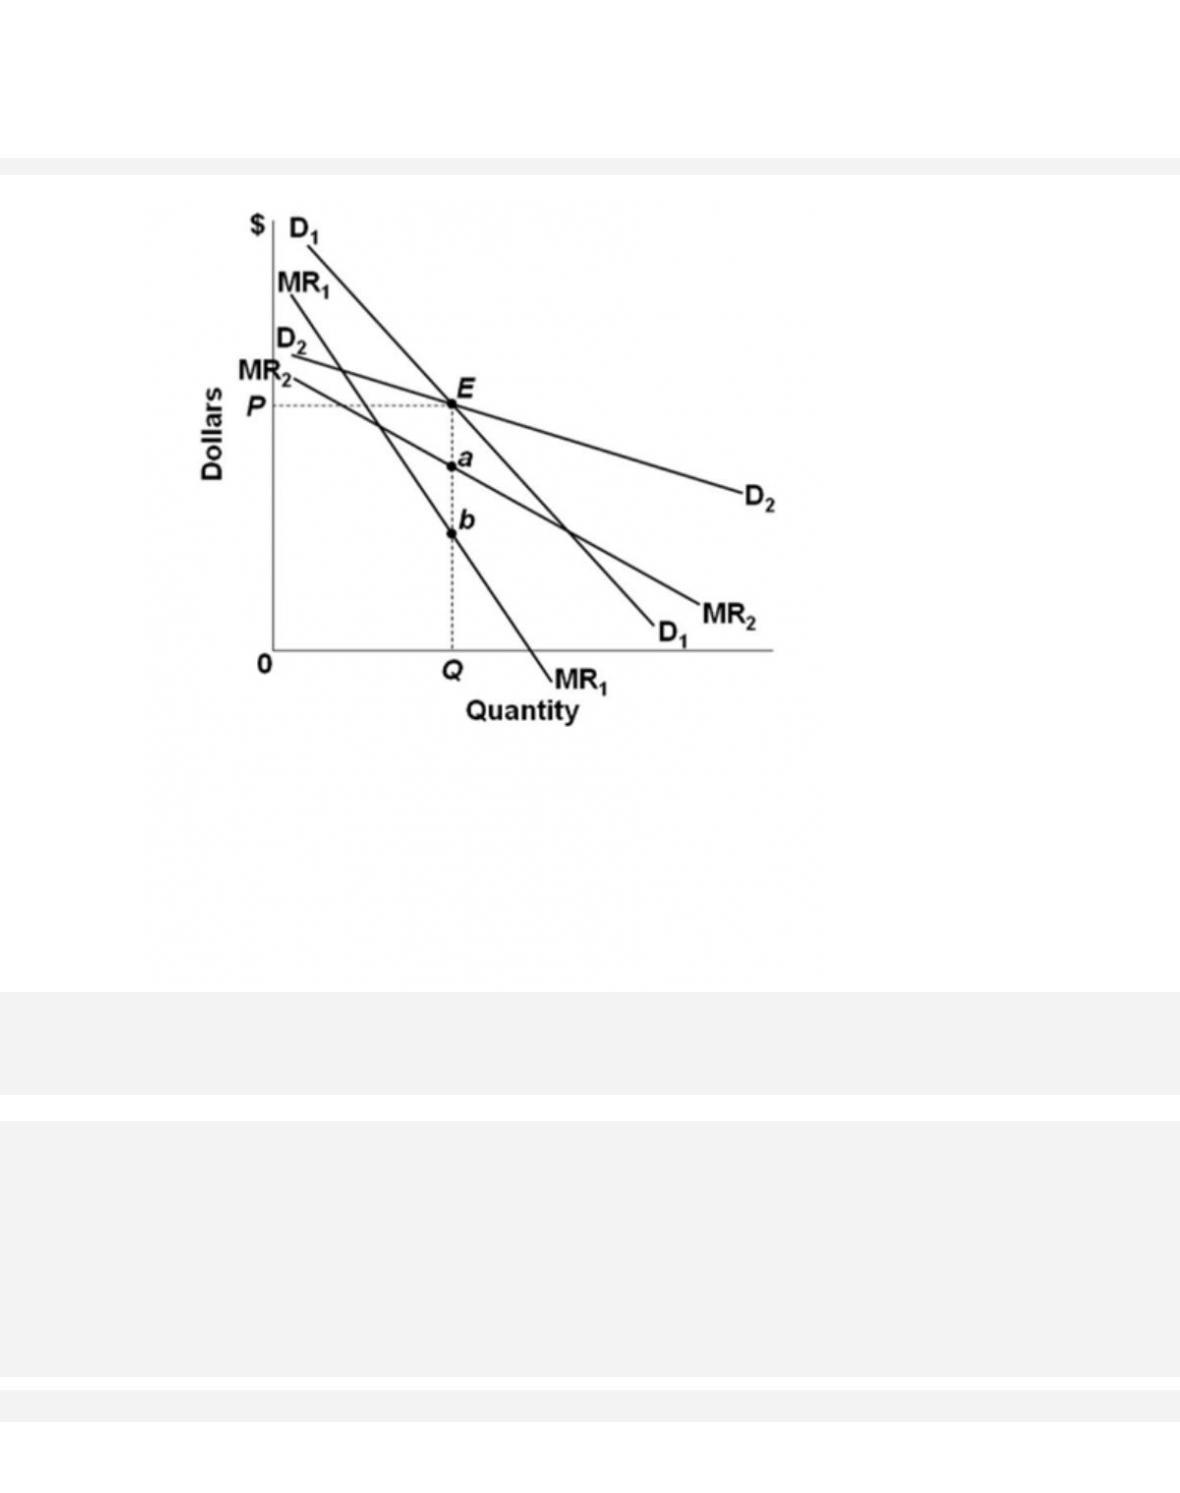
74.
Refer to the diagram for a non collusive oligopolist. Suppose that the firm is initially in
equilibrium at point E, where the equilibrium price and quantity are P and Q. Which of the
following statements is correct?
D.
Demand curve D2 assumes that rivals will match any price change initiated by this
oligopolist.
14–40
Copyright © 2018 McGraw-Hill Education. All rights reserved. No reproduction or distribution without the prior
written consent of McGraw-Hill Education.
Type: Graph
75.
Refer to the diagram for a non collusive oligopolist. Suppose that the firm is initially in
equilibrium at point E, where the equilibrium price and quantity are P and Q. If the firm’s
rivals will ignore any price increase but match any price reduction, then the firm‘s demand
curve will be (moving from left to right)
A. D1ED2.