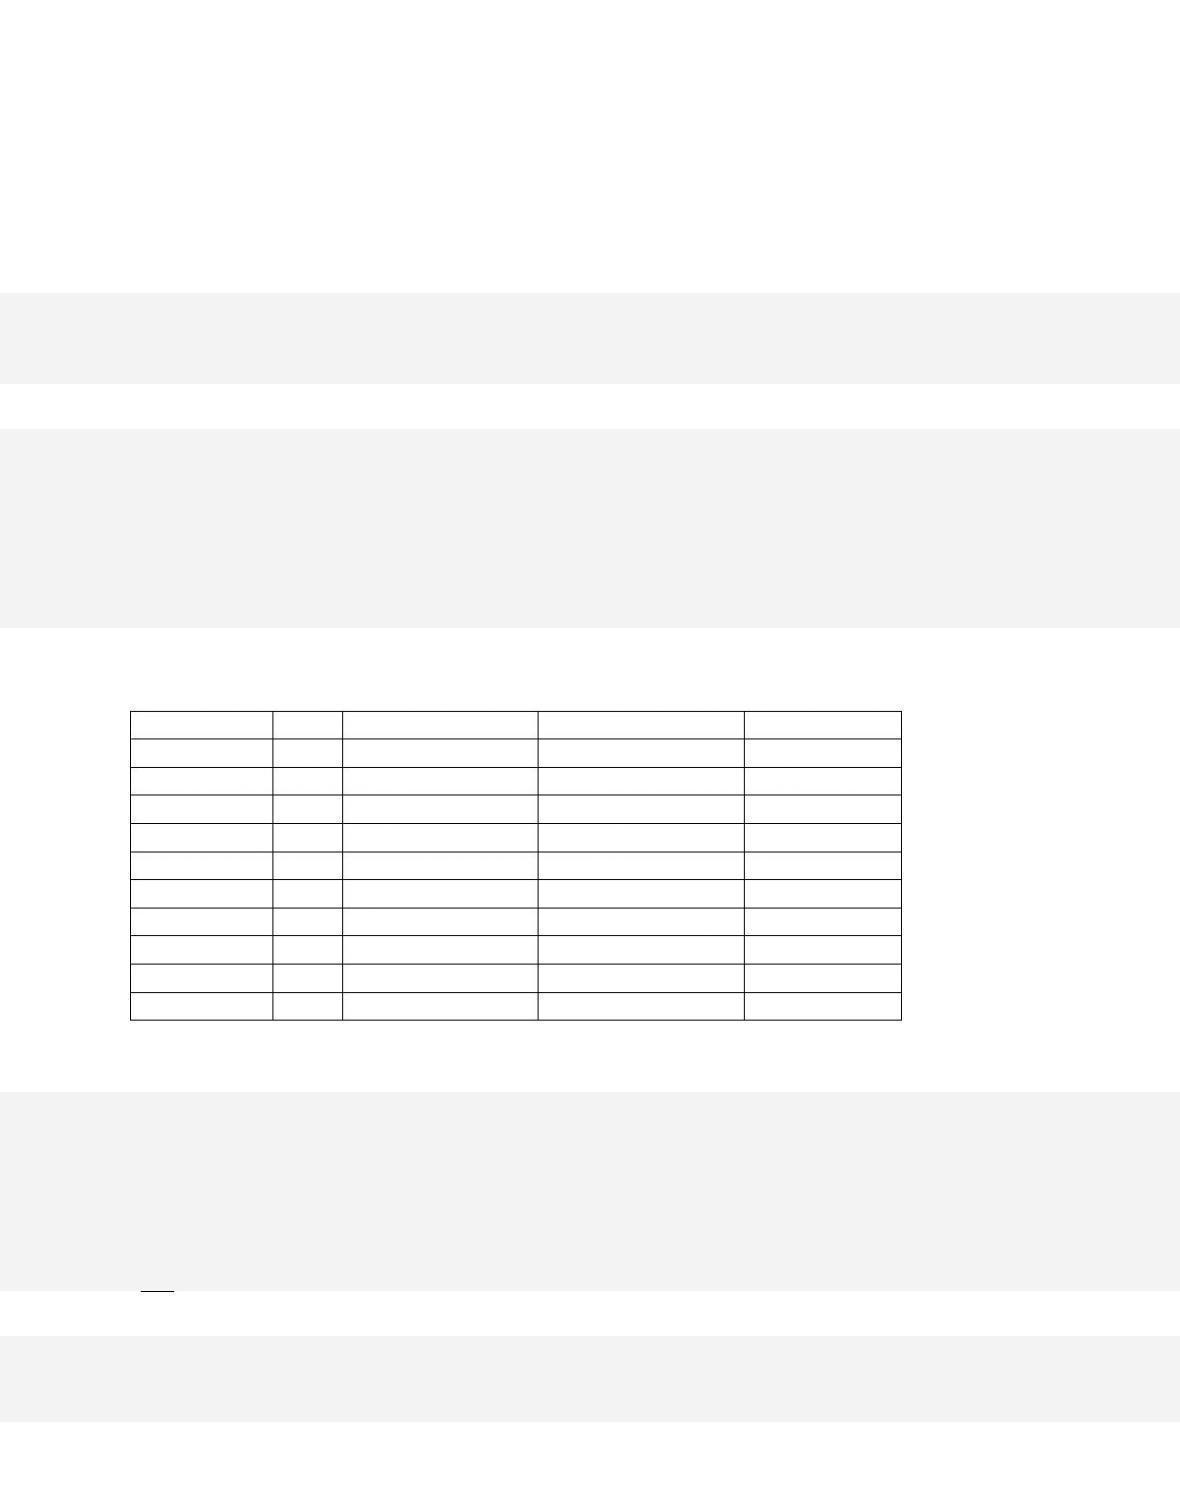
Refer to the data for a nondiscriminating monopolist. At its profit–maximizing output, this
firm’s total costs will be
74.
Total Output
Price
Marginal Revenue
Average Total Cost
Marginal Cost
1
$100
$100
$100.00
$30
2
90
80
63.00
26
3
80
60
52.67
32
4
70
40
49.50
40
5
60
20
49.60
50
6
50
0
50.00
52
7
40
-20
52.29
66
8
30
-40
55.75
80
9
20
-60
60.67
100
10
10
-80
67.60
130
12–42
Copyright © 2018 McGraw-Hill Education. All rights reserved. No reproduction or distribution without the prior
written consent of McGraw-Hill Education.
Blooms: Understand
D iffi c ul t y : 02 Medium
Learning Objective: 12–04 Explain how a pure monopoly sets its profit-maximizing output and
price.
Test Bank: I
To p i c : Output and Price Determination
Type: Table
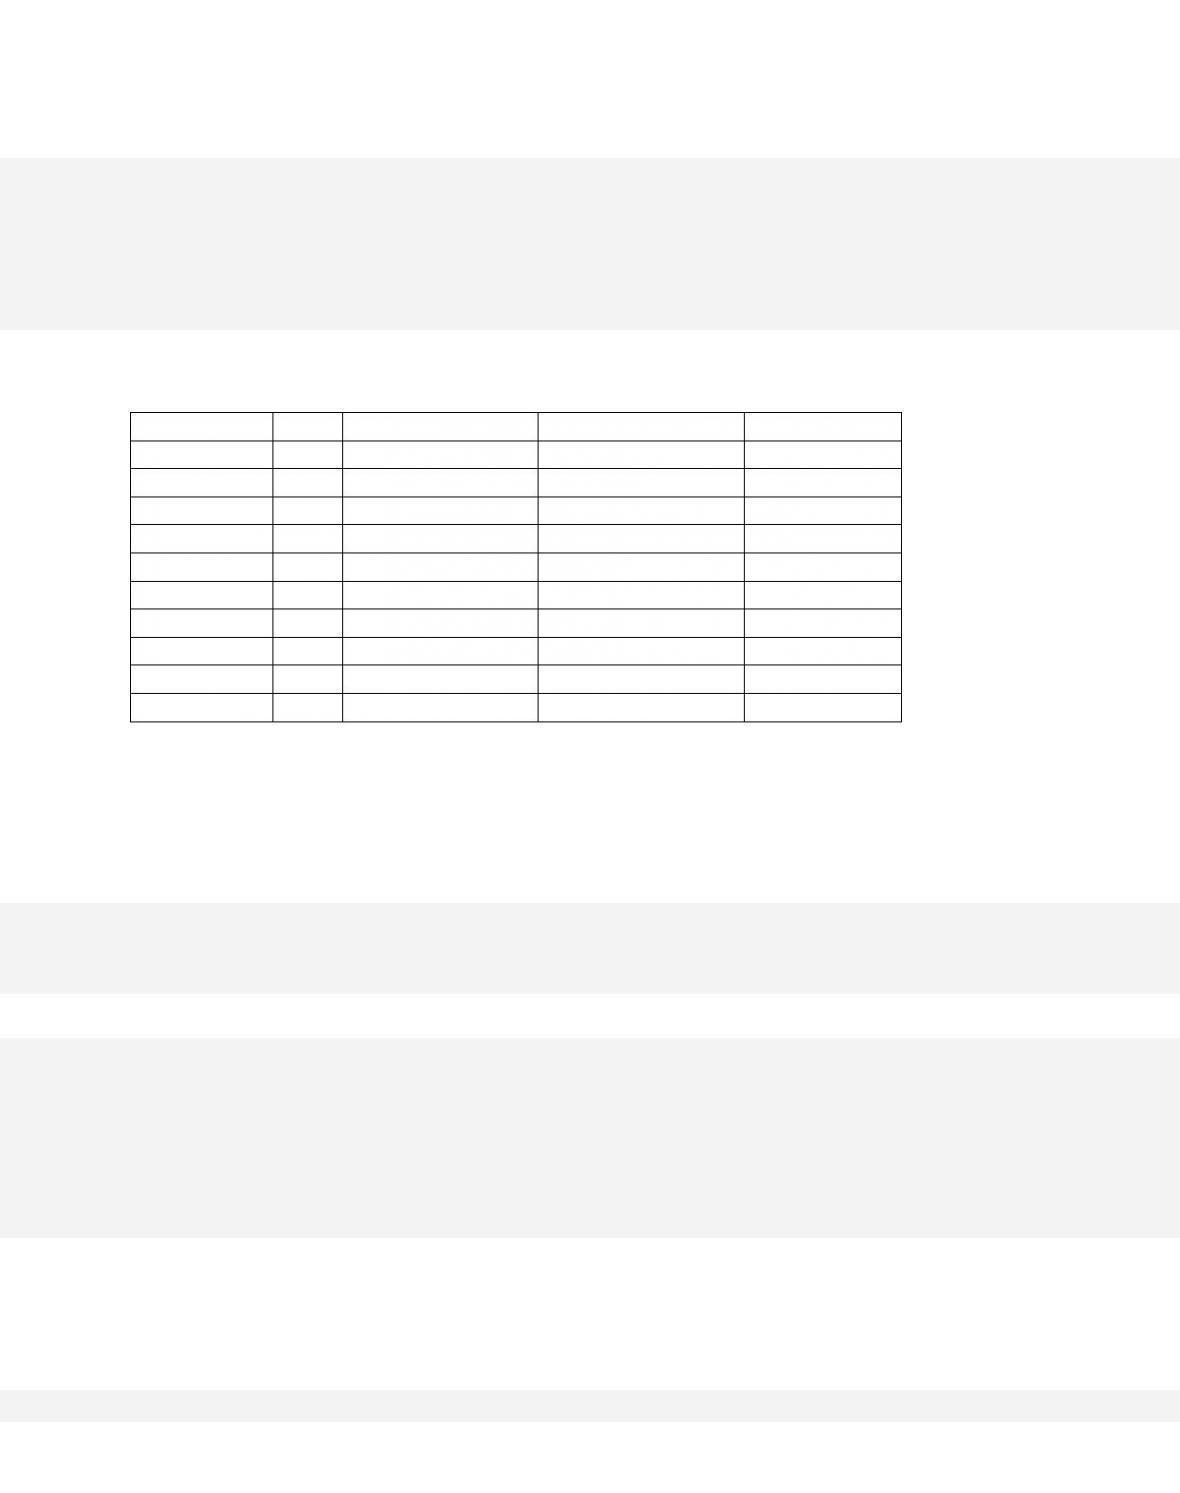
75.
Total Output
Price
Marginal Revenue
Average Total Cost
Marginal Cost
1
$100
$100
$100.00
$30
2
90
80
63.00
26
3
80
60
52.67
32
4
70
40
49.50
40
5
60
20
49.60
50
6
50
0
50.00
52
7
40
-20
52.29
66
8
30
-40
55.75
80
9
20
-60
60.67
100
10
10
-80
67.60
130
Refer to the data for a nondiscriminating monopolist. At its profit–maximizing output, this
firm’s total profit will be
A.
$82.
B.
zero.
C.
$54.
D.
$27.
76.
A pure monopolist is producing an output such that ATC = $4, P = $5, MC = $2, and MR
= $3. This firm is realizing
12–43
Copyright © 2018 McGraw-Hill Education. All rights reserved. No reproduction or distribution without the prior
written consent of McGraw-Hill Education.
A.
a loss that could be reduced by producing more output.
B.
a loss that could be reduced by producing less output.
C.
an economic profit that could be increased by producing more output.
D. an economic profit that could be increased by producing less output.
77.
If a monopolist‘s marginal revenue is $3.00 and its marginal cost is $4.50, it will increase
its profits by
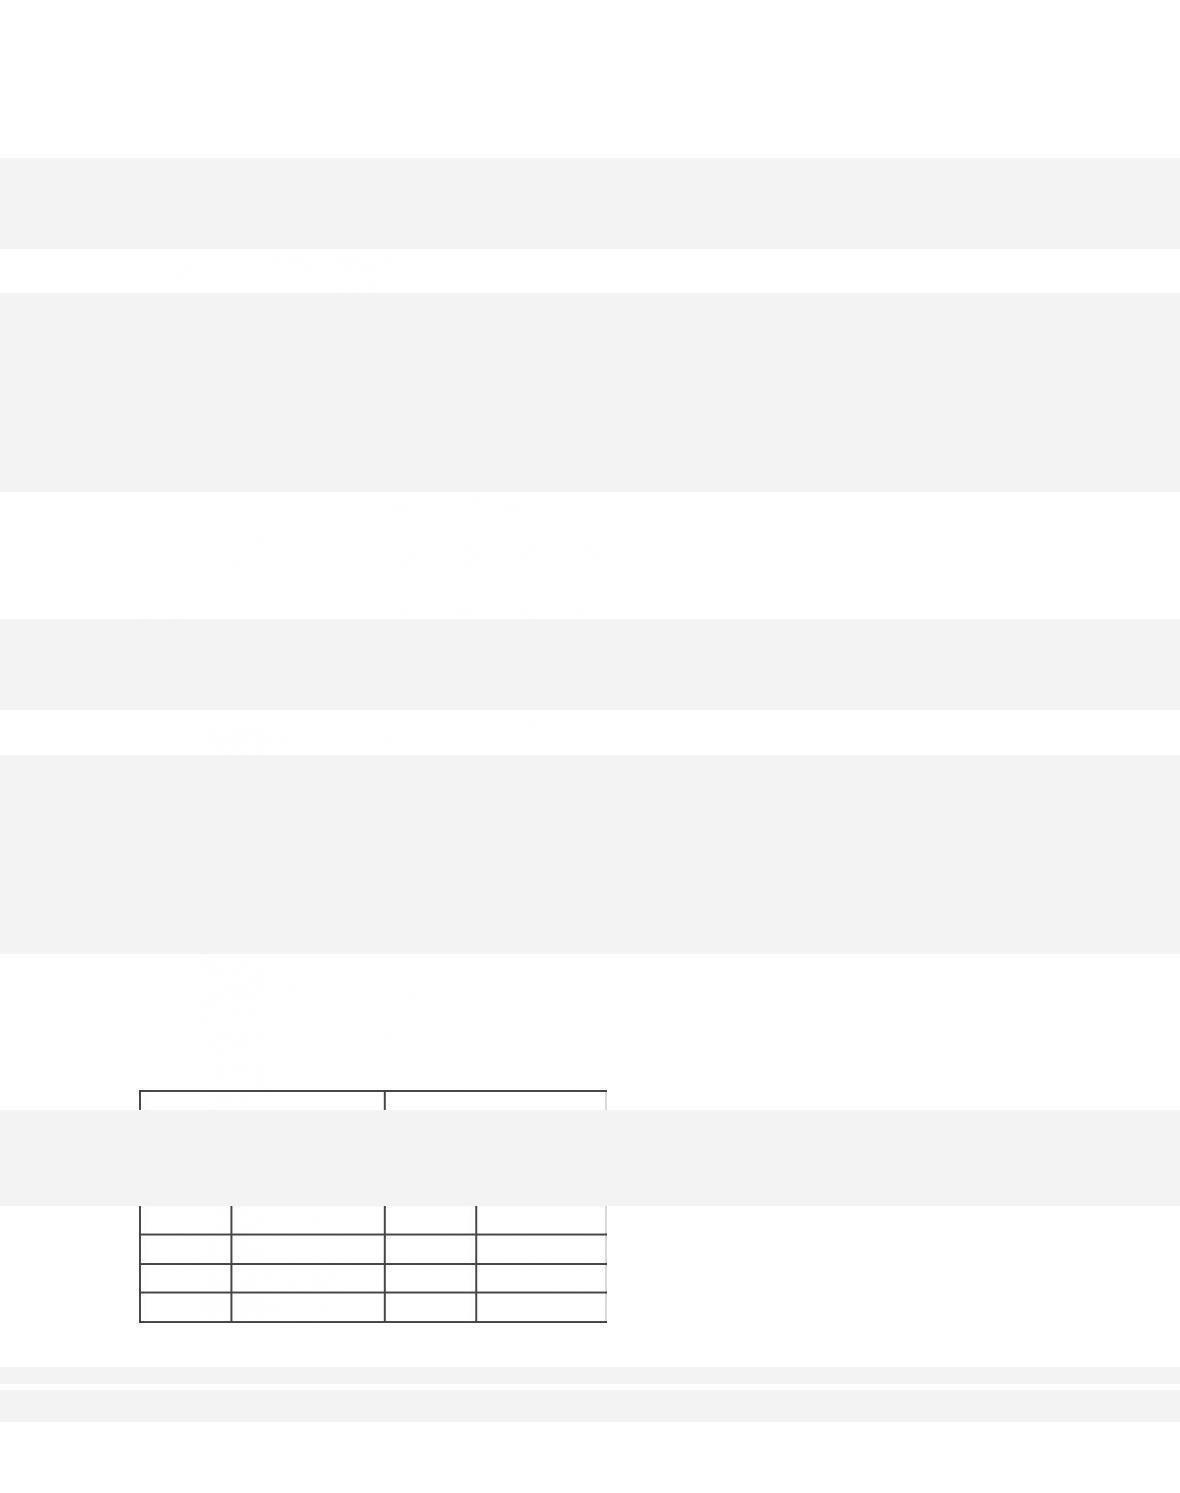
78.
Answer the question on the basis of the provided demand and cost data for a pure
monopolist.
Demand Data
Cost Data
Price
Quantity
Demanded
Output
Total Cost
$5.50
3
3
$5.00
5.00
4
4
6.00
4.50
5
5
6.50
3.85
6
6
7.50
3.35
7
7
9.00
2.90
8
8
11.00
2.50
9
9
14.00
The profit–maximizing price for the monopolist will be
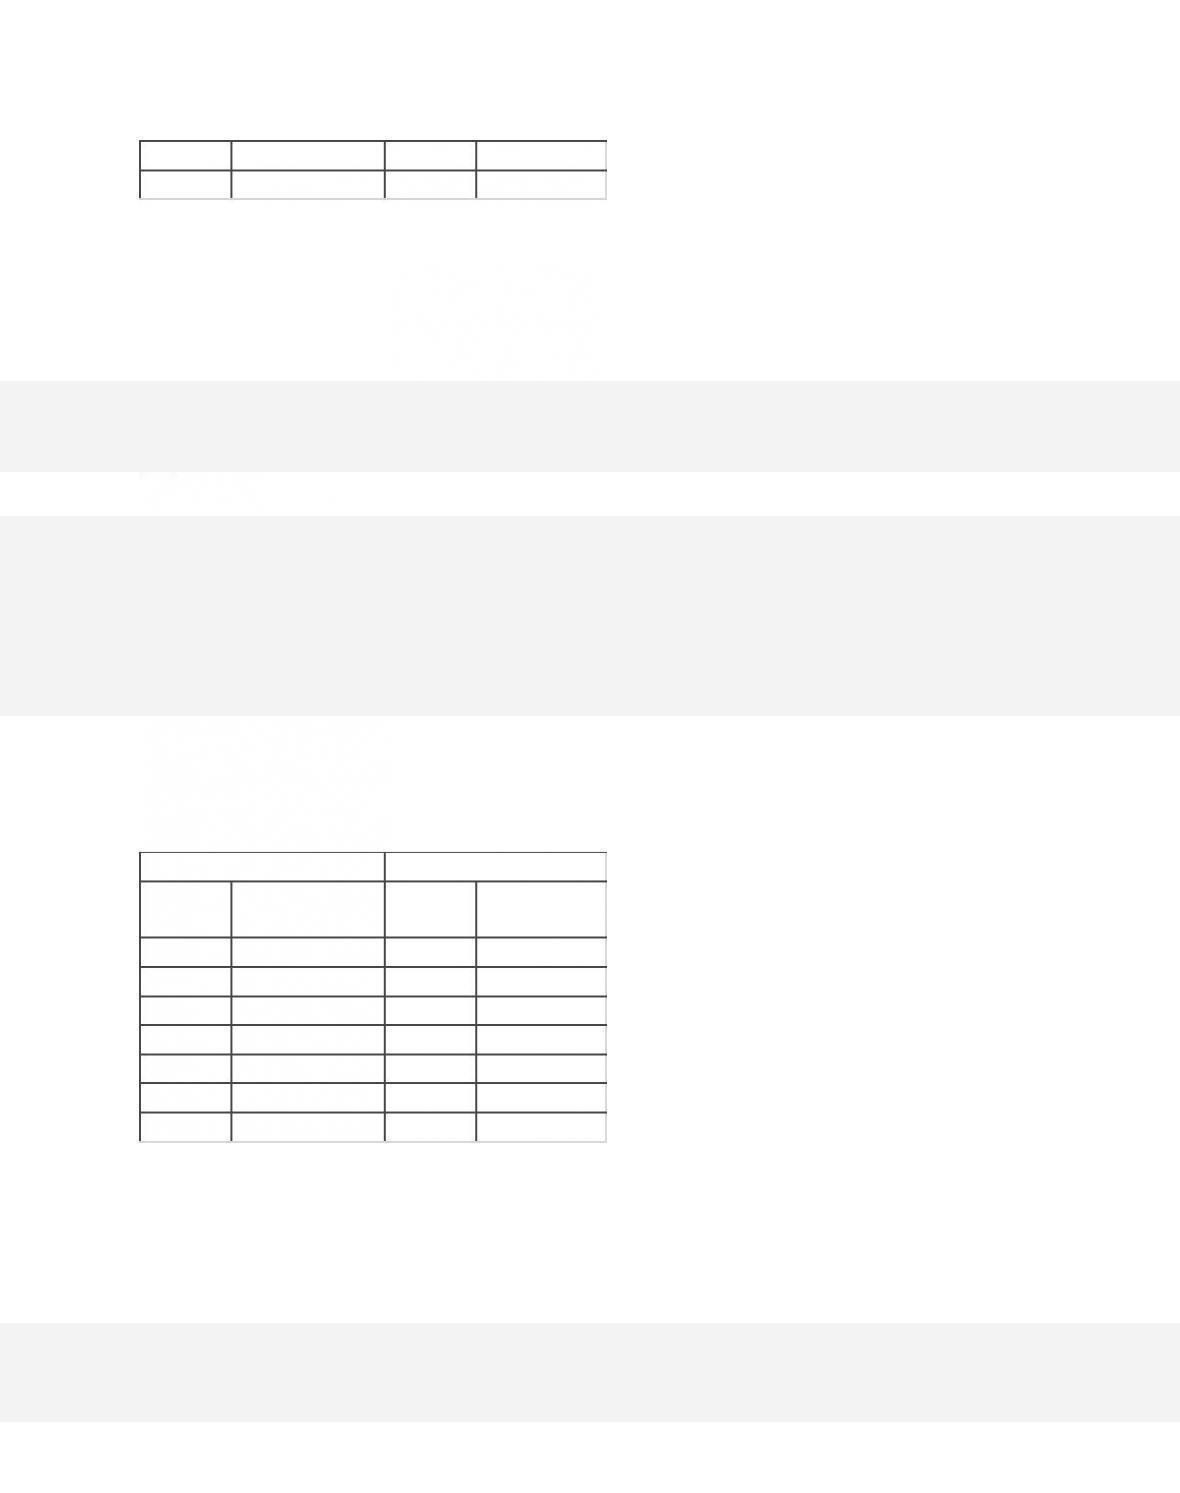
79.
Answer the question on the basis of the provided demand and cost data for a pure
monopolist.
Demand Data
Cost Data
Price
Quantity
Demanded
Output
Total Cost
$5.50
3
3
$5.00
5.00
4
4
6.00
4.50
5
5
6.50
3.85
6
6
7.50
3.35
7
7
9.00
2.90
8
8
11.00
2.50
9
9
14.00
The profit-maximizing level of output will be
12–45
Copyright © 2018 McGraw-Hill Education. All rights reserved. No reproduction or distribution without the prior
written consent of McGraw-Hill Education.
B.
7 units.
C.
6 units.
D.
5 units.
80.
Answer the question on the basis of the provided demand and cost data for a pure
monopolist.
Demand Data
Cost Data
Price
Quantity
Demanded
Output
Total Cost
$5.50
3
3
$5.00
5.00
4
4
6.00
4.50
5
5
6.50
3.85
6
6
7.50
3.35
7
7
9.00
2.90
8
8
11.00
2.50
9
9
14.00
The profit-maximizing monopolist will realize a
12–46
Copyright © 2018 McGraw-Hill Education. All rights reserved. No reproduction or distribution without the prior
written consent of McGraw-Hill Education.
Test Bank: I
To p i c : Output and Price Determination
Type: Table
81.
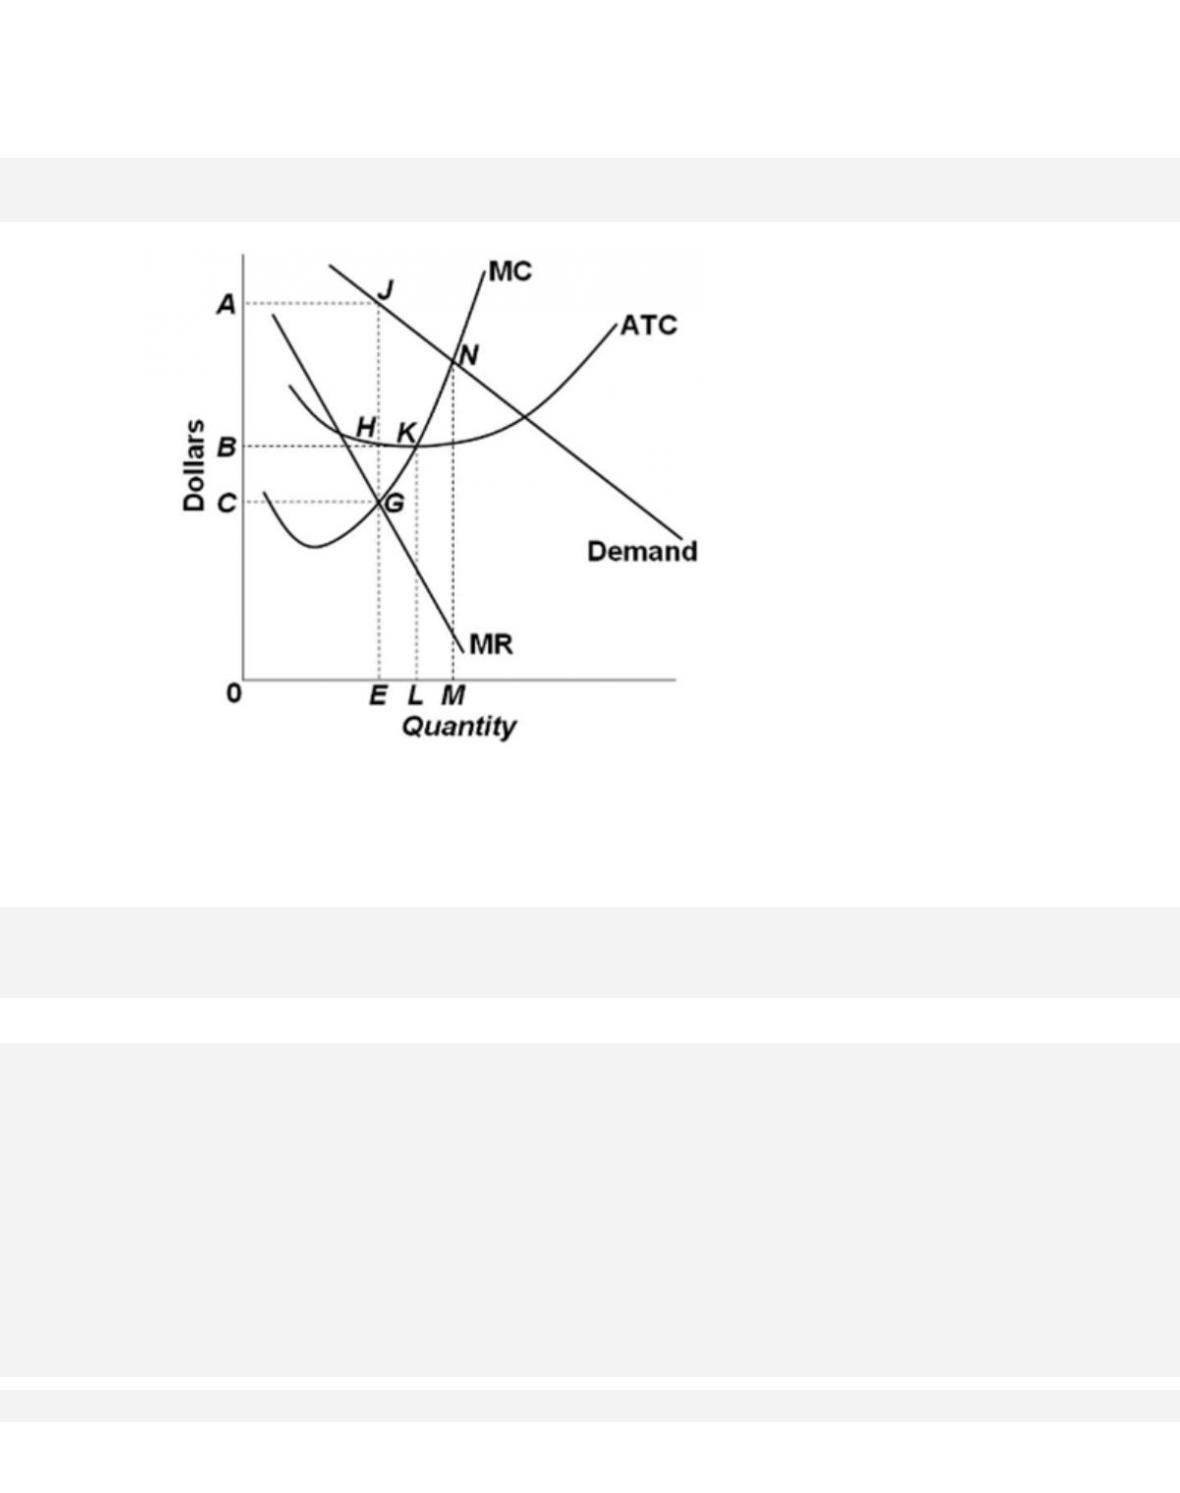
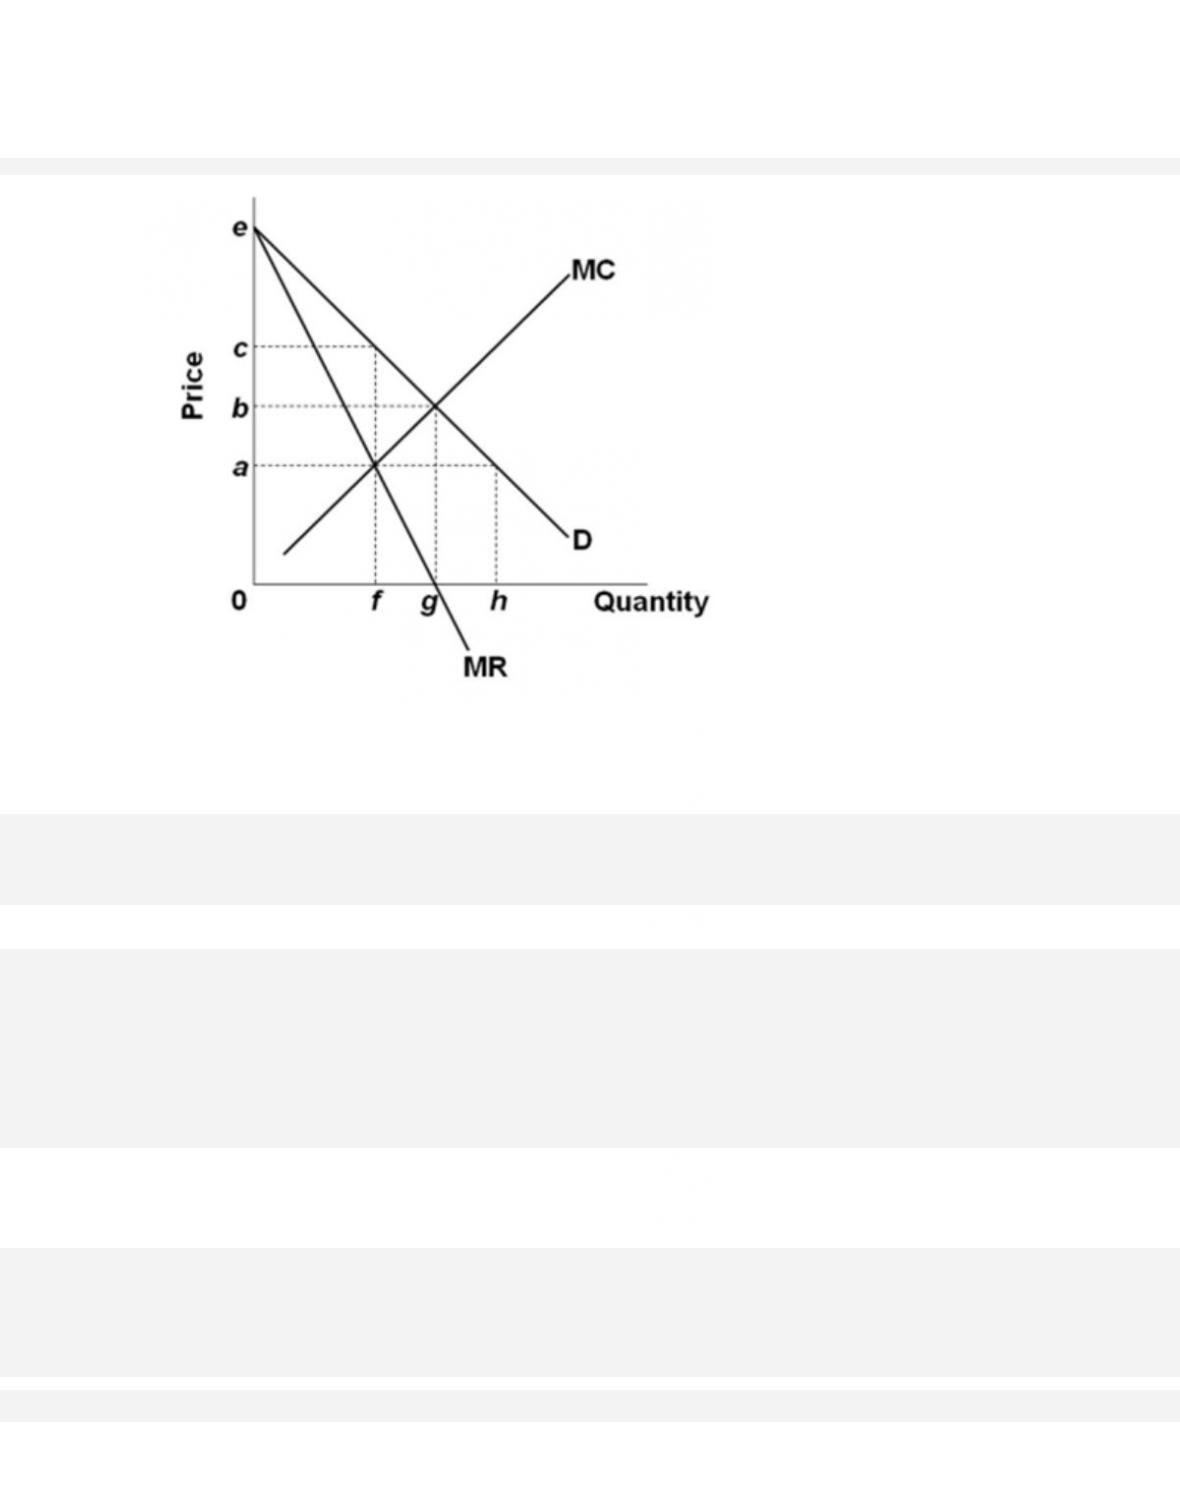
Refer to the diagram. To maximize profits or minimize losses, this firm should produce
82.
Refer to the diagram. At the profit-maximizing level of output, total revenue will be
83.
Refer to the diagram. At the profit–maximizing level of output, total cost will be
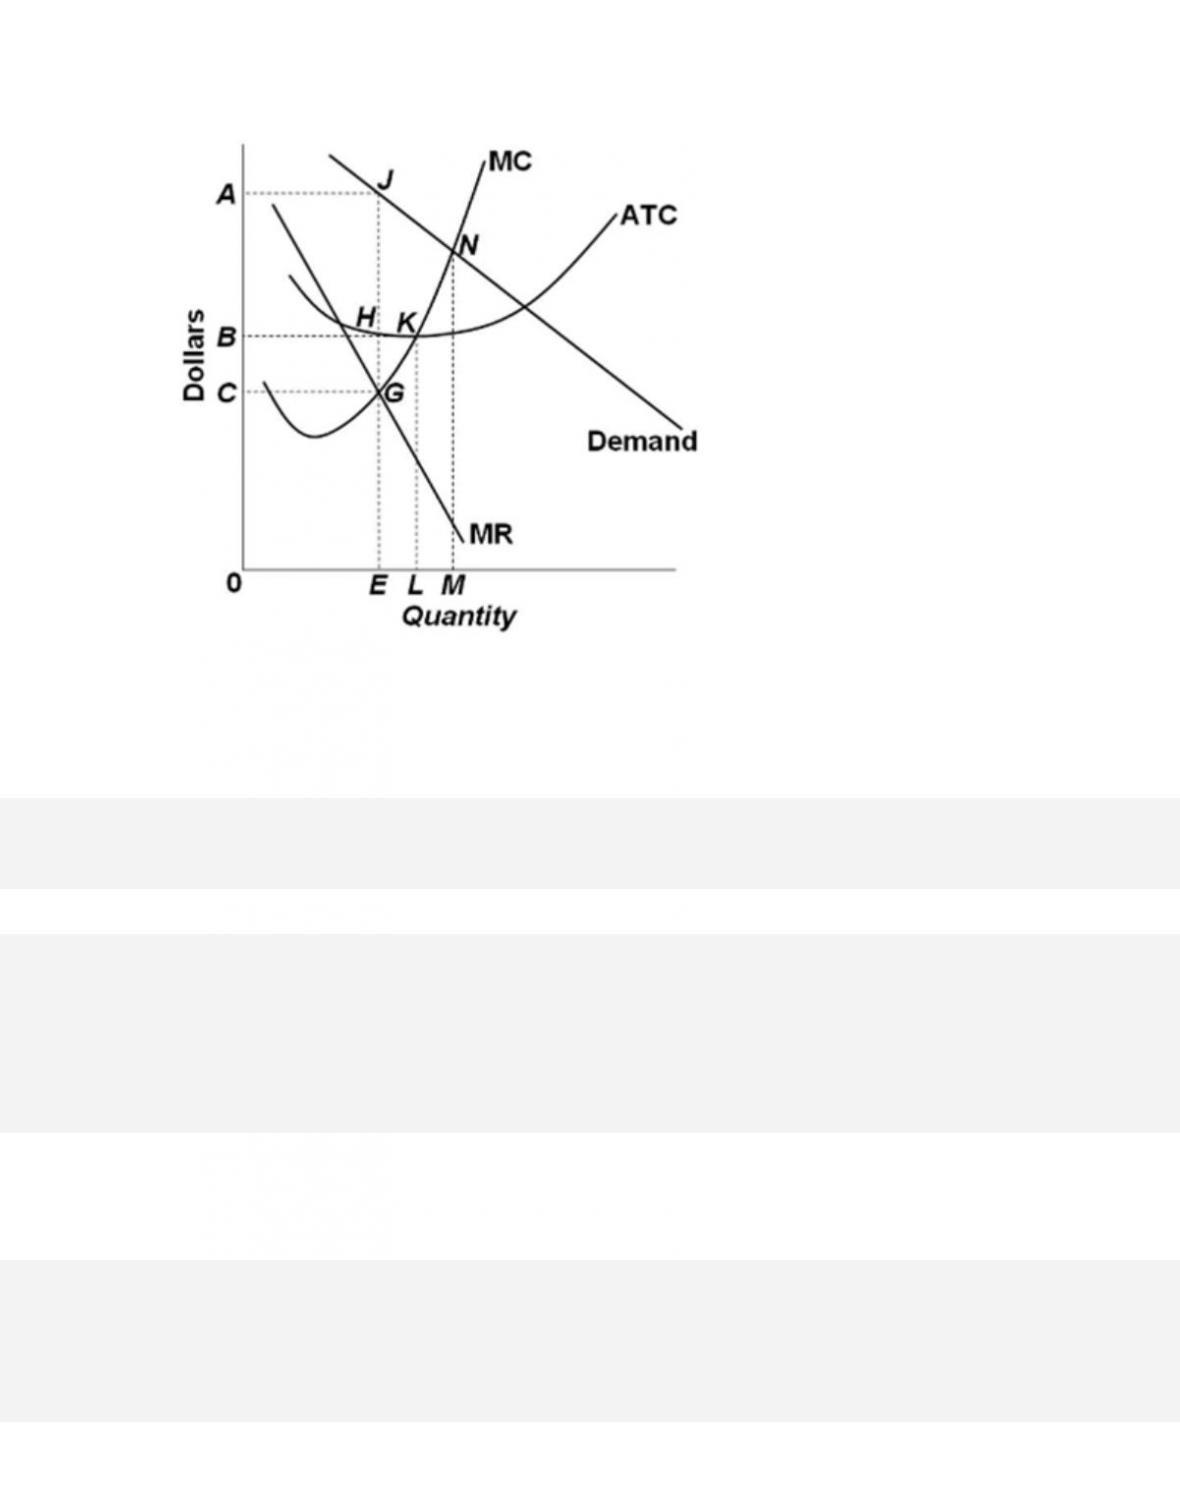
84.
Refer to the diagram. At the profit-maximizing level of output, the firm will realize
85.
If profits are maximized (or losses minimized), which of the following conditions is
common to both unregulated monopoly and pure competition?
12–50
Copyright © 2018 McGraw-Hill Education. All rights reserved. No reproduction or distribution without the prior
written consent of McGraw-Hill Education.
D. P = MR
86.
A pure monopolist
87.
If a pure monopolist is producing at that output where P = ATC, then
88.
A pure monopolist’s short-run profit–maximizing or loss-minimizing position is such that
price
89.
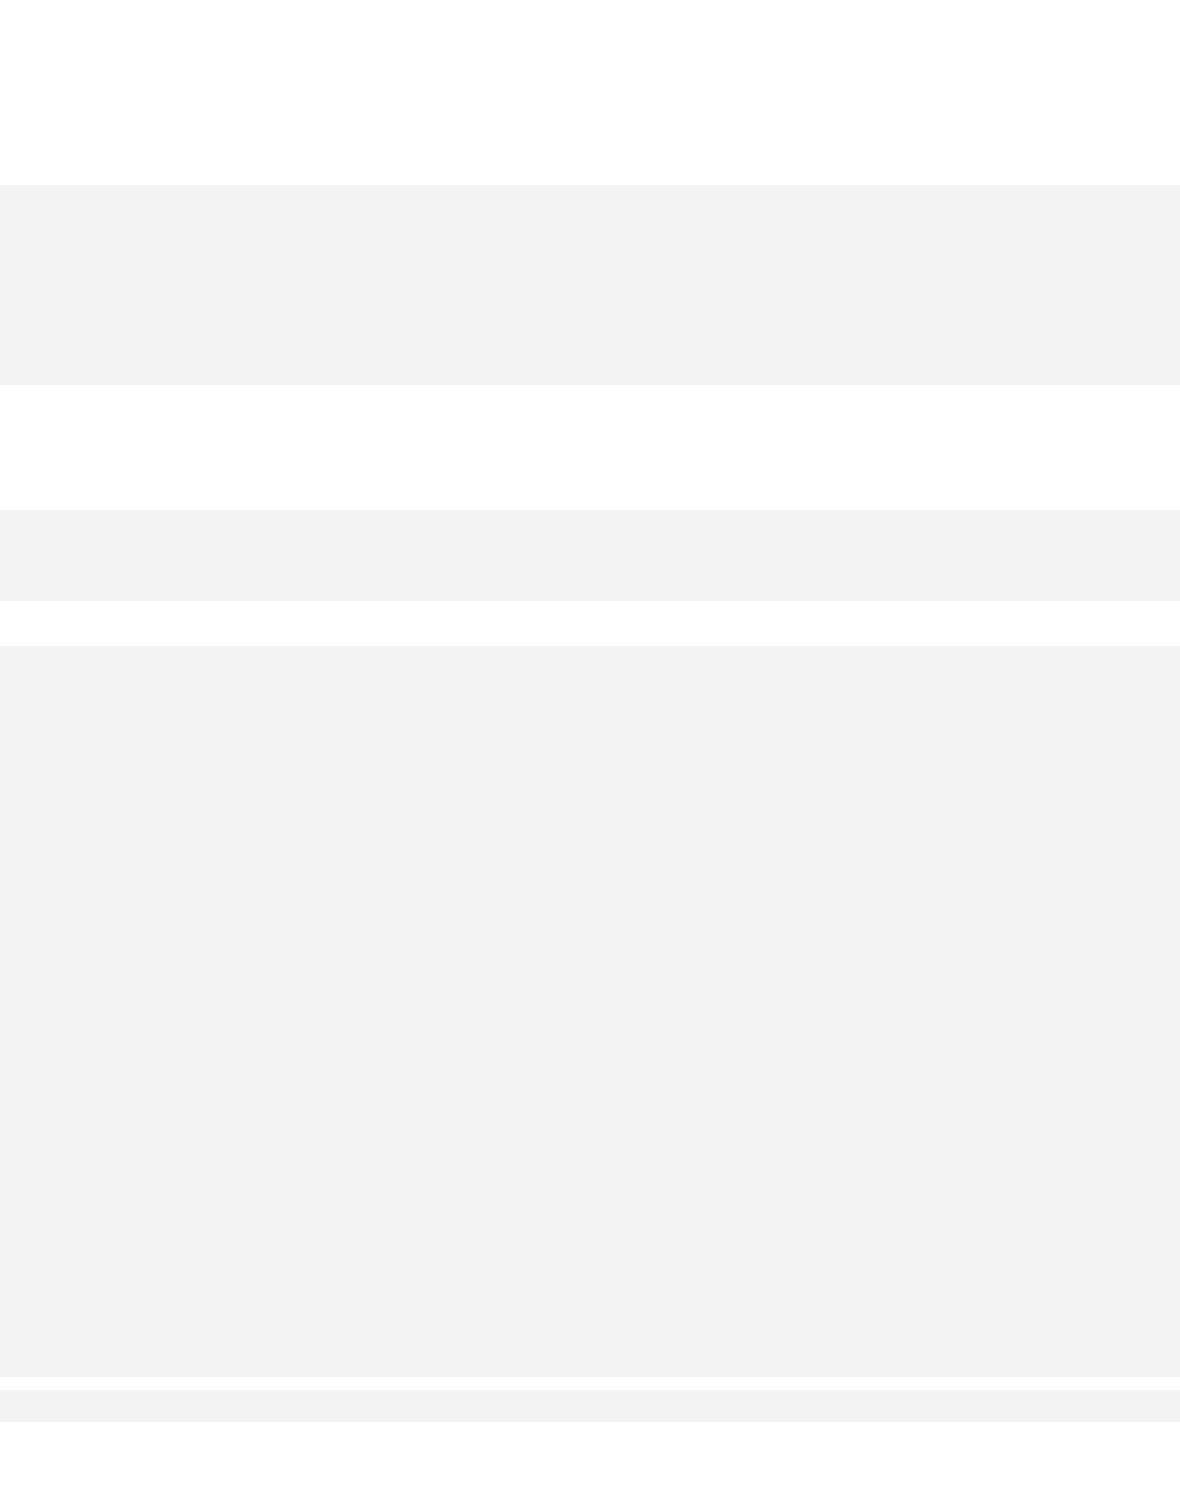
Refer to the diagram for a pure monopolist. Monopoly price will be
90.
Refer to the diagram for a pure monopolist. Monopoly output will be
12–53
Copyright © 2018 McGraw-Hill Education. All rights reserved. No reproduction or distribution without the prior
written consent of McGraw-Hill Education.
Type: Graph
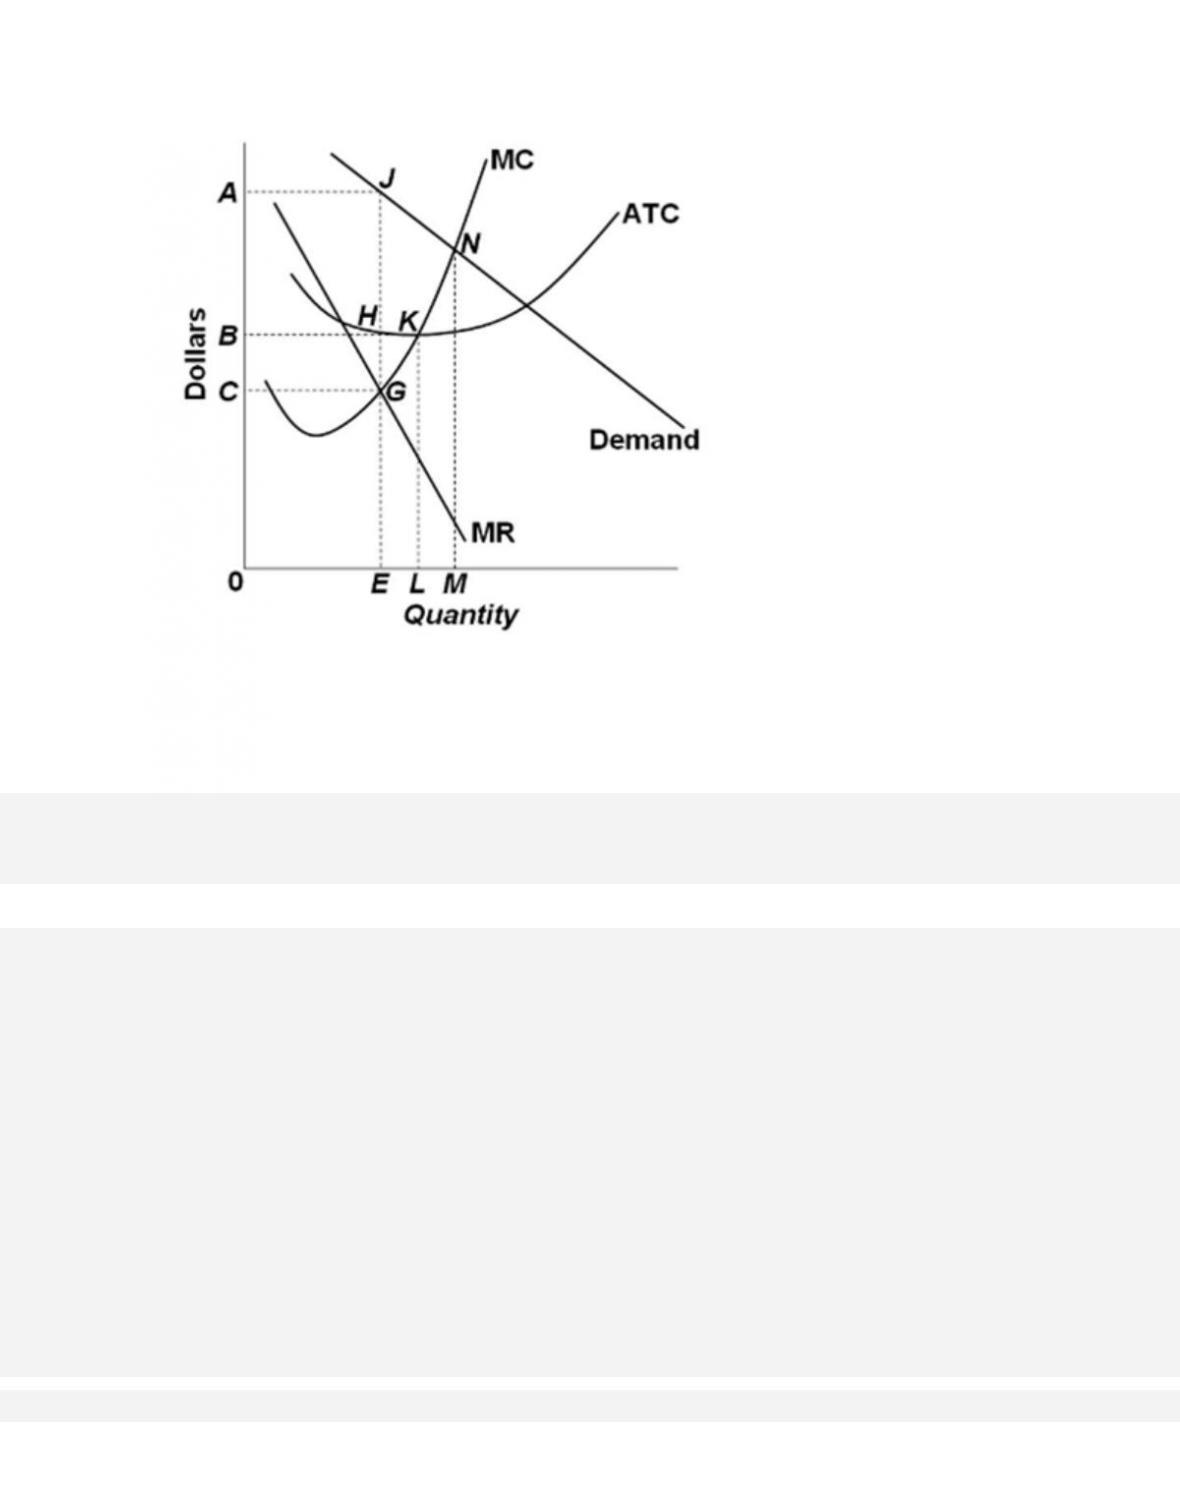
91.
Refer to the diagram for a pure monopolist. Monopoly profit
92.
In the short run, a monopolist’s economic profits
93.
Under which of the following situations would a monopolist increase profits by lowering
price (and increasing output)?
94.
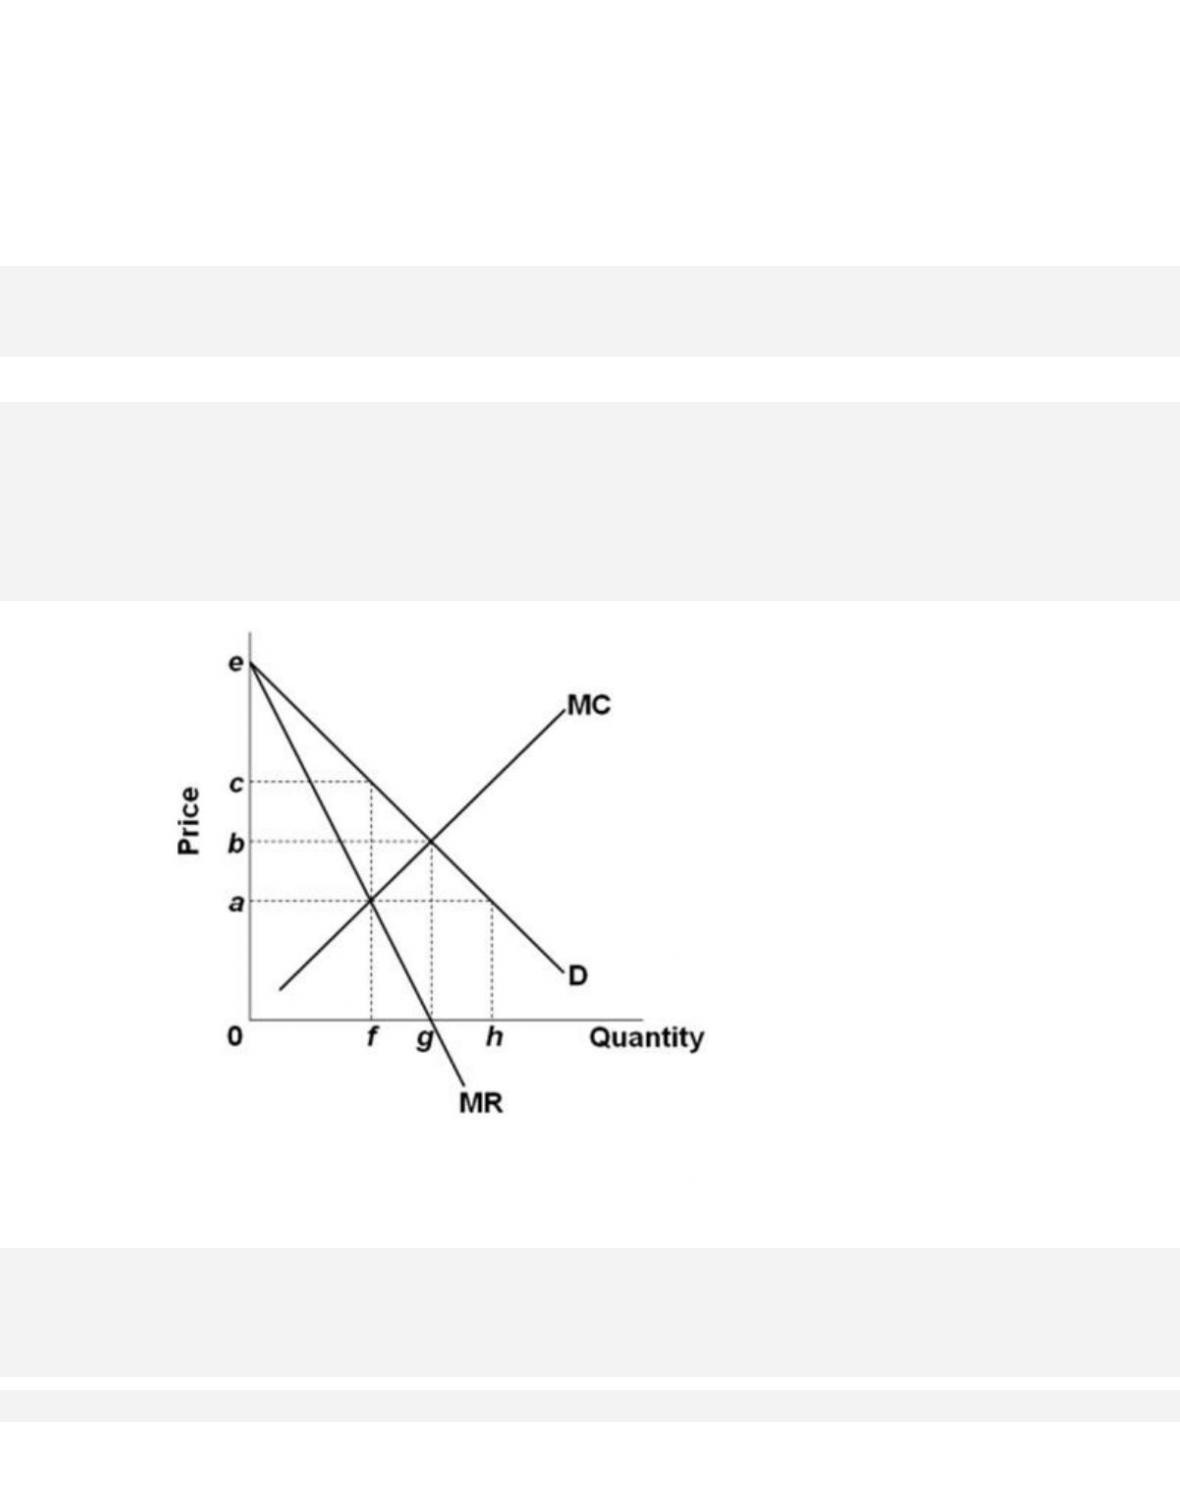
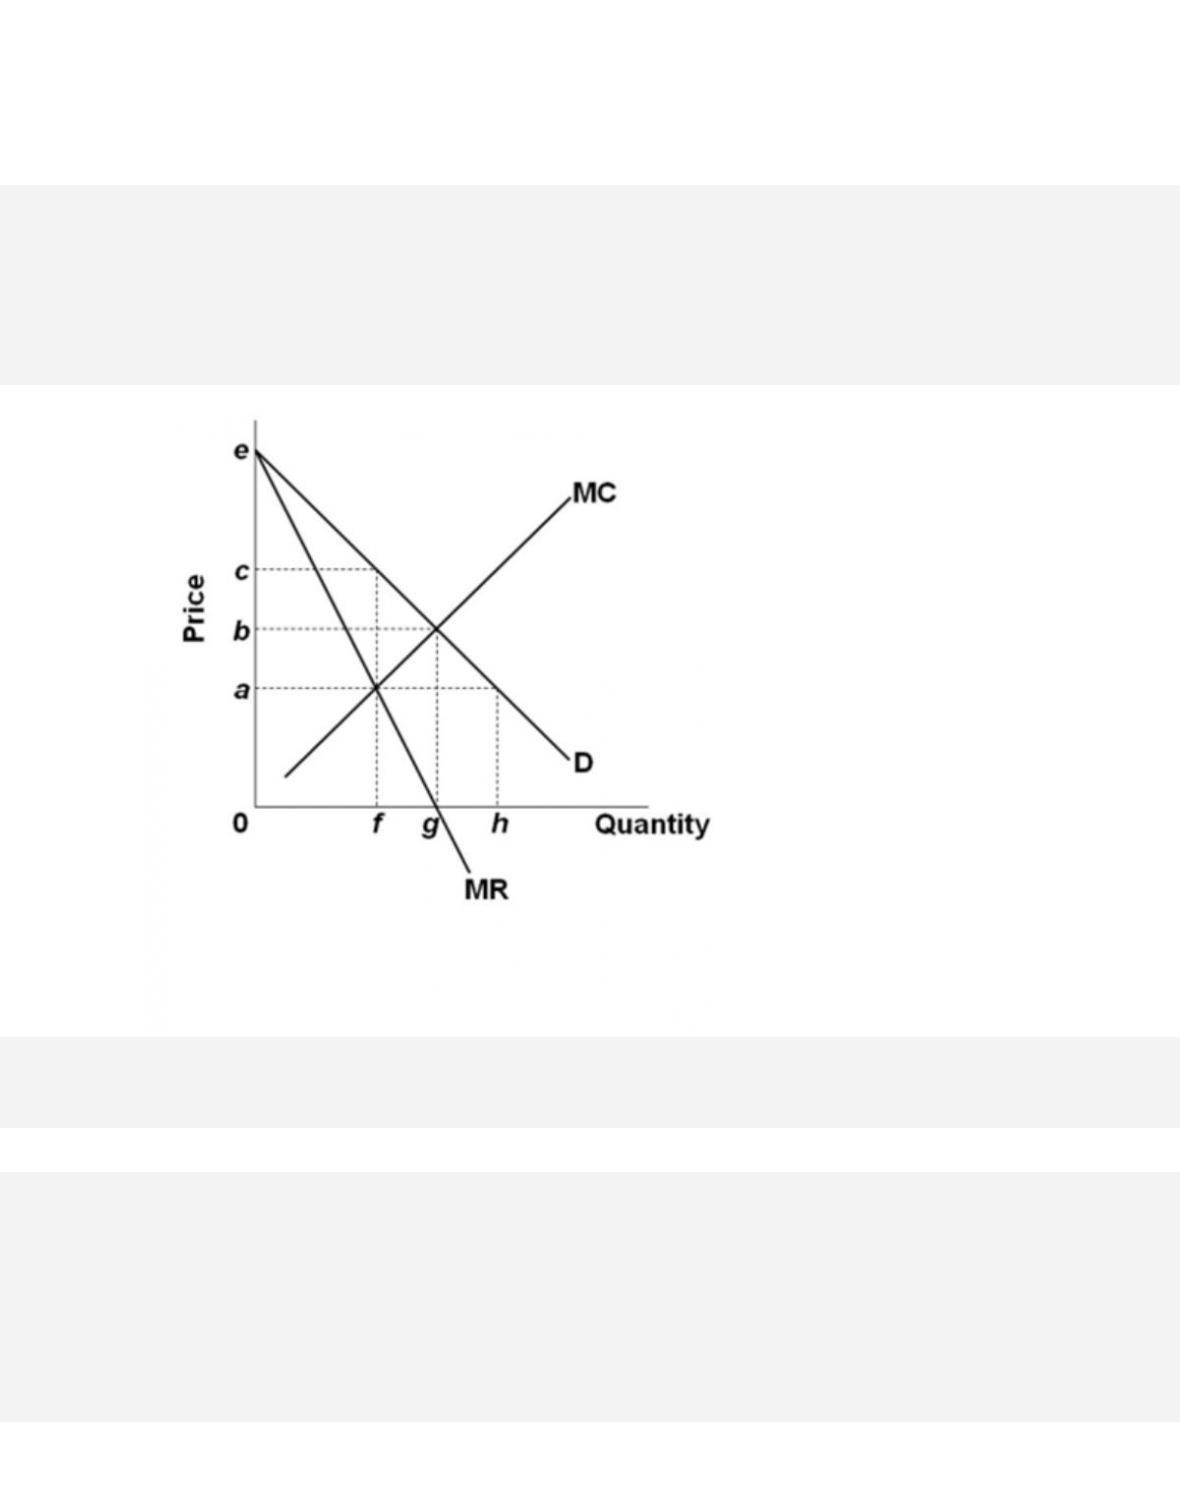
If the industry depicted in the graph is purely monopolistic, the profit-maximizing price and
quantity will be

95.
If the industry depicted in the graph comprises only one seller, the profit-maximizing price
and quantity will be
96. When a pure monopolist is producing its profit-maximizing output, price will
12–57
Copyright © 2018 McGraw-Hill Education. All rights reserved. No reproduction or distribution without the prior
written consent of McGraw-Hill Education.
AACSB: Knowledge Application
Acc es si bi lit y: Keyboard Navigation
Blooms: Understand
D iffi c ul t y : 02 Medium
Learning Objective: 12–04 Explain how a pure monopoly sets its profit-maximizing output and
price.
Test Bank: I
To p i c : Output and Price Determination
Type: Graph
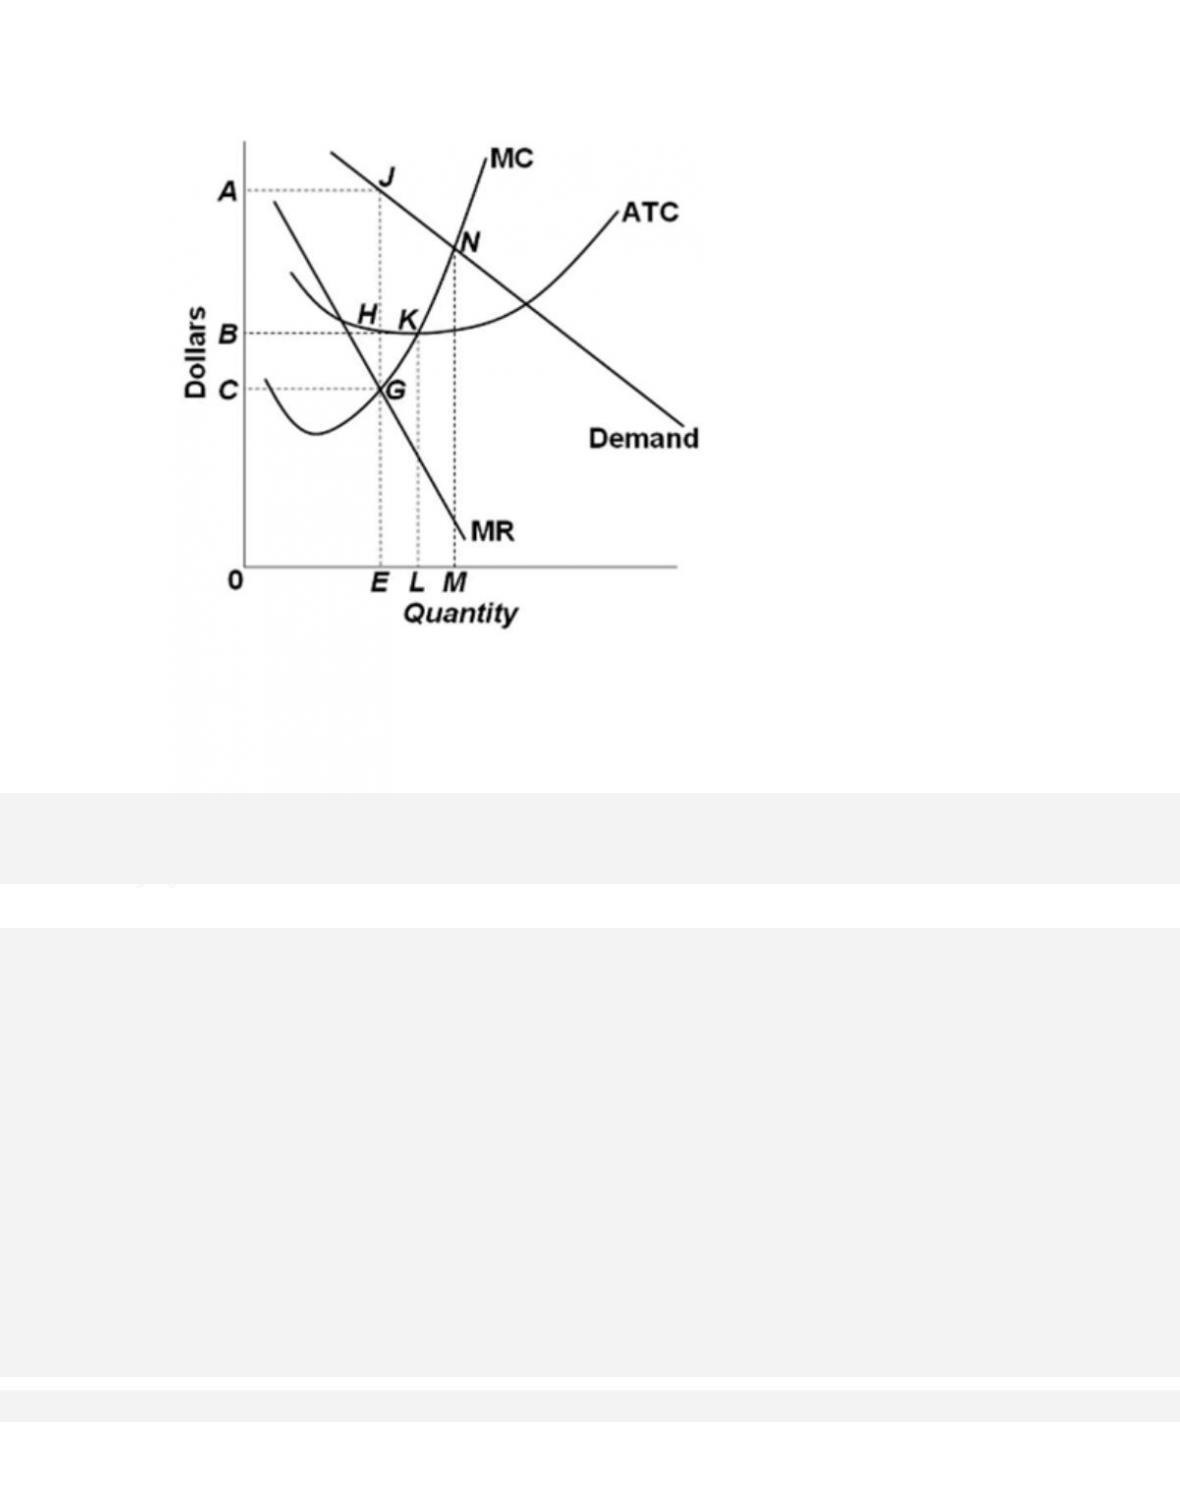
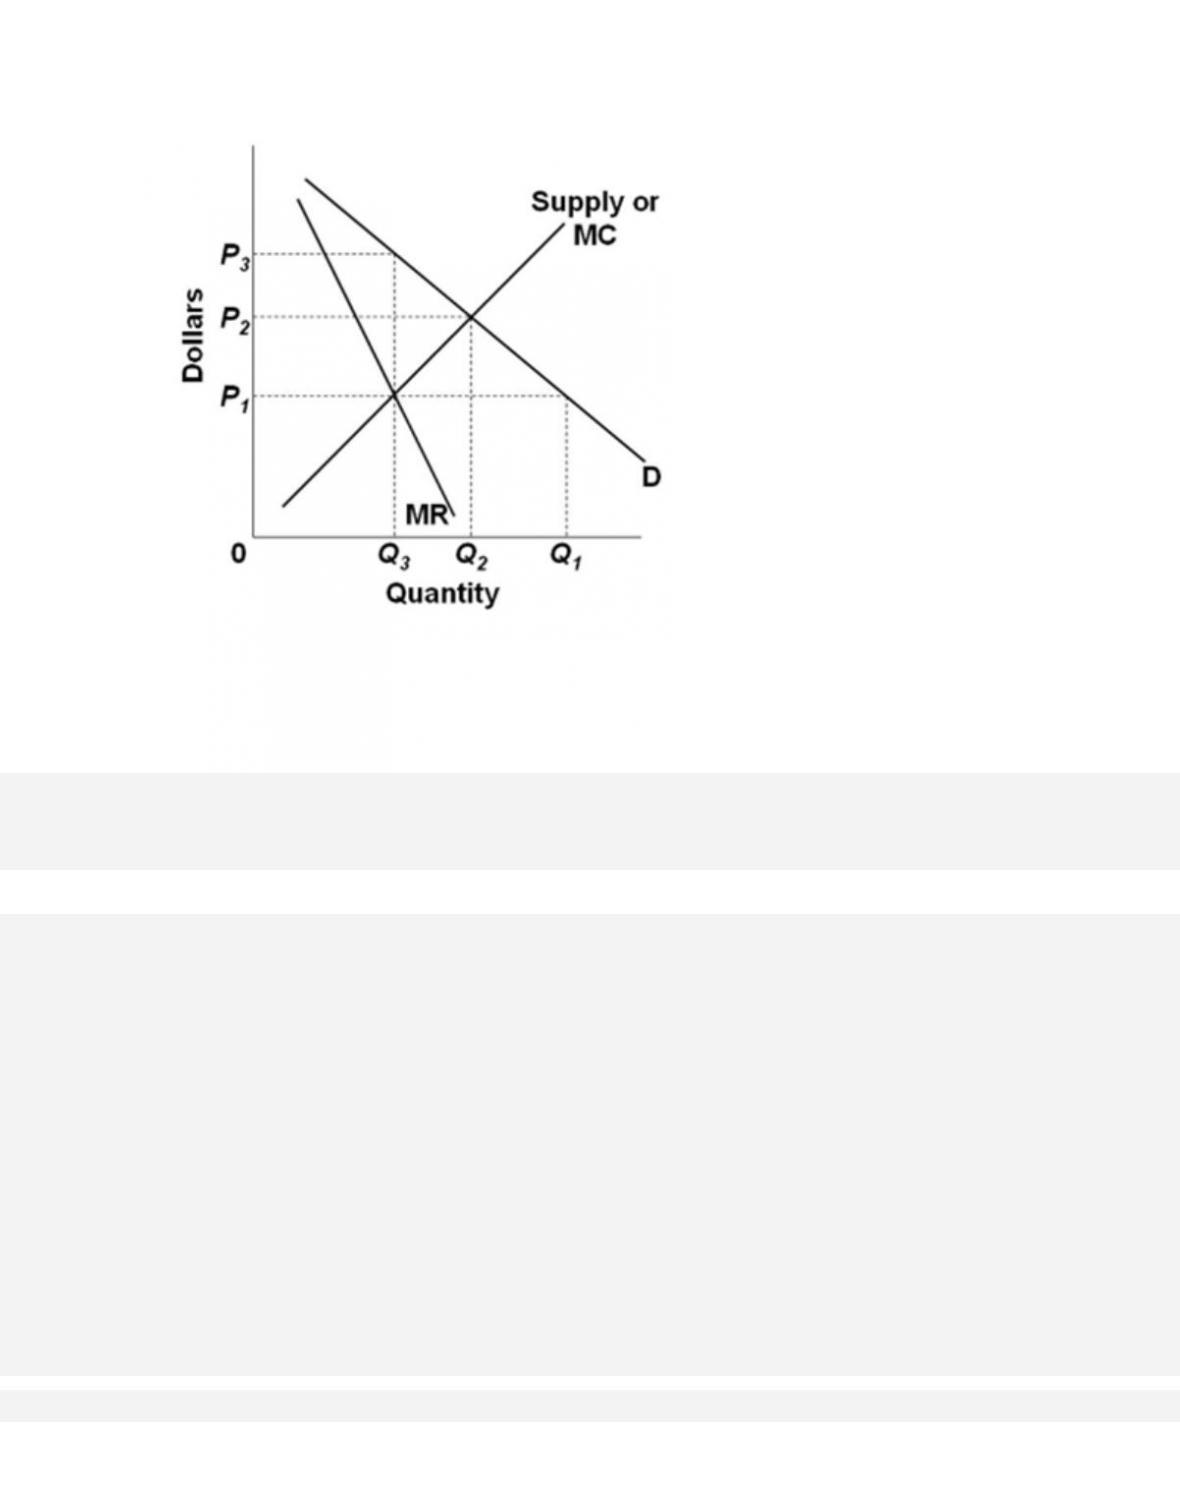
97.
Assume a pure monopolist is charging price P and selling output Q, as shown on the diagram.
On the basis of this information, we can say that
12–58
Copyright © 2018 McGraw-Hill Education. All rights reserved. No reproduction or distribution without the prior
written consent of McGraw-Hill Education.
Test Bank: I
To p i c : Output and Price Determination
Type: Graph
98.
The supply curve for a monopolist is
99.
The supply curve of a pure monopolist
100.
If the variable costs of a profit–maximizing pure monopolist decline, the firm should
12–59
Copyright © 2018 McGraw-Hill Education. All rights reserved. No reproduction or distribution without the prior
written consent of McGraw-Hill Education.
Acc es si bi lit y: Keyboard Navigation
Blooms: Understand
D iffi c ul t y : 02 Medium
Learning Objective: 12–04 Explain how a pure monopoly sets its profit-maximizing output and
price.
Test Bank: I
To p i c : Output and Price Determination
101.
To maximize profit, a pure monopolist must
102.
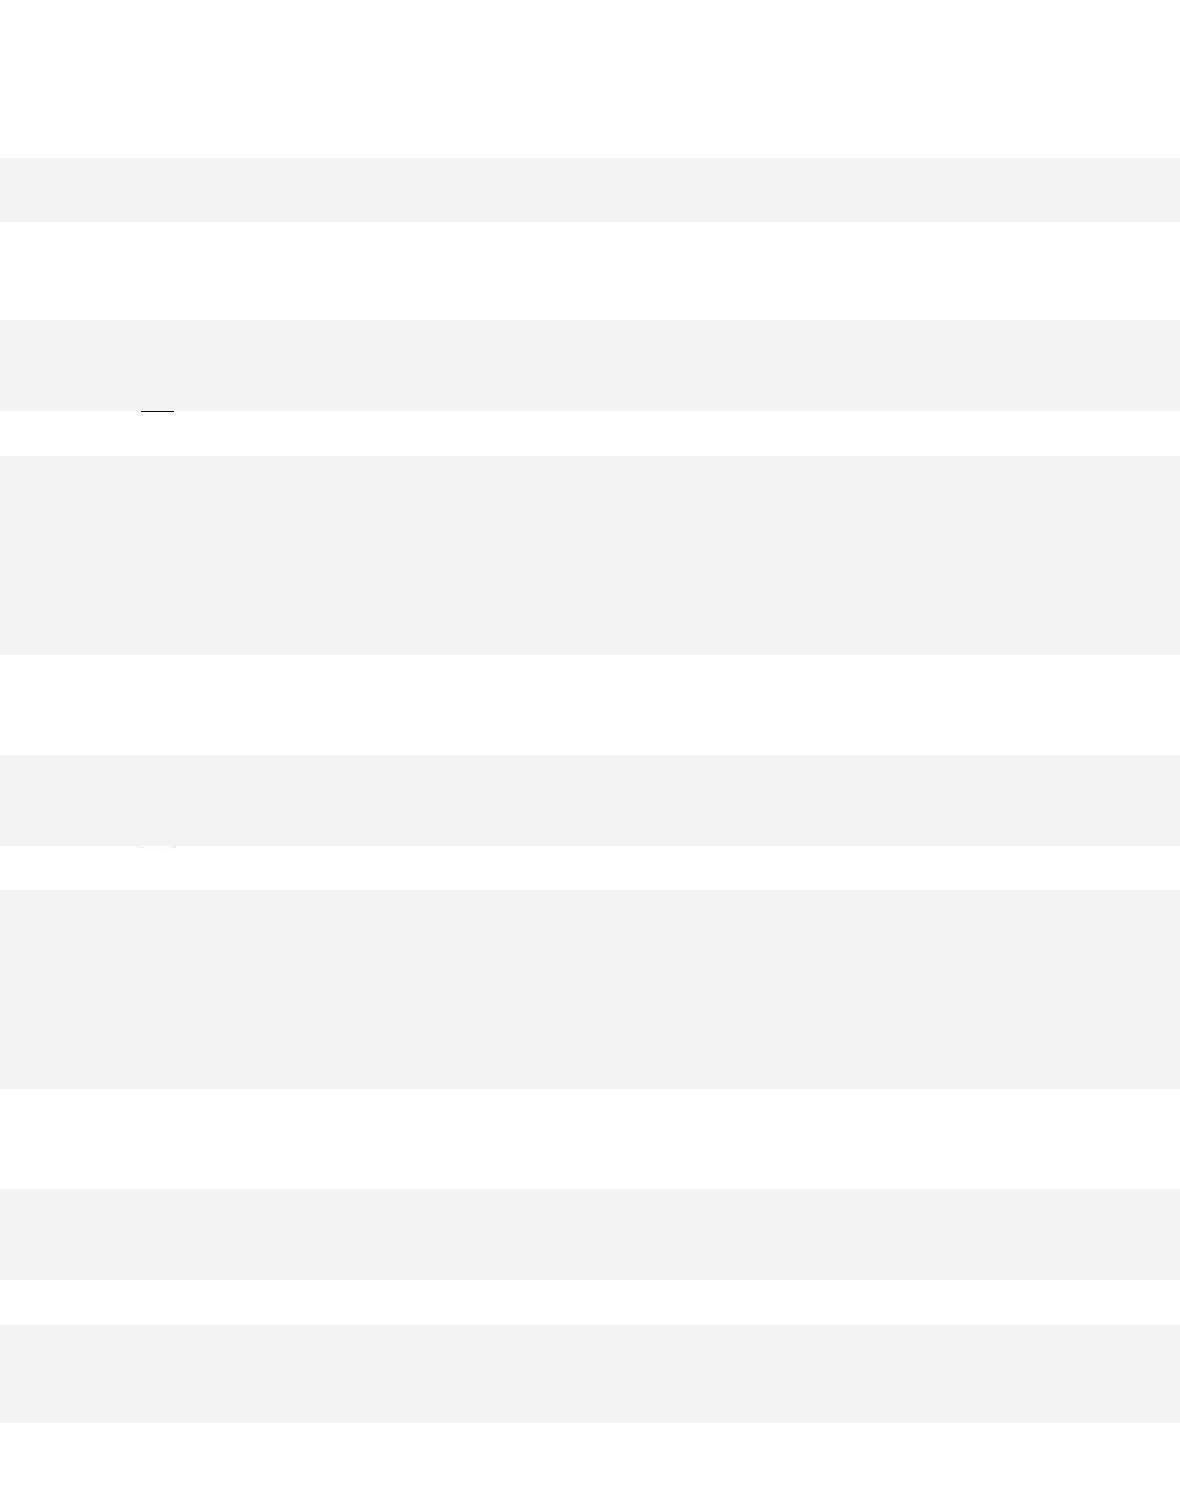
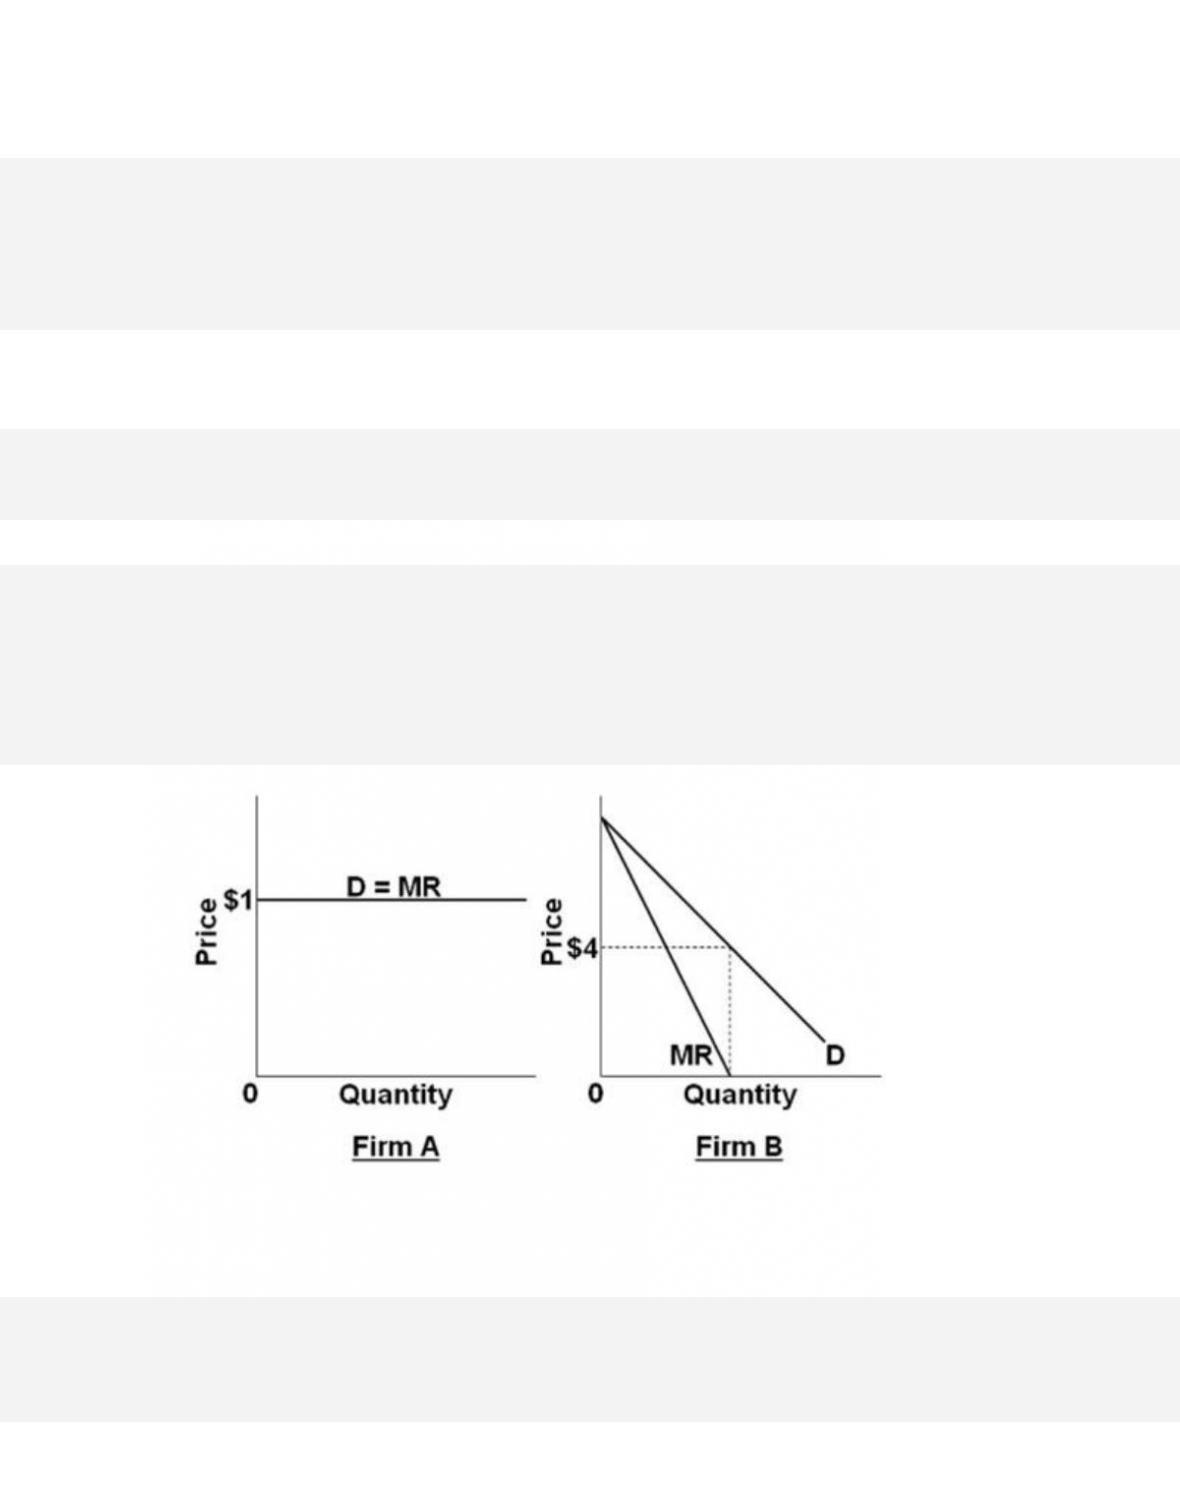
Refer to the diagrams. Firm A is a
12–60
Copyright © 2018 McGraw-Hill Education. All rights reserved. No reproduction or distribution without the prior
written consent of McGraw-Hill Education.
C.
pure monopoly, and Firm B is a pure competitor.
D.
pure monopoly, as is Firm B.
103.
Refer to the diagrams. The demand for Firm A’s product is