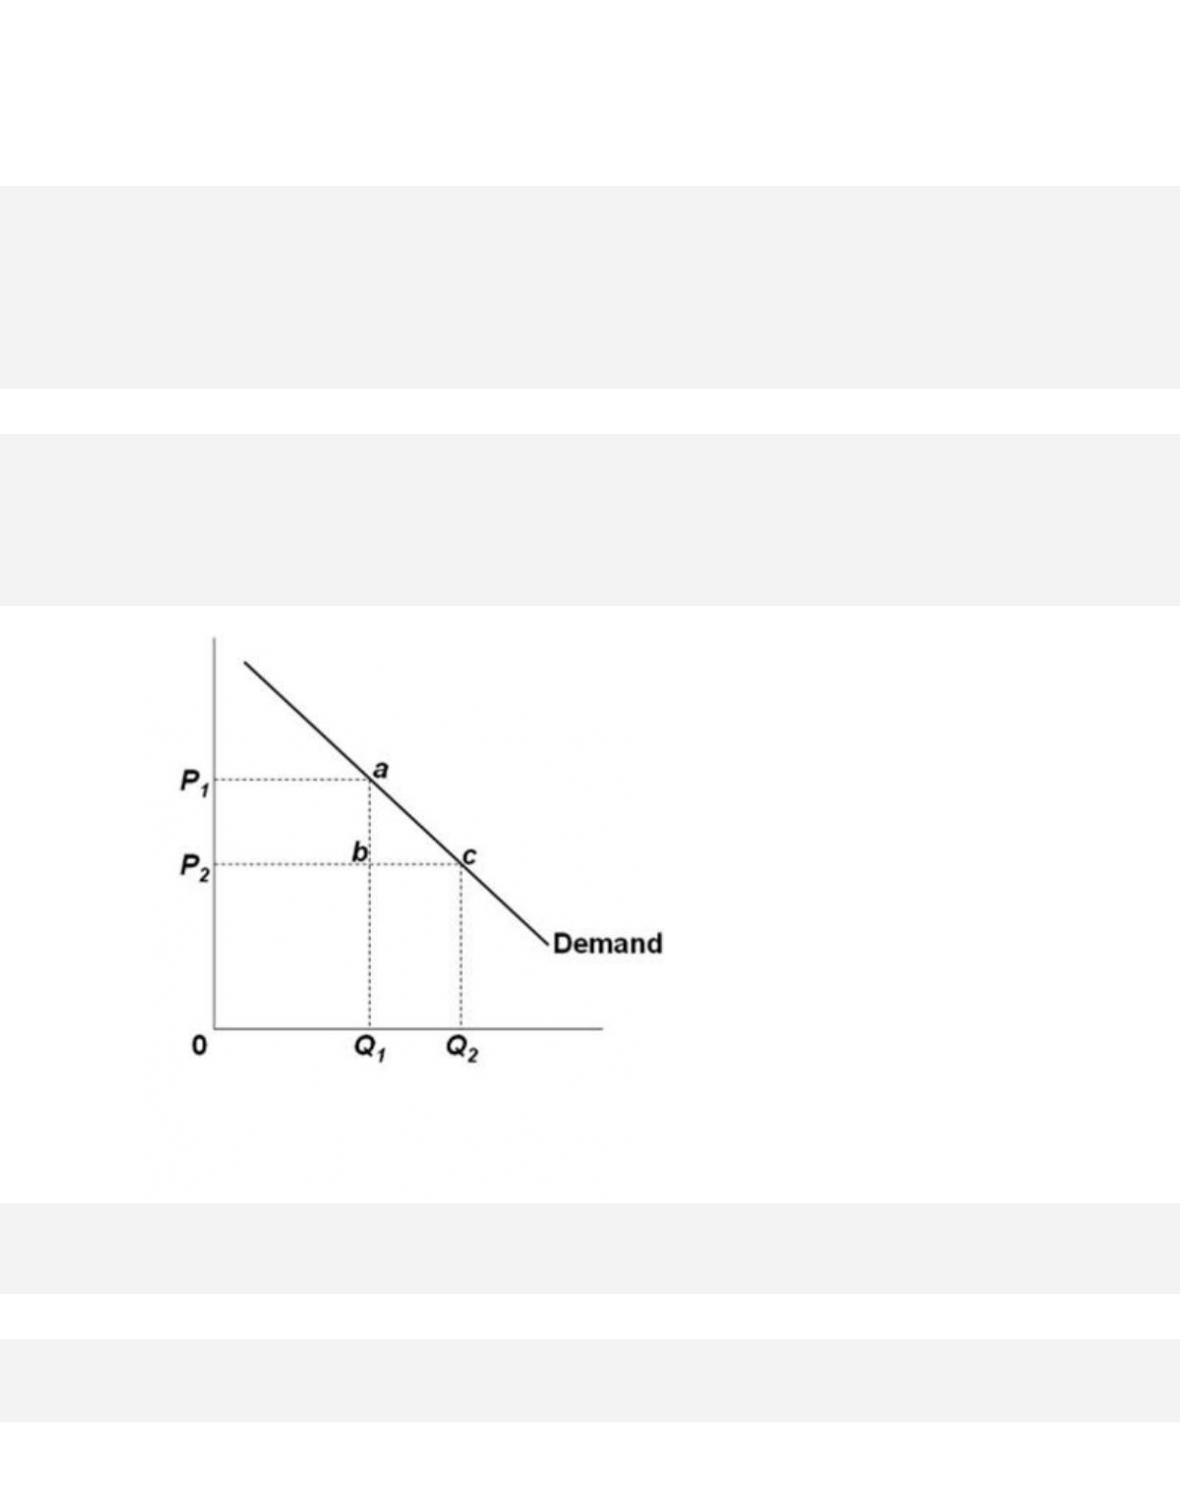
36.
The quantitative difference between areas Q1bcQ2 and P1P2ba in the diagram measures
12–22
Copyright © 2018 McGraw-Hill Education. All rights reserved. No reproduction or distribution without the prior
written consent of McGraw-Hill Education.
Blooms: Understand
D iffi c ul t y : 02 Medium
Learning Objective: 12–03 Explain how demand is seen by a pure monopoly.
Test Bank: I
To p i c : Monopoly Demand
Type: Graph
37.
Which of the following is characteristic of a pure monopolist‘s demand curve?
38.
Because the monopolist’s demand curve is downsloping,
39.
The pure monopolist’s demand curve is relatively elastic
12–23
Copyright © 2018 McGraw-Hill Education. All rights reserved. No reproduction or distribution without the prior
written consent of McGraw-Hill Education.
AACSB: Knowledge Application
Acc es si bi lit y: Keyboard Navigation
Blooms: Understand
D iffi c ul t y : 02 Medium
Learning Objective: 12–03 Explain how demand is seen by a pure monopoly.
Test Bank: I
To p i c : Monopoly Demand
40.
A nondiscriminating profit-maximizing monopolist
41.
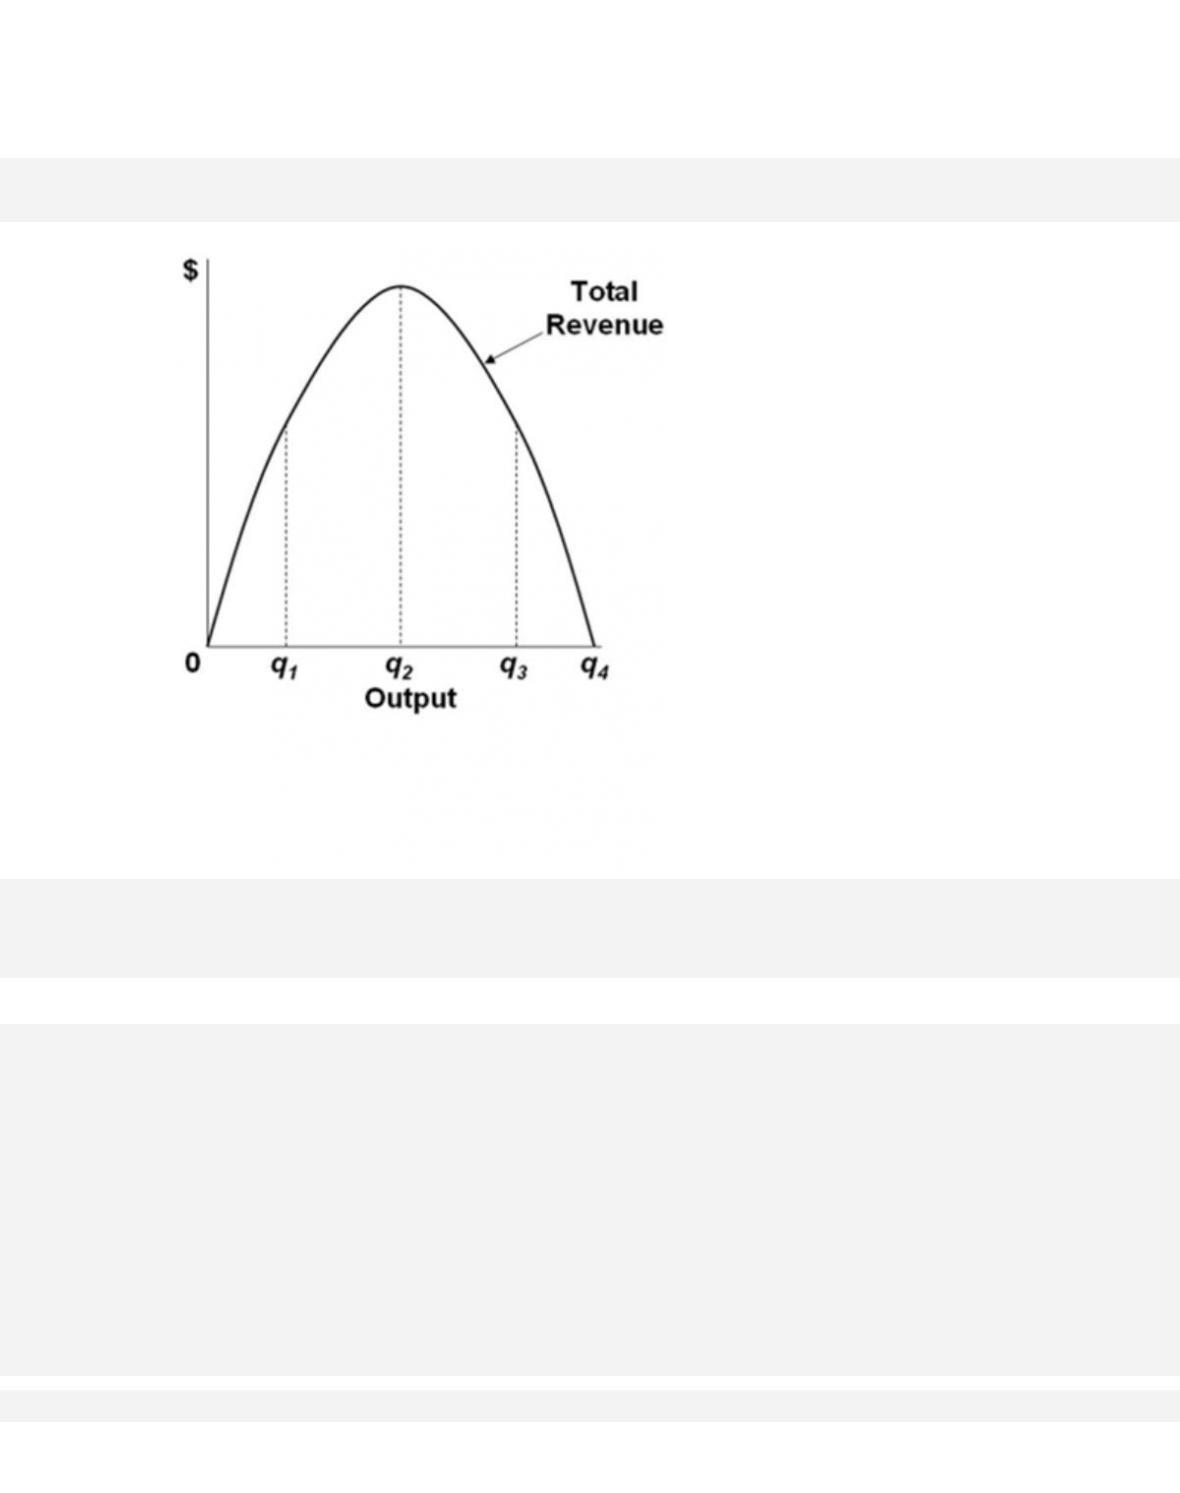
For a pure monopolist, the relationship between total revenue and marginal revenue is
such that
42.
For a pure nondiscriminating monopolist, marginal revenue is less than price because
12–24
Copyright © 2018 McGraw-Hill Education. All rights reserved. No reproduction or distribution without the prior
written consent of McGraw-Hill Education.
A.
the monopolist‘s demand curve is perfectly elastic.
B.
the monopolist‘s demand curve is perfectly inelastic.
C.
when a monopolist lowers price to sell more output, the lower price applies to all units
sold.
D. the monopolist’s total revenue curve is linear and slopes upward to the right.
43.
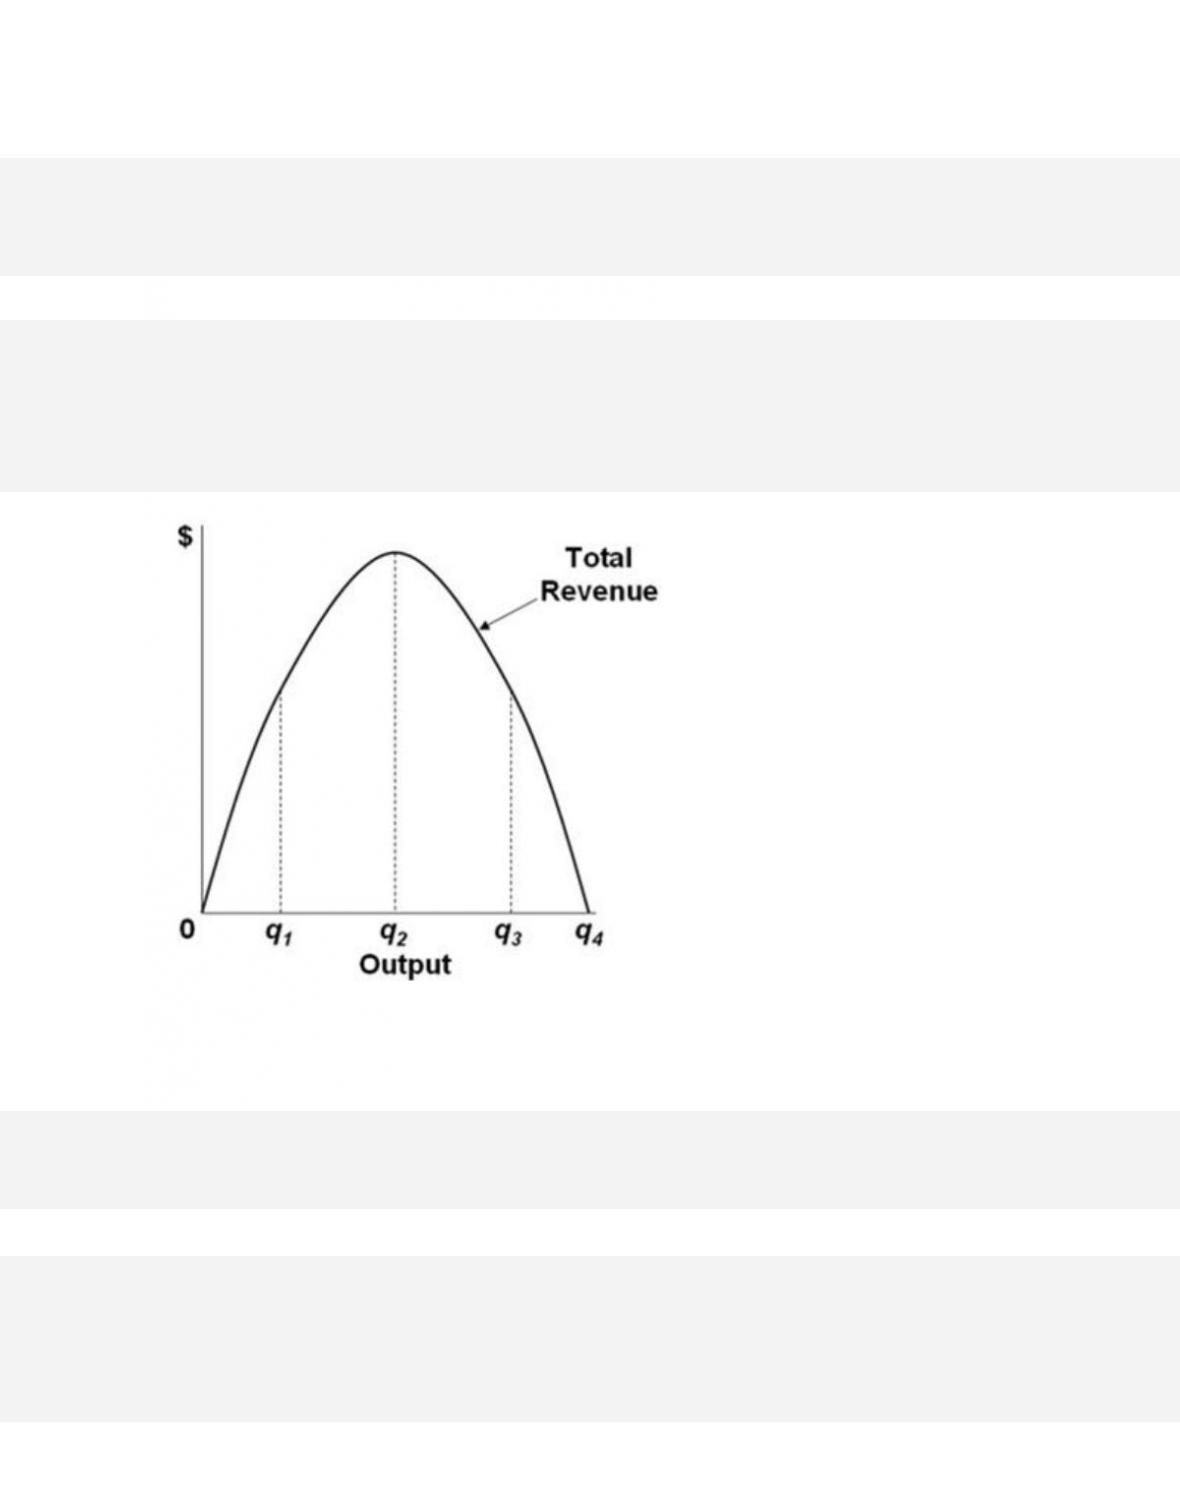
Refer to the diagram for a non discriminating monopolist. Demand is elastic
12–25
Copyright © 2018 McGraw-Hill Education. All rights reserved. No reproduction or distribution without the prior
written consent of McGraw-Hill Education.
Test Bank: I
To p i c : Monopoly Demand
Type: Graph
44.
Refer to the diagram for a nondiscriminating monopolist. Marginal revenue will be zero at
output
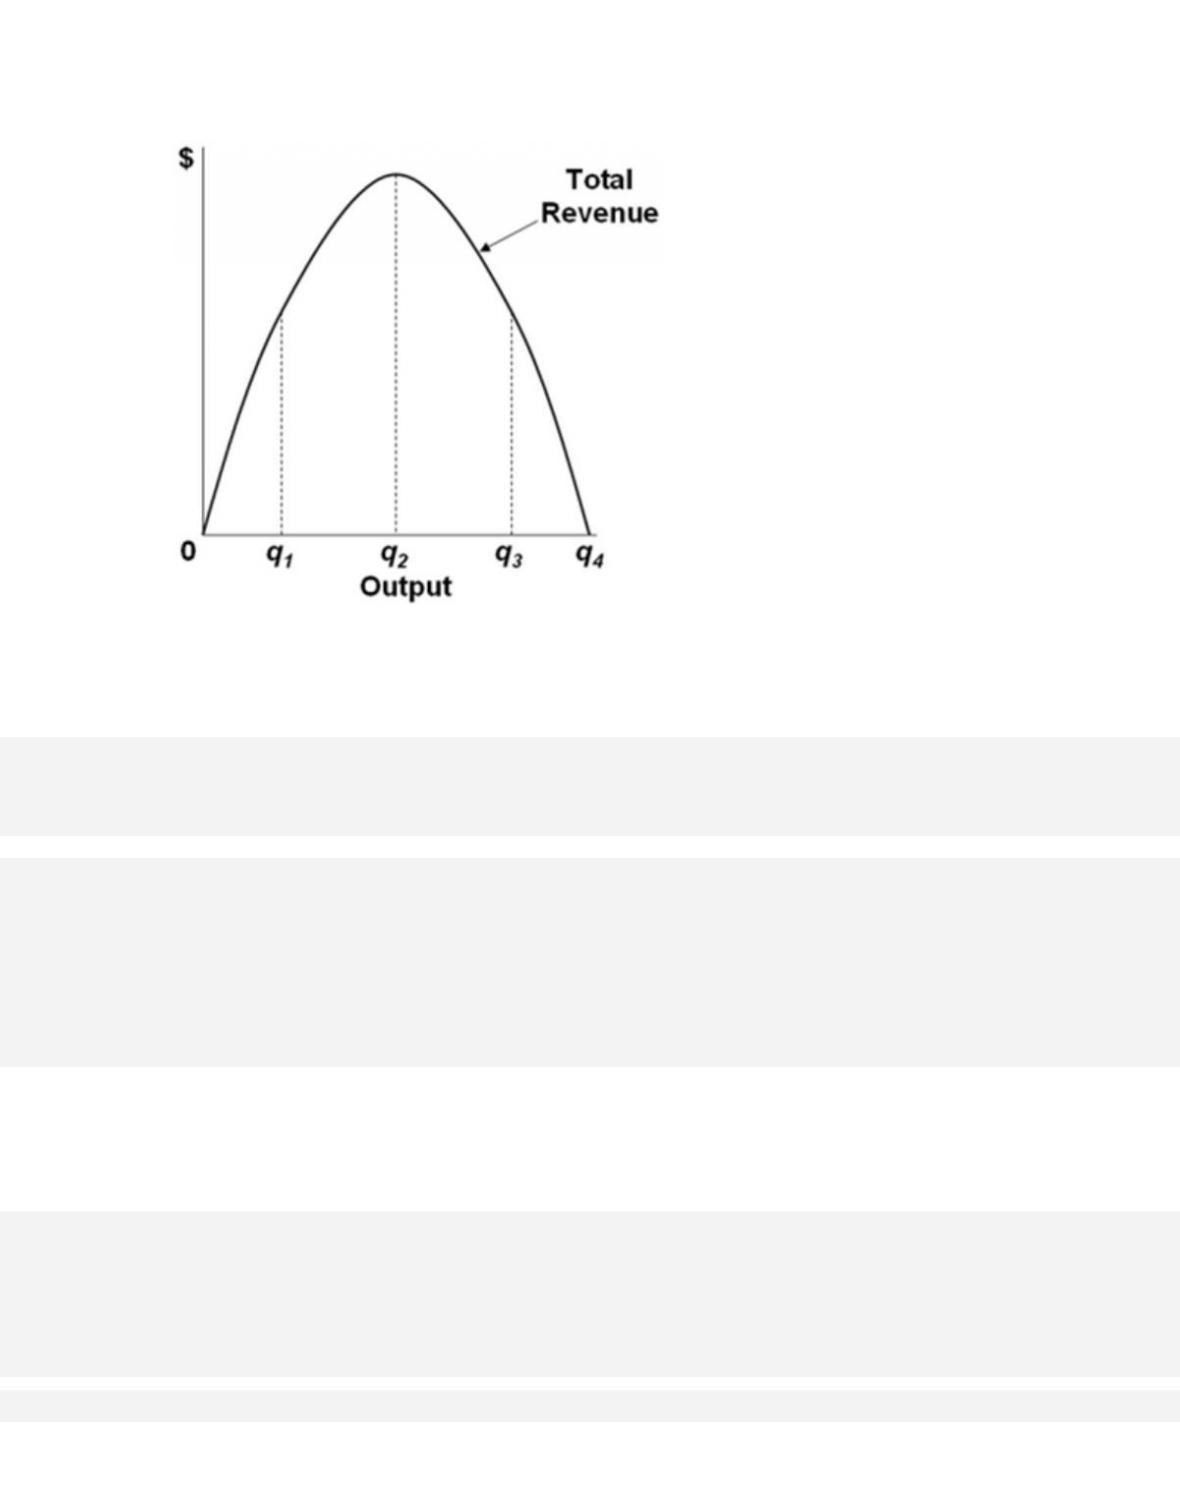
45.
Refer to the diagram for a nondiscriminating monopolist. The profit-seeking monopolist will
46.
Assume a pure monopolist is currently operating at a price-quantity combination on the
inelastic segment of its demand curve. If the monopolist is
seeking maximum profits, it
should

12–27
Copyright © 2018 McGraw-Hill Education. All rights reserved. No reproduction or distribution without the prior
written consent of McGraw-Hill Education.
AACSB: Knowledge Application
Acc es si bi lit y: Keyboard Navigation
Blooms: Understand
D iffi c ul t y : 02 Medium
Learning Objective: 12–03 Explain how demand is seen by a pure monopoly.
Test Bank: I
To p i c : Monopoly Demand
47.
A pure monopolist should never produce in the
48.
Assuming no change in product demand, a pure monopolist
49.
If a monopolist were to produce in the inelastic segment of its demand curve,
12–28
Copyright © 2018 McGraw-Hill Education. All rights reserved. No reproduction or distribution without the prior
written consent of McGraw-Hill Education.
B.
marginal revenue would be positive.
C.
the firm would not be maximizing profits.
D. it would necessarily incur a loss.
50.
If a pure monopolist is operating in a range of output where demand is elastic,
51.
Suppose a pure monopolist is charging a price of $12 and the associated marginal
revenue is $9. We thus know that
52.
A pure monopolist is selling six units at a price of $12. If the marginal revenue of the
seventh unit is $5, then the
53.
The vertical distance between the horizontal axis and any point on a nondiscriminating
monopolist’s demand curve measures
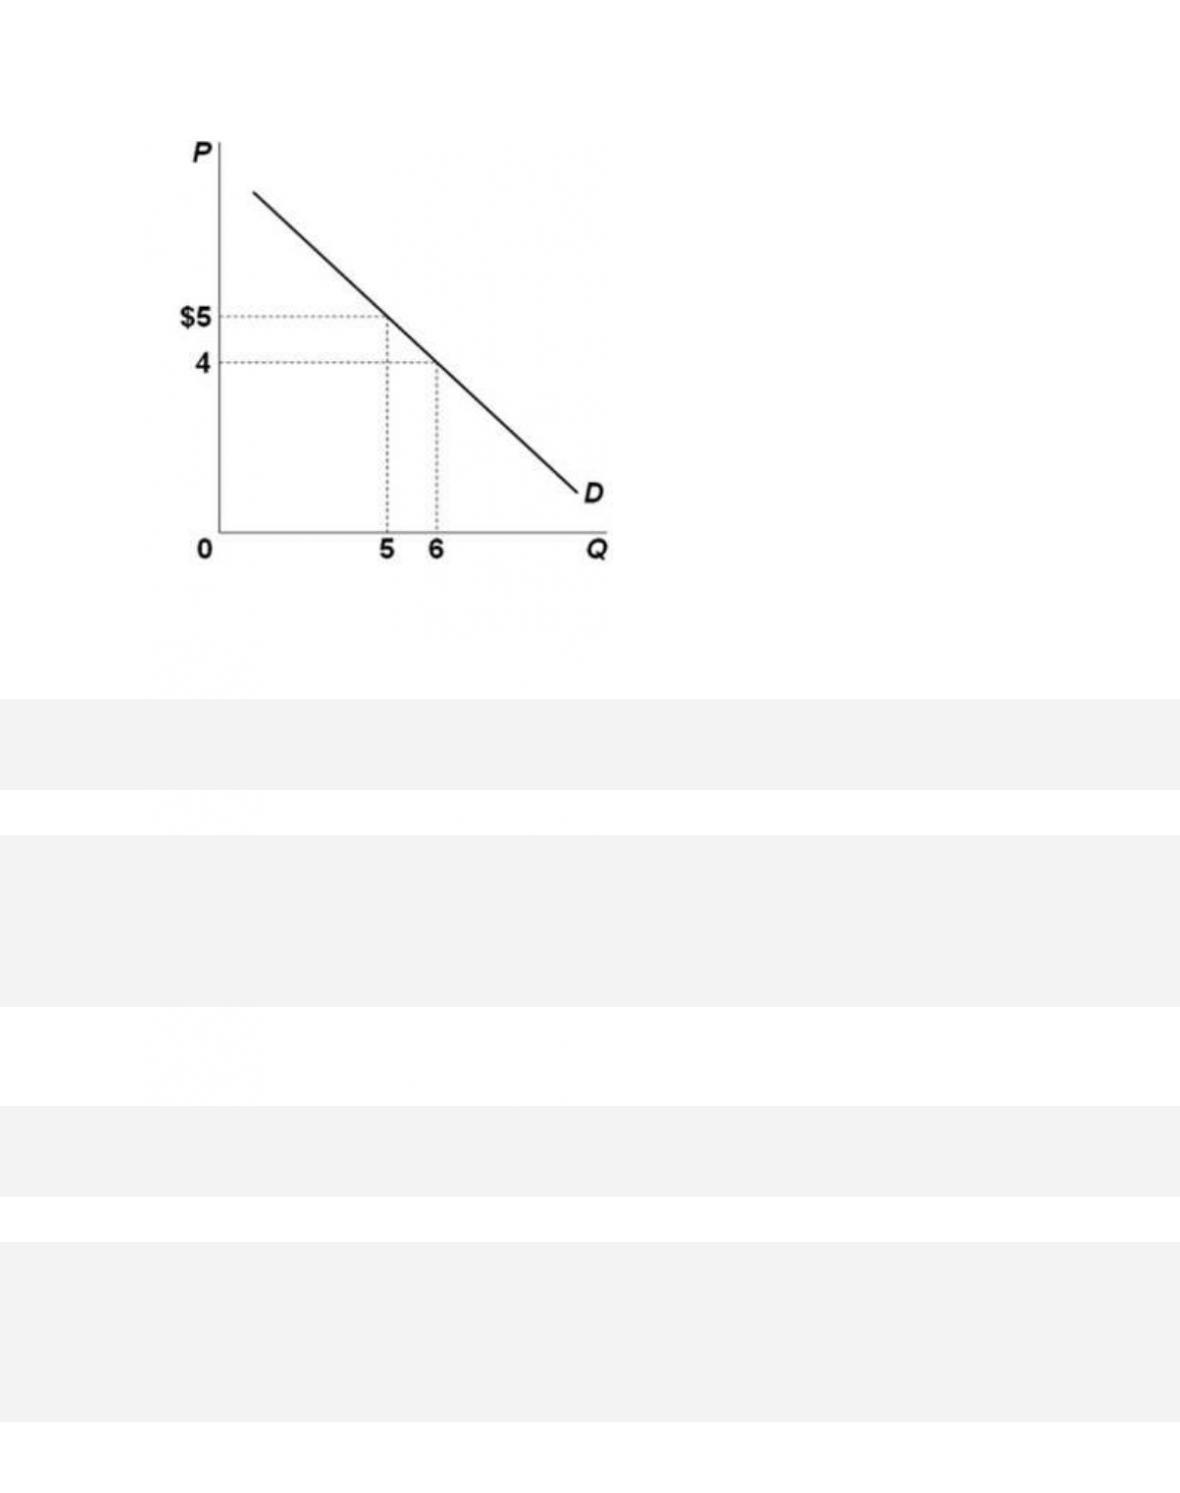
54.
The diagram indicates that the marginal revenue of the sixth unit of output is
55.
Which of the following is incorrect? Imperfectly competitive producers
12–31
Copyright © 2018 McGraw-Hill Education. All rights reserved. No reproduction or distribution without the prior
written consent of McGraw-Hill Education.
Learning Objective: 12–03 Explain how demand is seen by a pure monopoly.
Test Bank: I
To p i c : Monopoly Demand
56.
Answer the question on the basis of the accompanying table, which shows the demand
schedule facing a nondiscriminating monopolist.
P
Qd
$10
1
7
2
5
3
3
4
1
5
The monopolist will select its profit-maximizing level of output somewhere within the
57.
Answer the question on the basis of the accompanying table, which shows the demand
schedule facing a nondiscriminating monopolist.
P
Qd
$10
1
7
2
5
3
3
4
1
5
The profit–maximizing monopolist will sell at a price
58.
Answer the question on the basis of the accompanying table, which shows the demand
schedule facing a non discriminating monopolist
P
Qd
$10
1
7
2
5
3
3
4
1
5
Assume that this monopolist faces zero production costs. The profit–maximizing monopolist
will set a price of
12–33
Copyright © 2018 McGraw-Hill Education. All rights reserved. No reproduction or distribution without the prior
written consent of McGraw-Hill Education.
D iffi c ul t y : 02 Medium
Learning Objective: 12–04 Explain how a pure monopoly sets its profit-maximizing output and
price.
Test Bank: I
To p i c : Output and Price Determination
Type: Table
59.
A nondiscriminating pure monopolist finds that it can sell its 50th unit of output for $50.
We can surmise that the marginal
60.
If a nondiscriminating pure monopolist decides to sell one more unit of output, the
marginal revenue associated with that unit will be
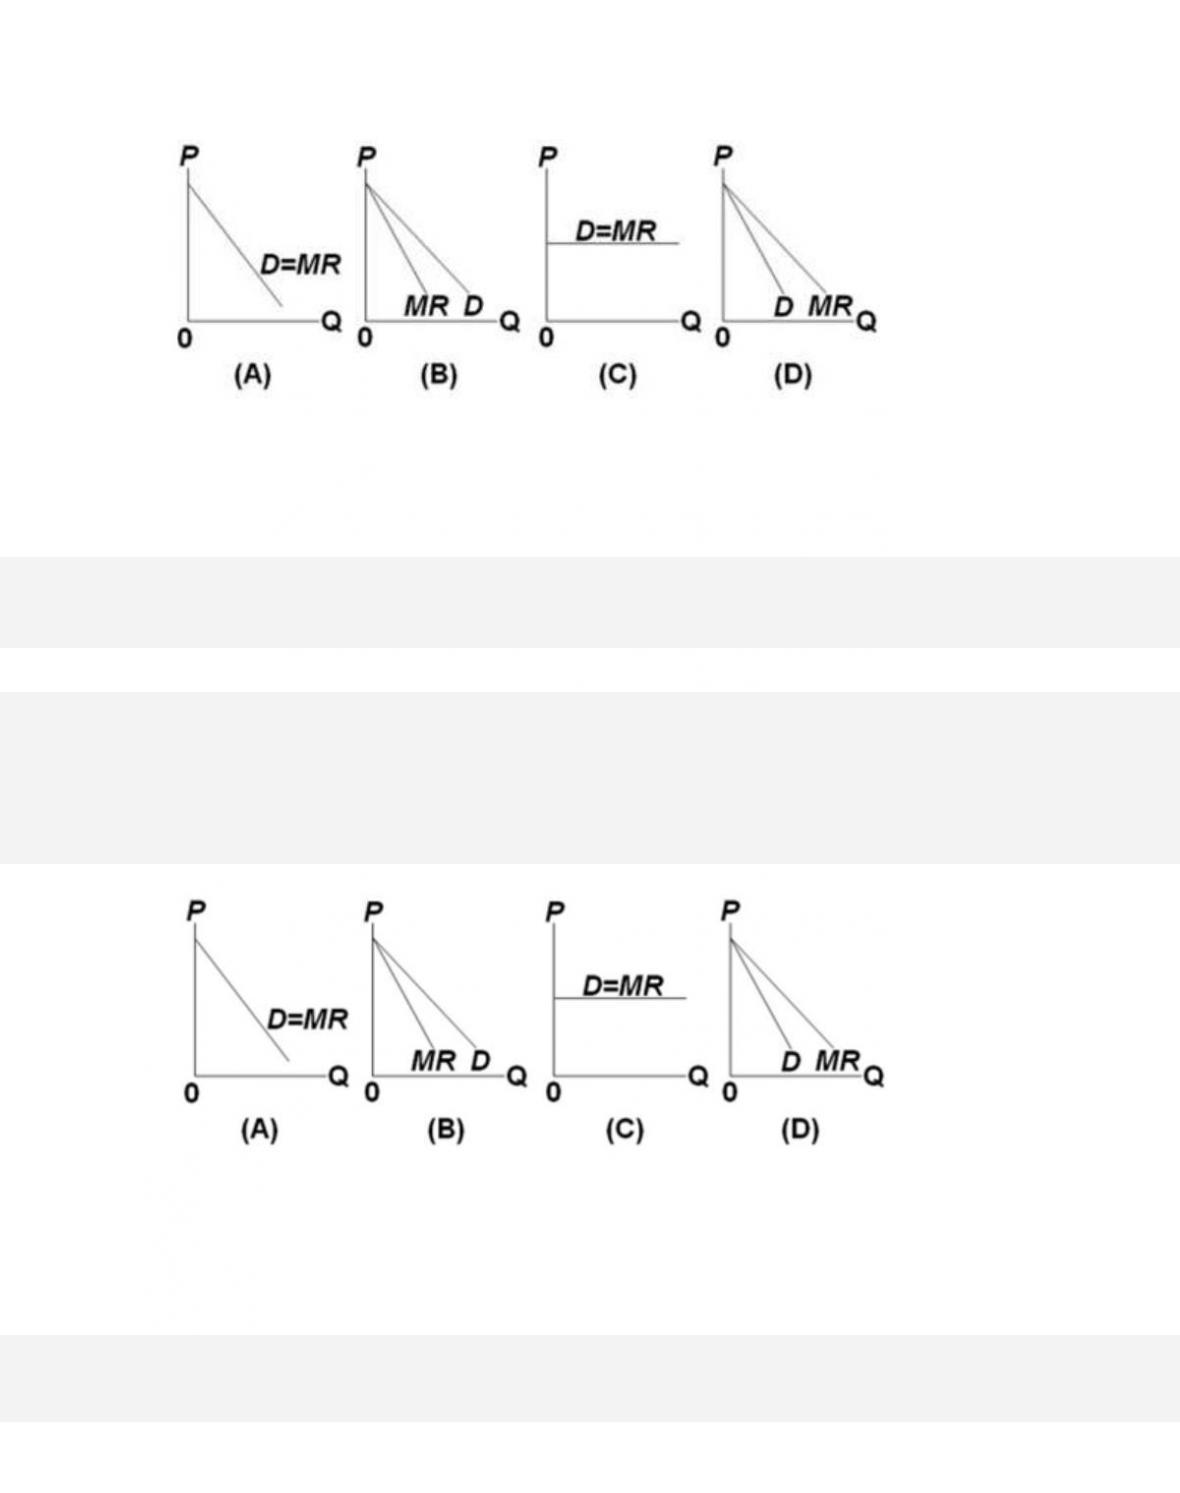
61.
Which of the diagrams correctly portrays a nondiscriminating pure monopolist‘s demand (D)
and marginal revenue (MR) curves?
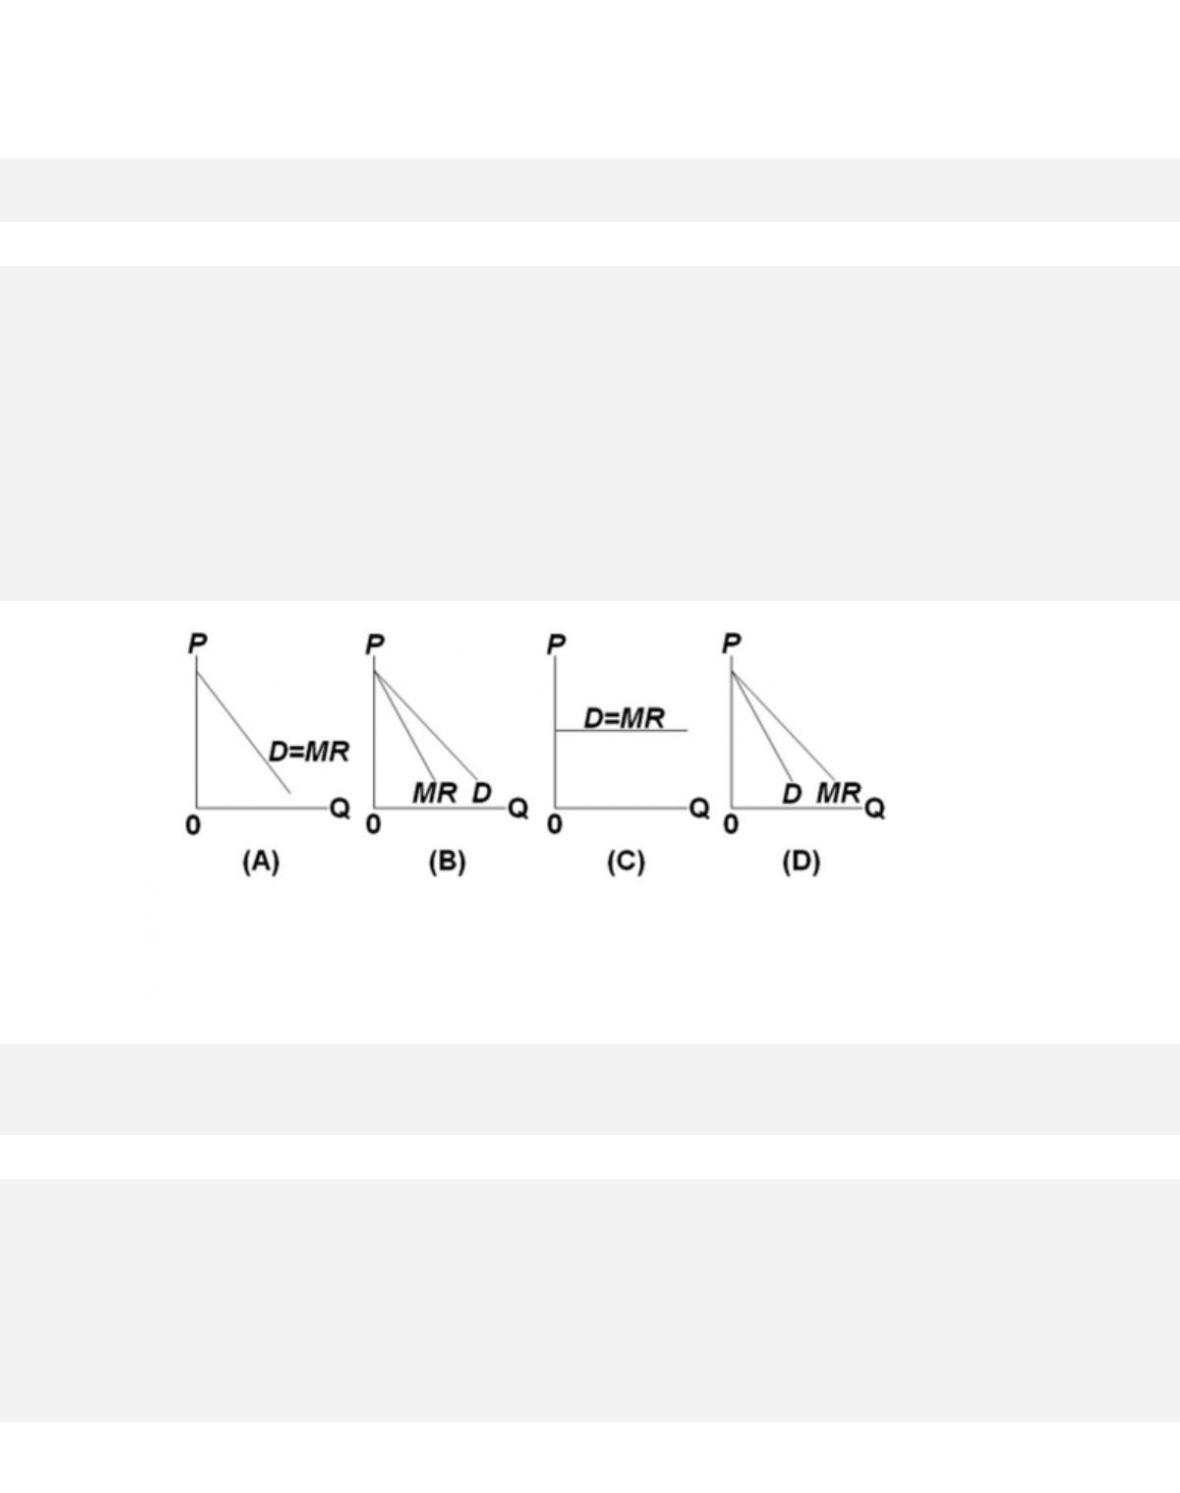
62.
Which of the diagrams correctly portrays the demand (D) and marginal revenue (MR) curves
of a pure monopolist that is able to price discriminate
by charging each customer his or her
maximum willingness to pay?
12–35
Copyright © 2018 McGraw-Hill Education. All rights reserved. No reproduction or distribution without the prior
written consent of McGraw-Hill Education.
B.
B
C.
C
D.
D
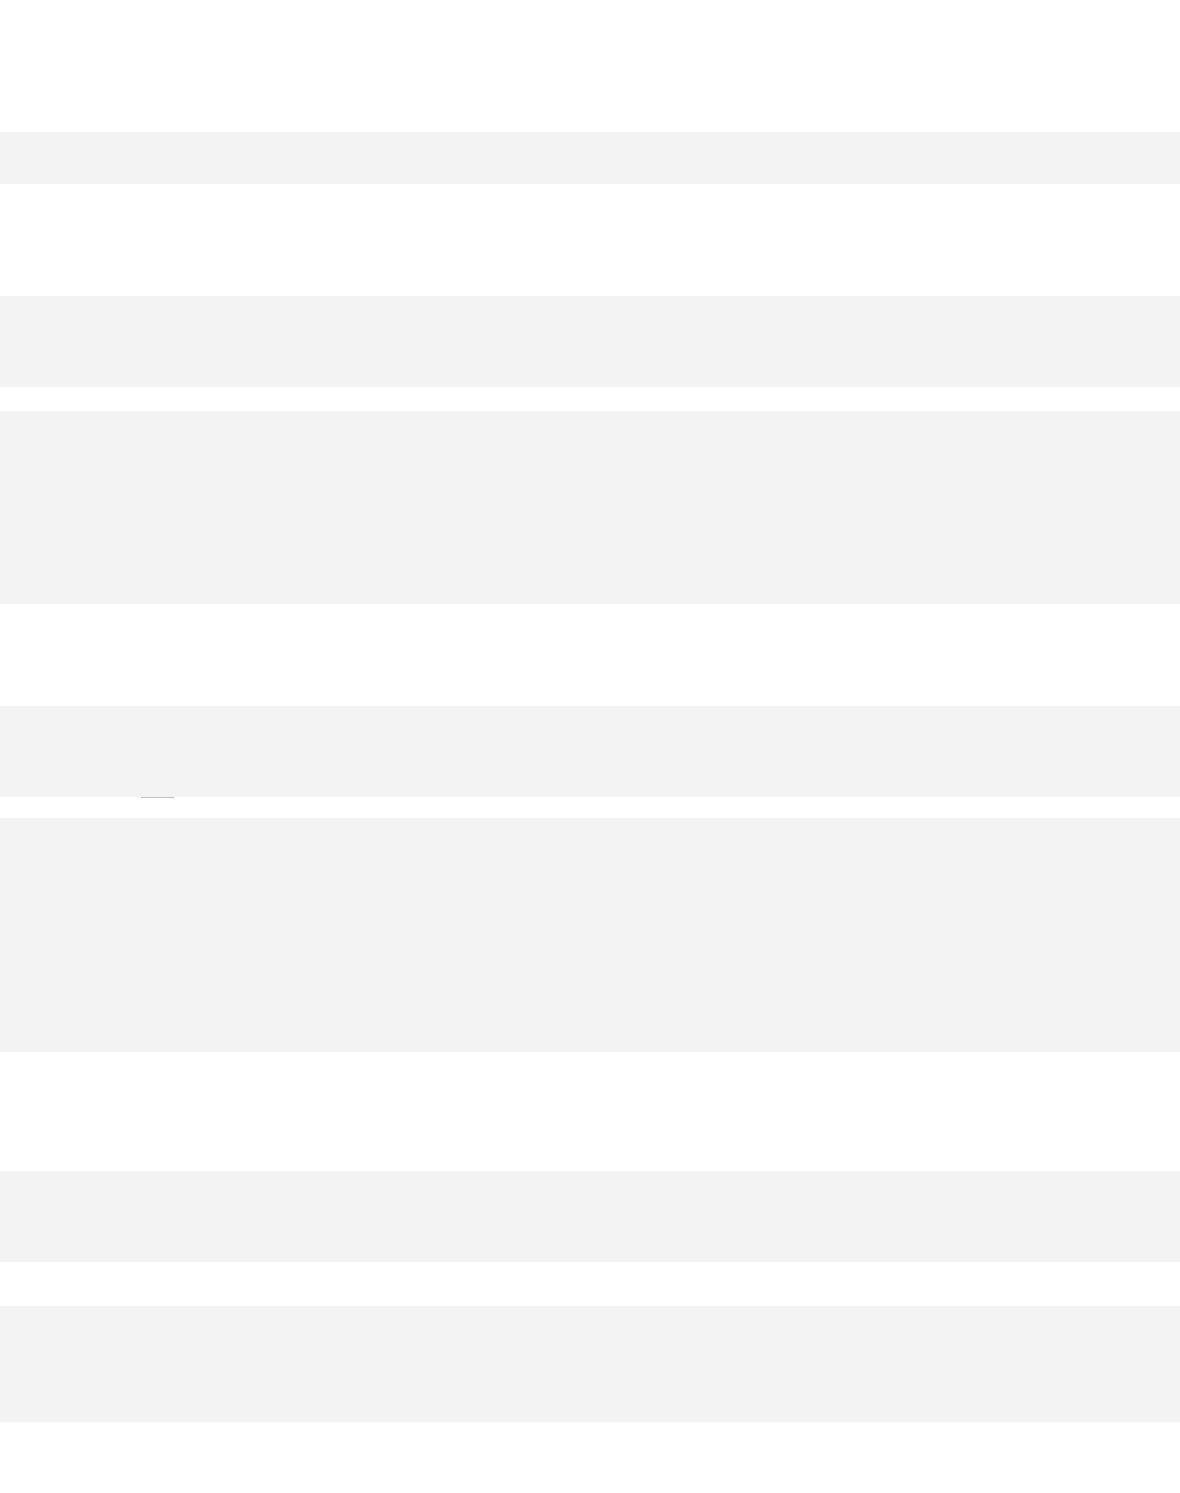
63.
Which of the diagrams correctly portrays the demand (D) and marginal revenue (MR) curves
of a purely competitive seller?
12–36
Copyright © 2018 McGraw-Hill Education. All rights reserved. No reproduction or distribution without the prior
written consent of McGraw-Hill Education.
Type: Graph
64.
Suppose that a pure monopolist can sell 20 units of output at $10 per unit and 21 units at
$9.75 per unit. The marginal revenue of the 21st unit of
output is
65.
The MR = MC rule
66.
In the long run, a pure monopolist will maximize profits by producing that output at
which marginal cost is equal to
12–37
Copyright © 2018 McGraw-Hill Education. All rights reserved. No reproduction or distribution without the prior
written consent of McGraw-Hill Education.
Blooms: Understand
D iffi c ul t y : 02 Medium
Learning Objective: 12–04 Explain how a pure monopoly sets its profit-maximizing output and
price.
Test Bank: I
To p i c : Output and Price Determination
67.
An unregulated pure monopolist will maximize profits by producing that output at which
68.
Suppose that a pure monopolist can sell 5 units of output at $4 per unit and 6 units at
$3.90 per unit. The monopolist will produce and sell the sixth
unit if its marginal cost is
69.
Suppose that a pure monopolist can sell 4 units of output at $2 per unit and 5 units at
$1.75 per unit. The monopolist will produce and sell the fifth
unit if its marginal cost is
12–38
Copyright © 2018 McGraw-Hill Education. All rights reserved. No reproduction or distribution without the prior
written consent of McGraw-Hill Education.
B.
$.75 or less.
C.
$1.75 or less.
D.
$2 or less.
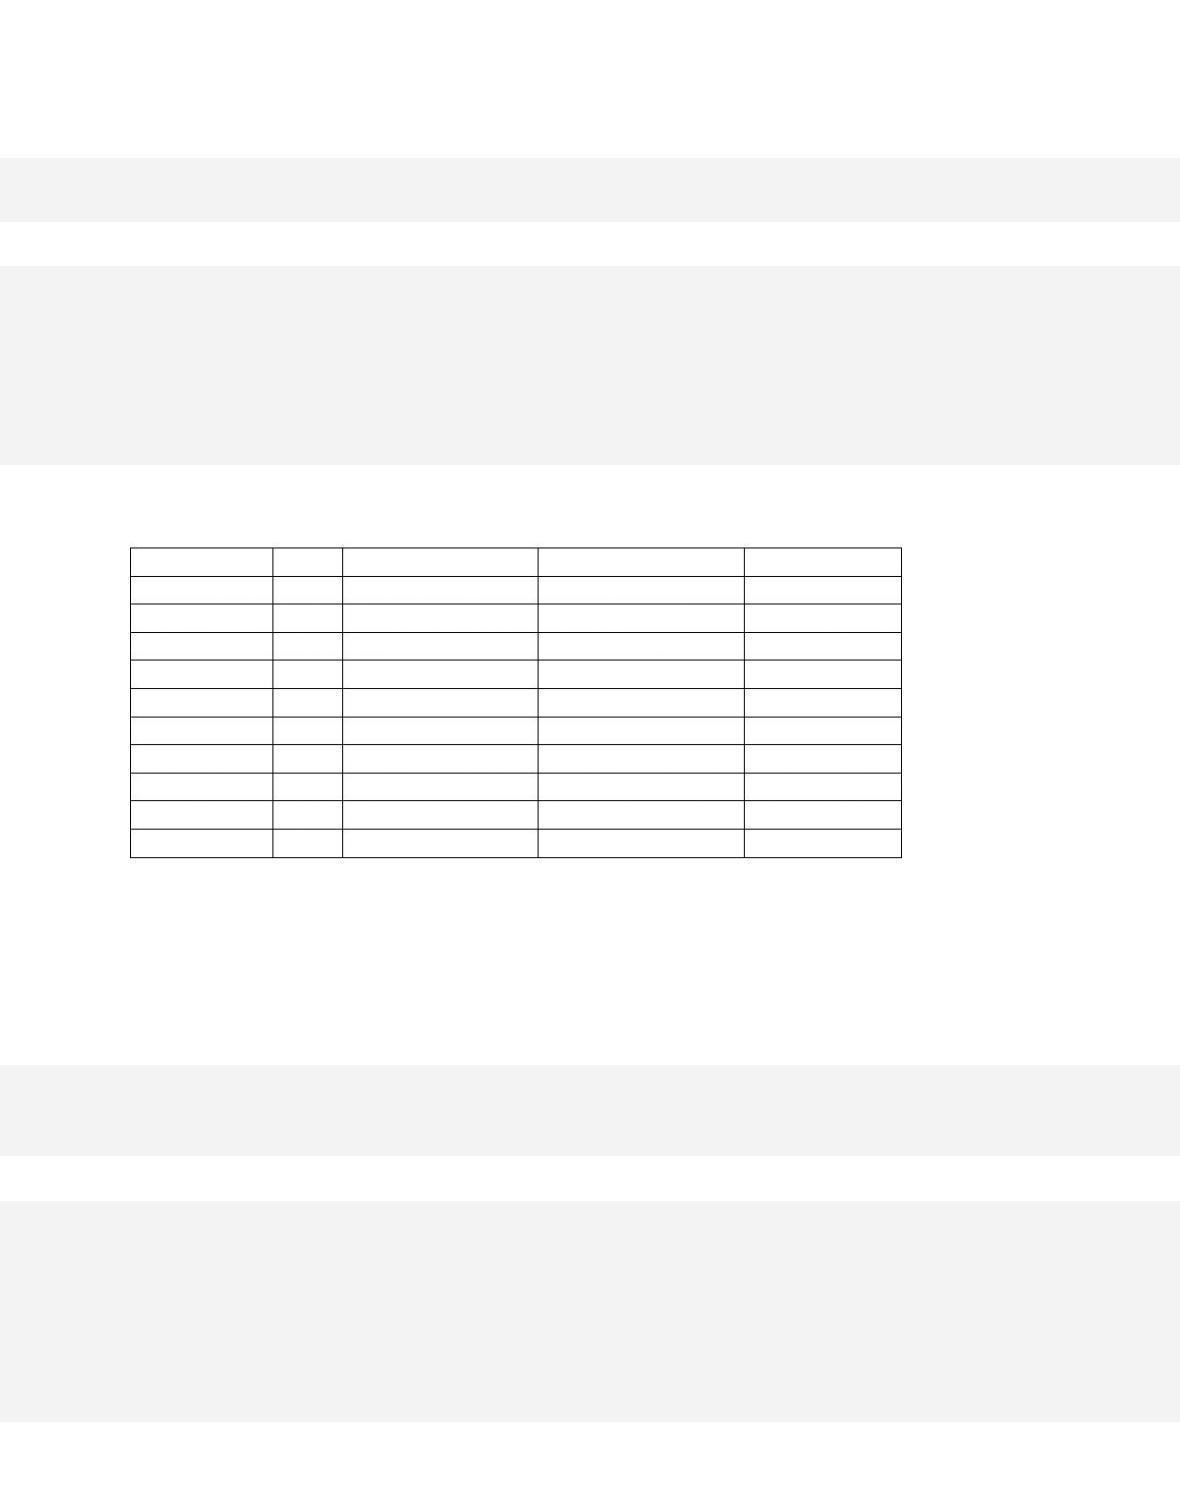
70.
Total Output
Price
Marginal Revenue
Average Total Cost
Marginal Cost
1
$100
$100
$100.00
$30
2
90
80
63.00
26
3
80
60
52.67
32
4
70
40
49.50
40
5
60
20
49.60
50
6
50
0
50.00
52
7
40
-20
52.29
66
8
30
-40
55.75
80
9
20
-60
60.67
100
10
10
-80
67.60
130
Refer to the data for a non discriminating monopolist. This firm will maximize its profit by
producing
12–39
Copyright © 2018 McGraw-Hill Education. All rights reserved. No reproduction or distribution without the prior
written consent of McGraw-Hill Education.
To p i c : Output and Price Determination
Type: Table
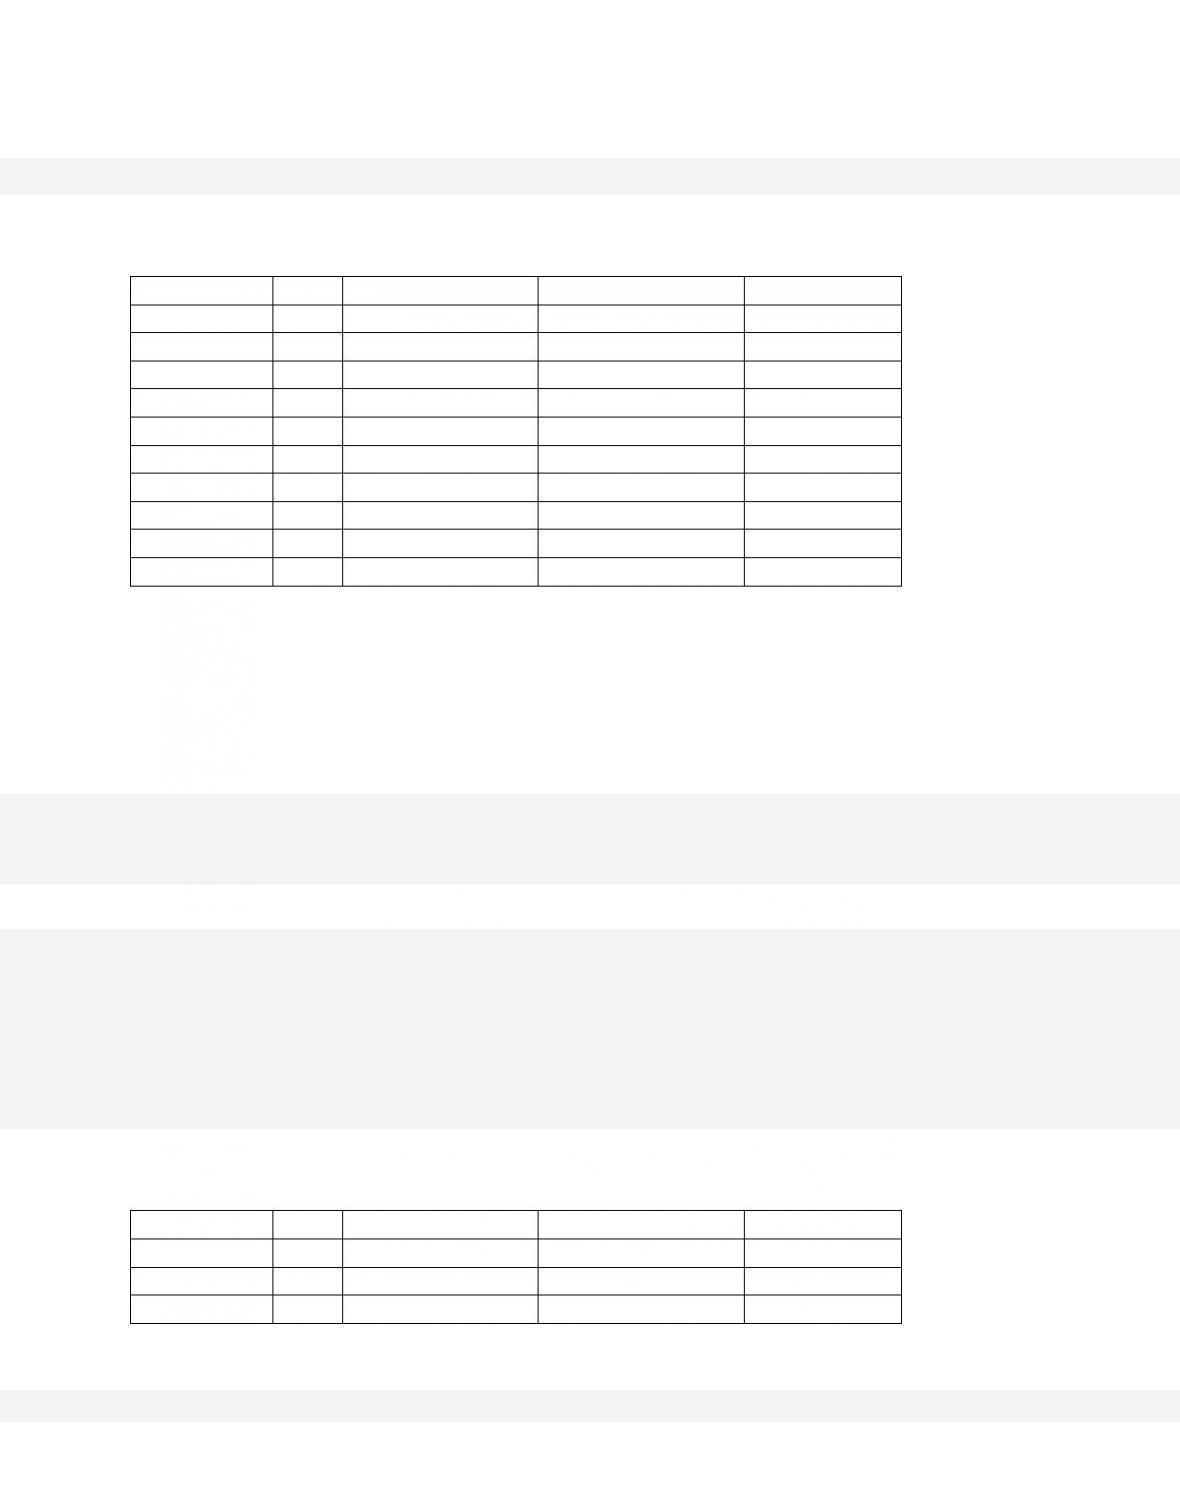
71.
Total Output
Price
Marginal Revenue
Average Total Cost
Marginal Cost
1
$100
$100
$100.00
$30
2
90
80
63.00
26
3
80
60
52.67
32
4
70
40
49.50
40
5
60
20
49.60
50
6
50
0
50.00
52
7
40
-20
52.29
66
8
30
-40
55.75
80
9
20
-60
60.67
100
10
10
-80
67.60
130
Refer to the data for a non discriminating monopolist. At its profit–maximizing output, this
firm will be operating in the
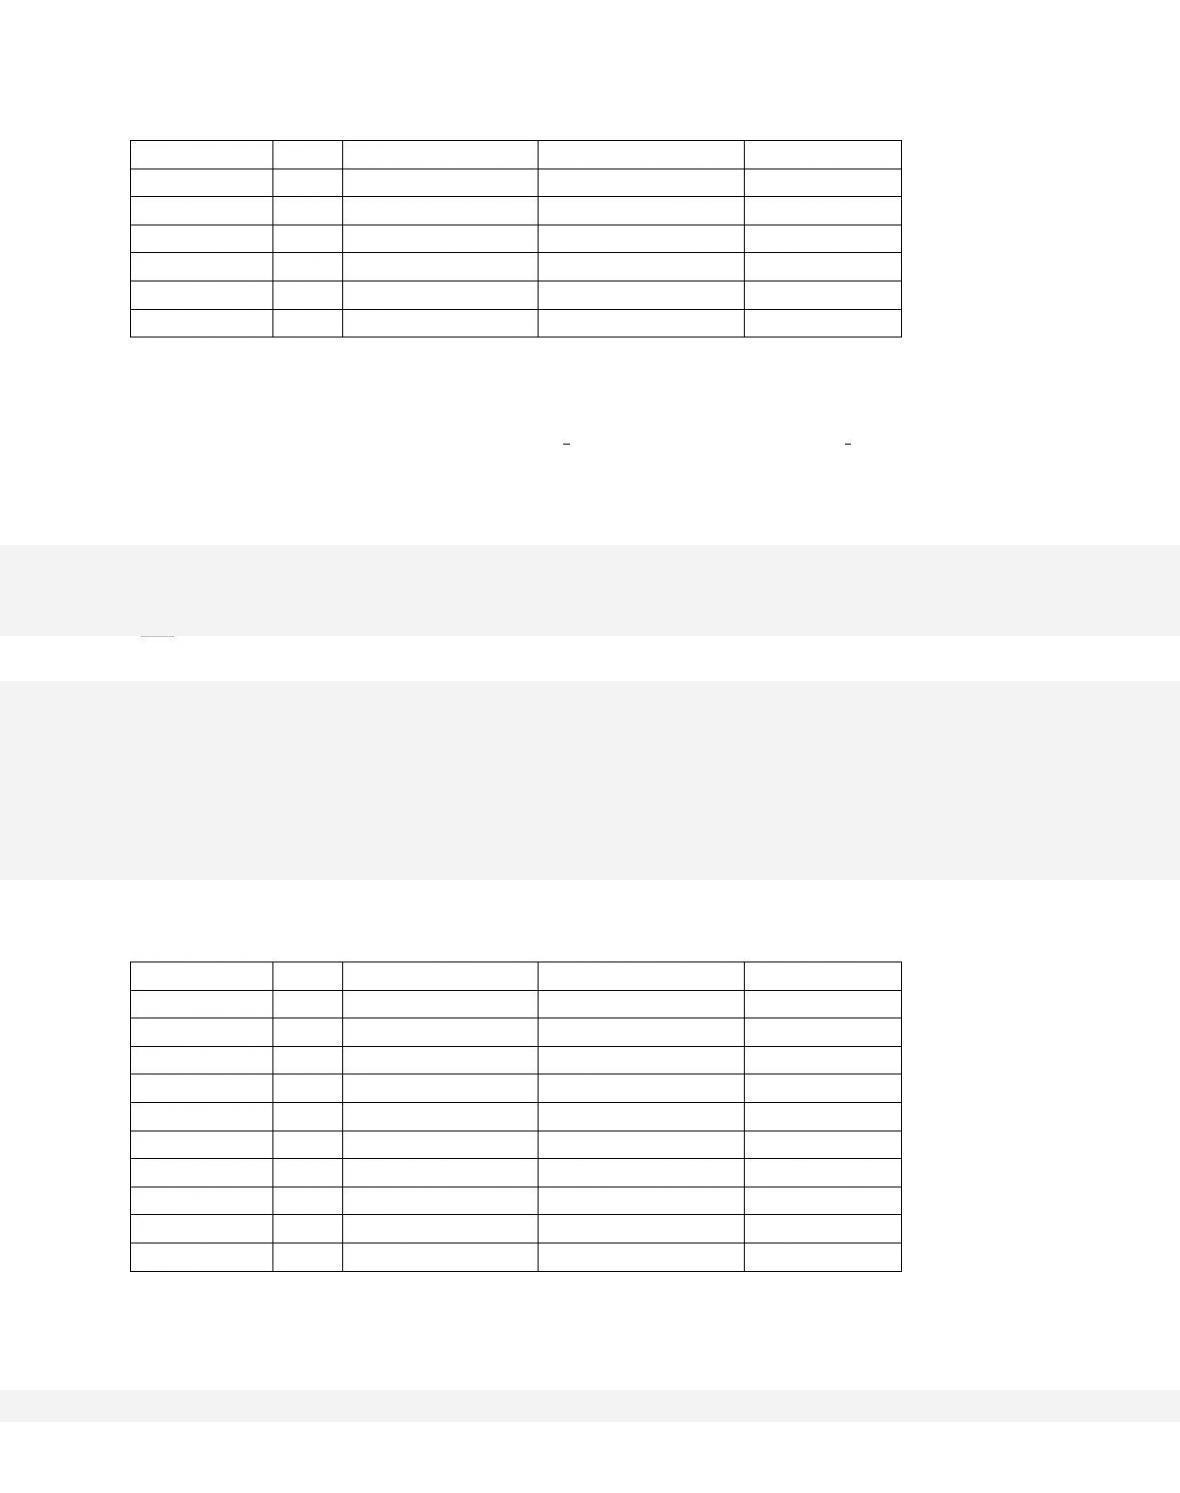
72.
Total Output
Price
Marginal Revenue
Average Total Cost
Marginal Cost
1
$100
$100
$100.00
$30
2
90
80
63.00
26
3
80
60
52.67
32
12–40
4
70
40
49.50
40
5
60
20
49.60
50
6
50
0
50.00
52
7
40
-20
52.29
66
8
30
-40
55.75
80
9
20
-60
60.67
100
10
10
-80
67.60
130
Refer to the data for a nondiscriminating monopolist. At its profit-maximizing output, this
firm’s price will exceed its marginal cost by and its
average total cost by .
73.
Total Output
Price
Marginal Revenue
Average Total Cost
Marginal Cost
1
$100
$100
$100.00
$30
2
90
80
63.00
26
3
80
60
52.67
32
4
70
40
49.50
40
5
60
20
49.60
50
6
50
0
50.00
52
7
40
-20
52.29
66
8
30
-40
55.75
80
9
20
-60
60.67
100
10
10
-80
67.60
130