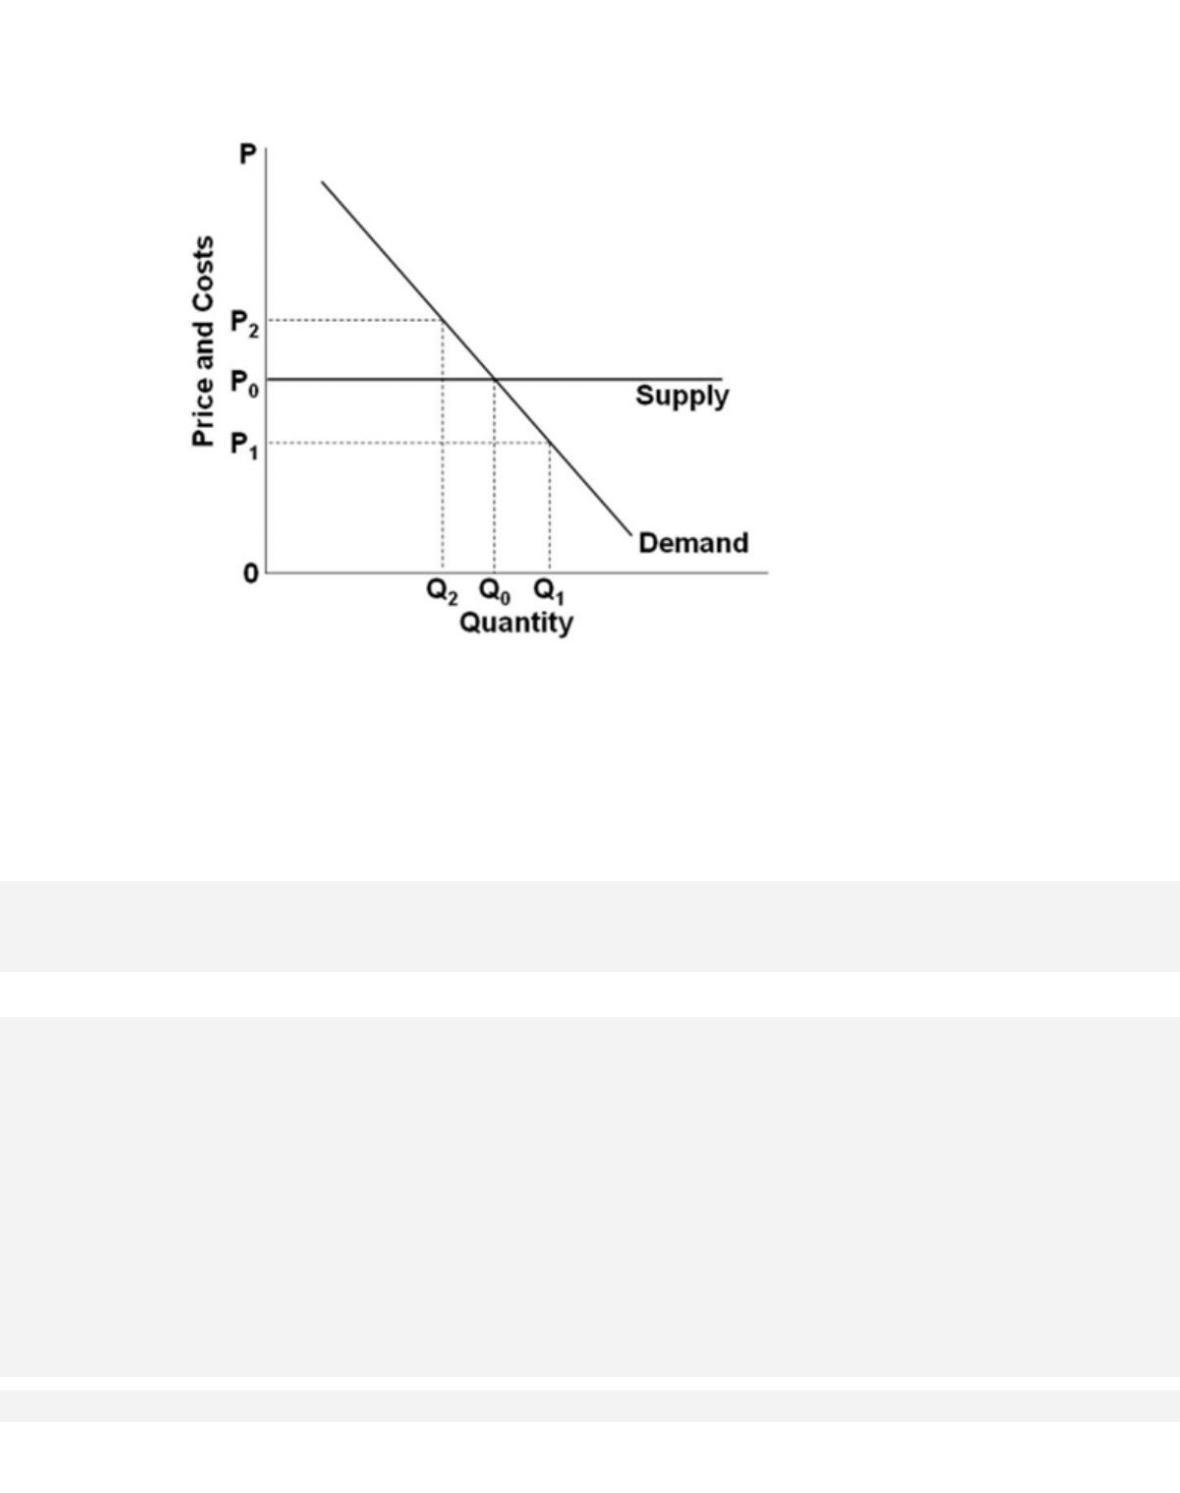
164.
The accompanying graph shows the long-run supply and demand curves in a purely competitive
market. The curves suggest that in this industry, the marginal benefit to consumers of each extra
unit of the product is
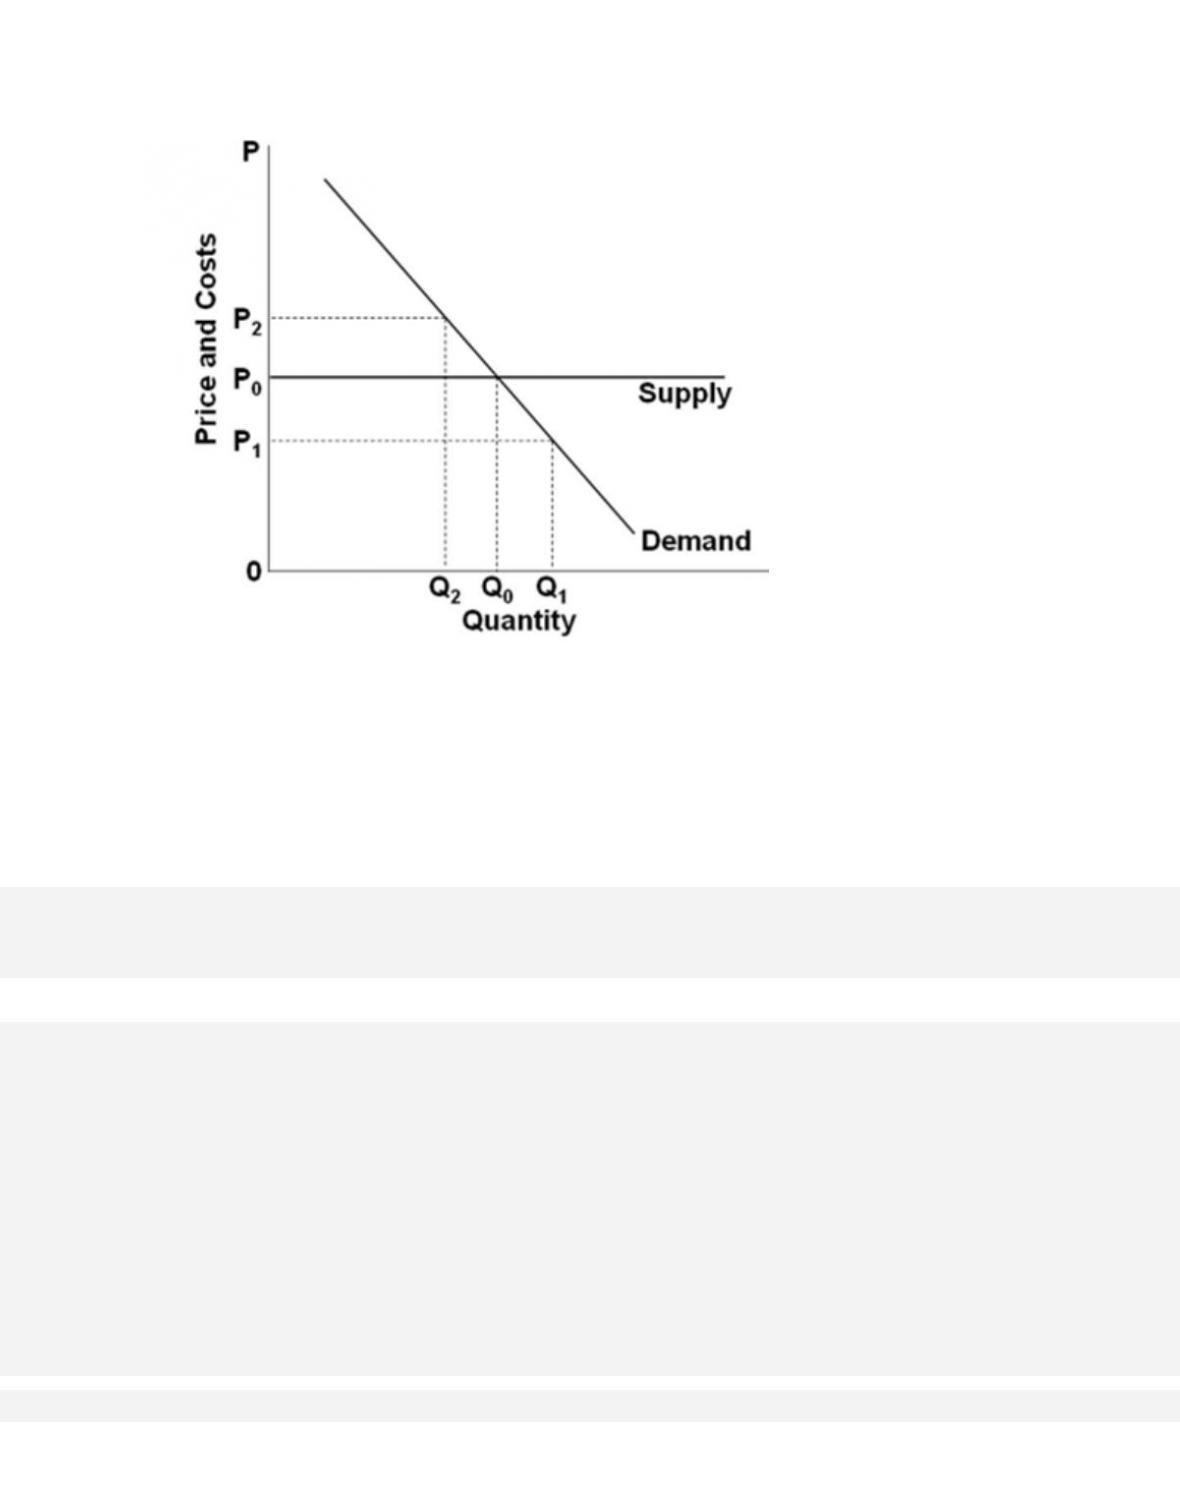
165.
The accompanying graph shows the long-run supply and demand curves in a purely competitive
market. The curves suggest that in this industry, the dollars’ worth of other products that have to
be sacrificed in order to produce each unit of the output of this industry is
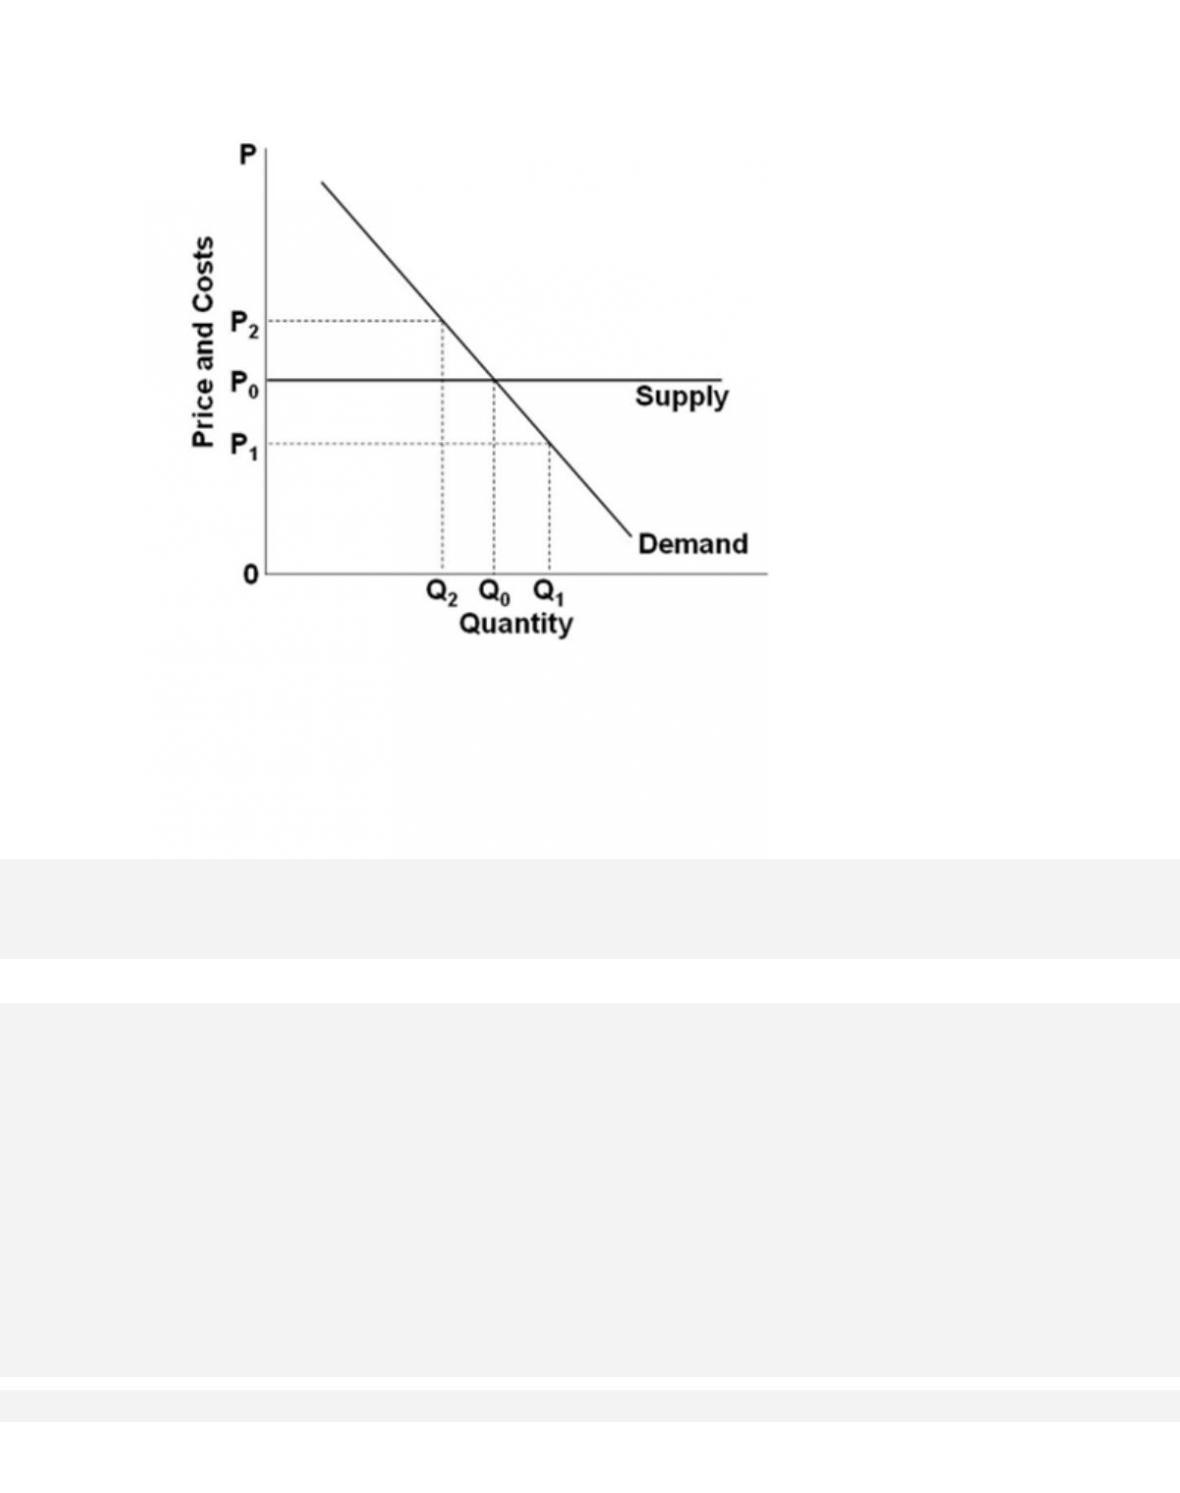
166.
The accompanying graph shows the long-run supply and demand curves in a purely competitive
market. We know that in this market, the marginal
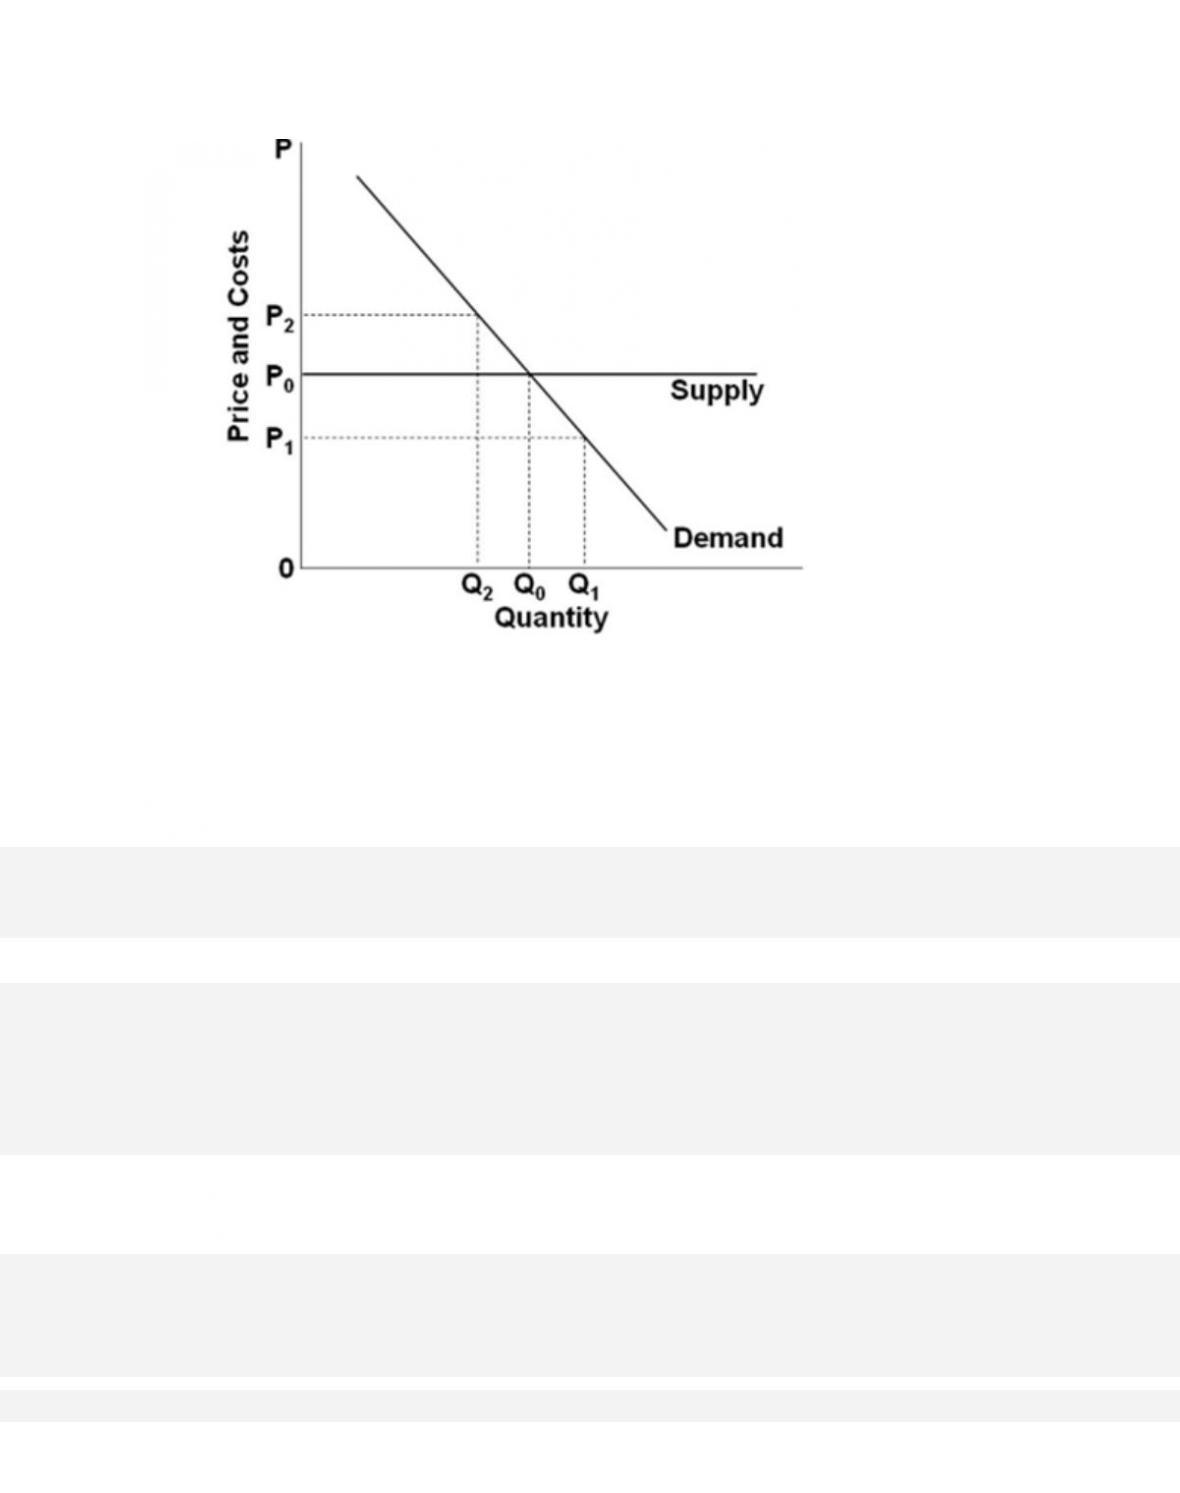
167.
The accompanying graph shows the long-run supply and demand curves in a purely competitive
market. We know that when this market reaches equilibrium, the marginal
168. In a purely competitive industry, an optimal allocation of scarce resources occurs when

169. The difference between the maximum price a consumer is willing to pay for a product and
the actual price the consumer pays is
170. The difference between the actual price that a producer receives and the minimum
acceptable price a producer is willing to accept is

171. After long-run adjustments, a purely competitive market achieves
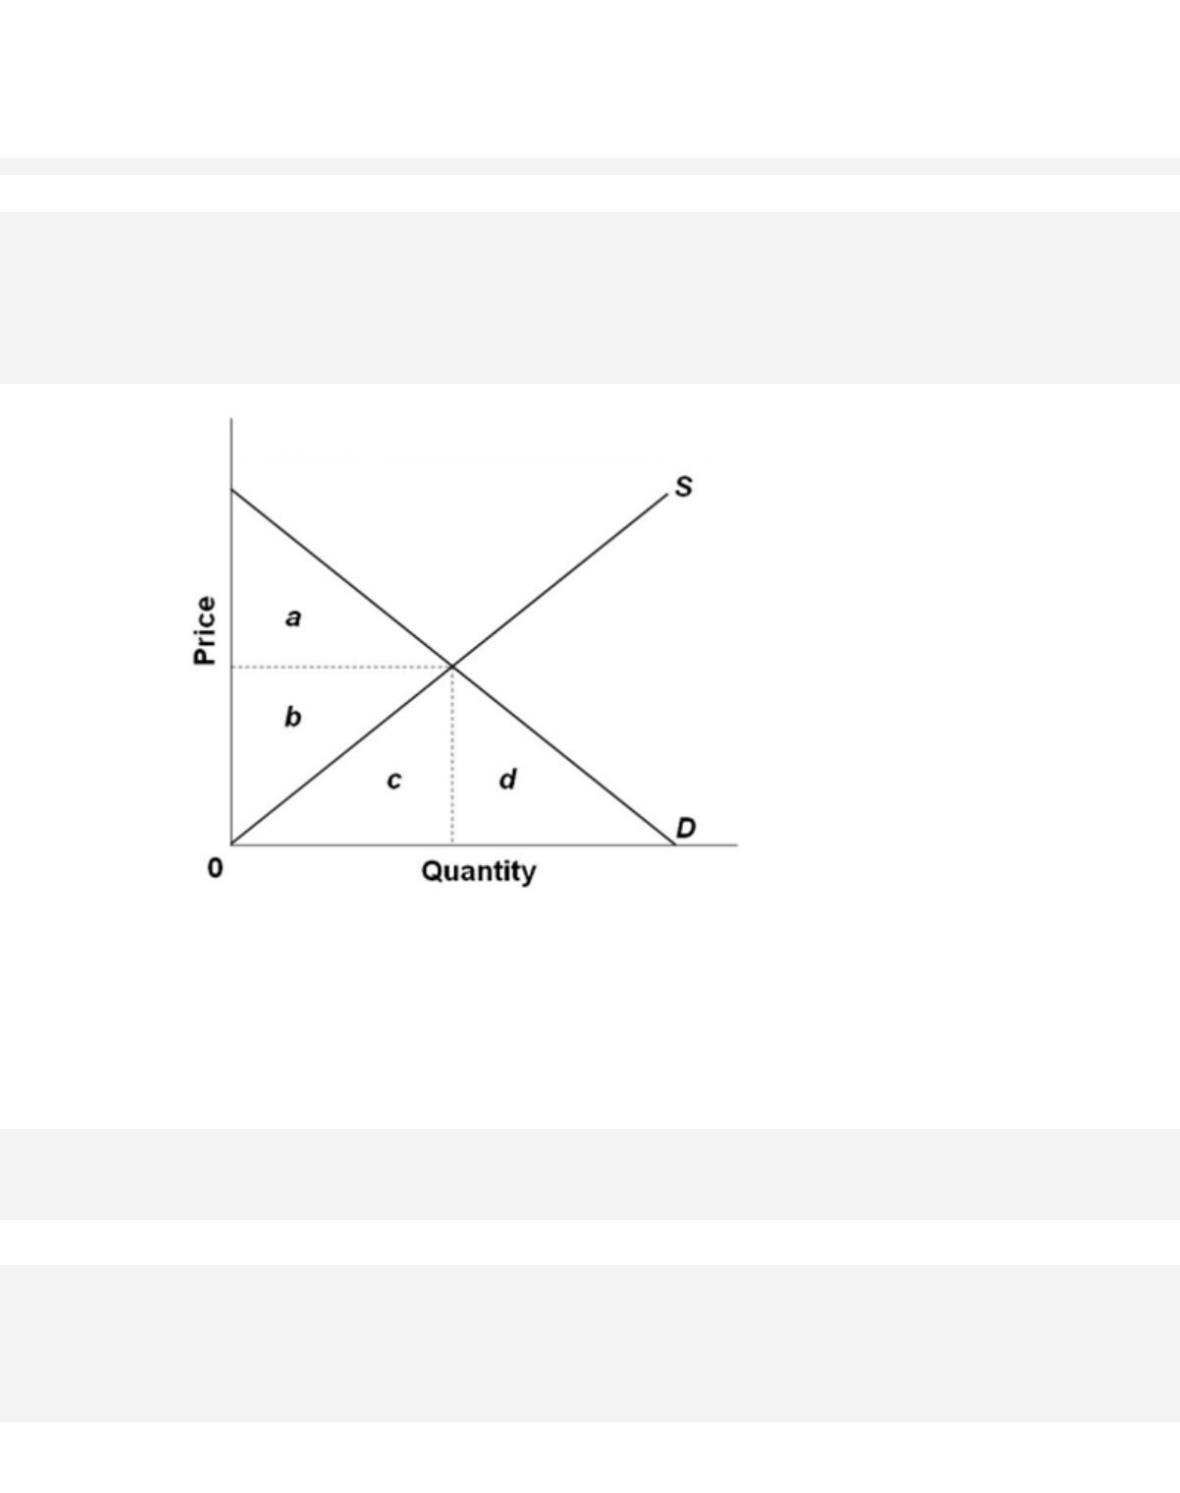
172.
The accompanying graph represents the purely competitive market for a product. When the
market is at equilibrium, the consumer surplus would be represented by the area
11–87
Copyright © 2018 McGraw-Hill Education. All rights reserved. No reproduction or distribution without the prior
written consent of McGraw-Hill Education.
D. b + c.
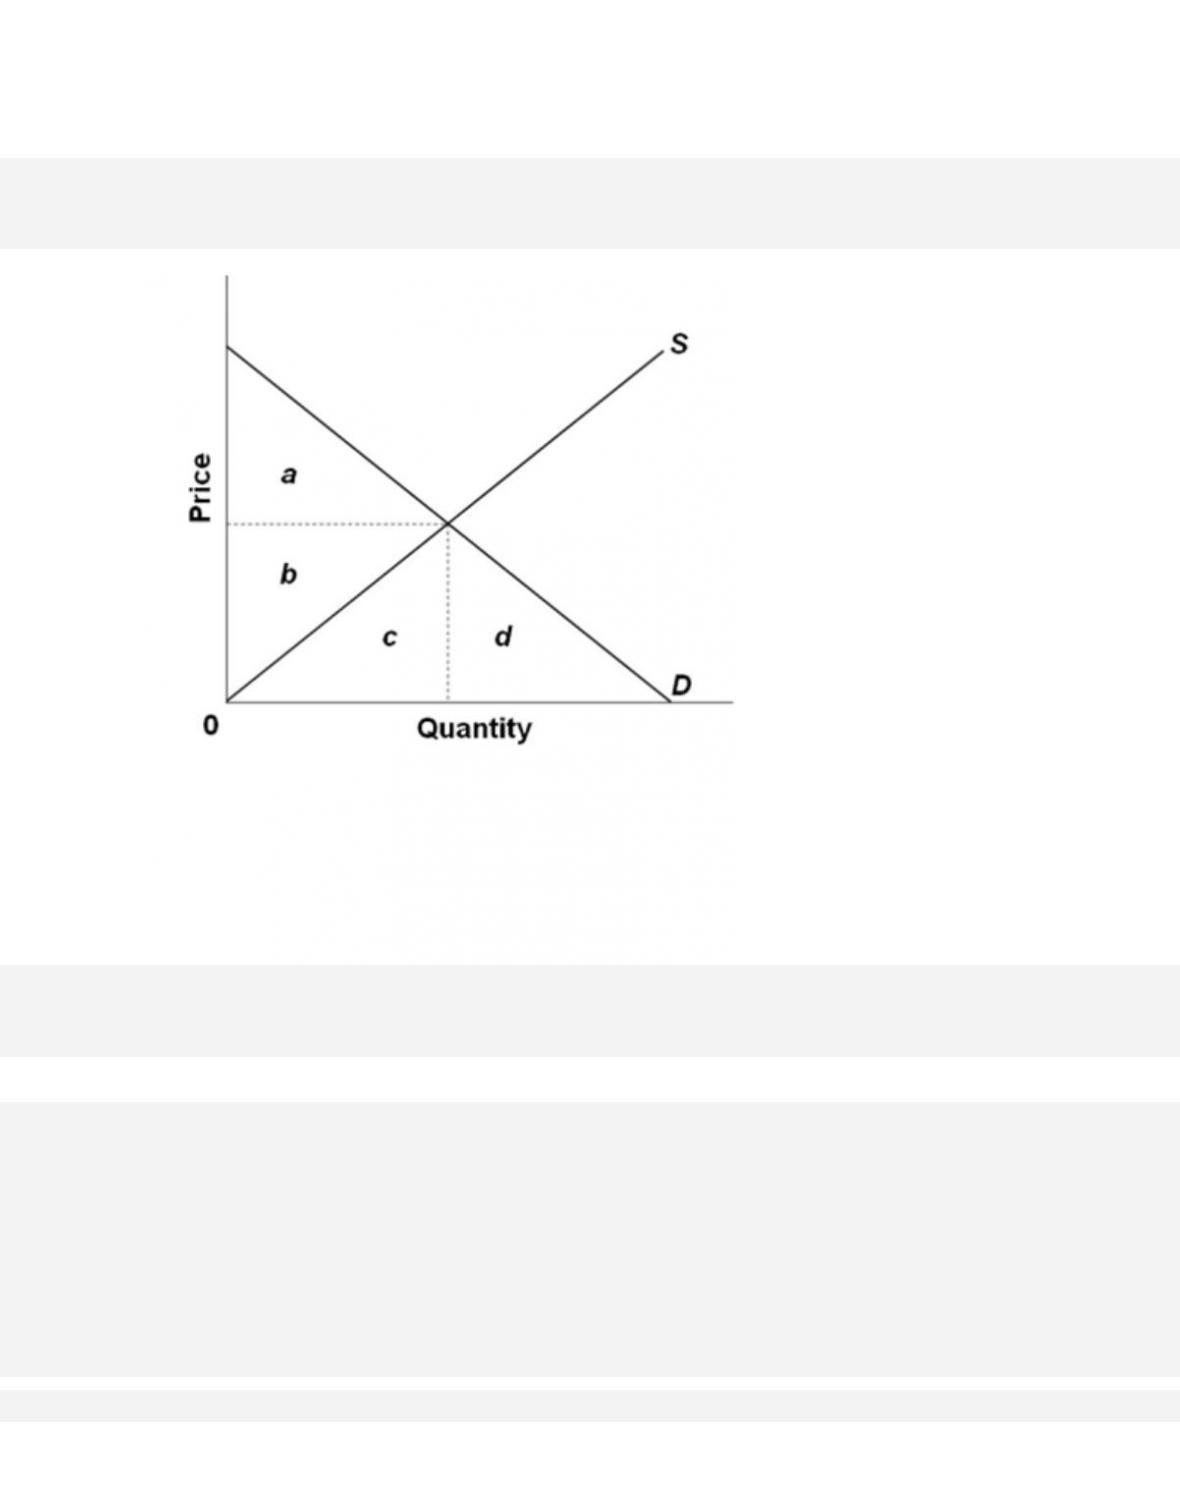
173.
The accompanying graph represents the purely competitive market for a product. When the
market is at equilibrium, the value of the total benefits derived by consumers from this product
would be represented by the area
11–88
Copyright © 2018 McGraw-Hill Education. All rights reserved. No reproduction or distribution without the prior
written consent of McGraw-Hill Education.
Learning Objective: 11-04 Show how long-run equilibrium in pure competition produces an
efficient allocation of resources.
Test Bank: II
Topic:
Pure Competition and Efficiency
174.
The accompanying graph represents the purely competitive market for a product. When the
market is at equilibrium, the producer surplus would be represented by the area
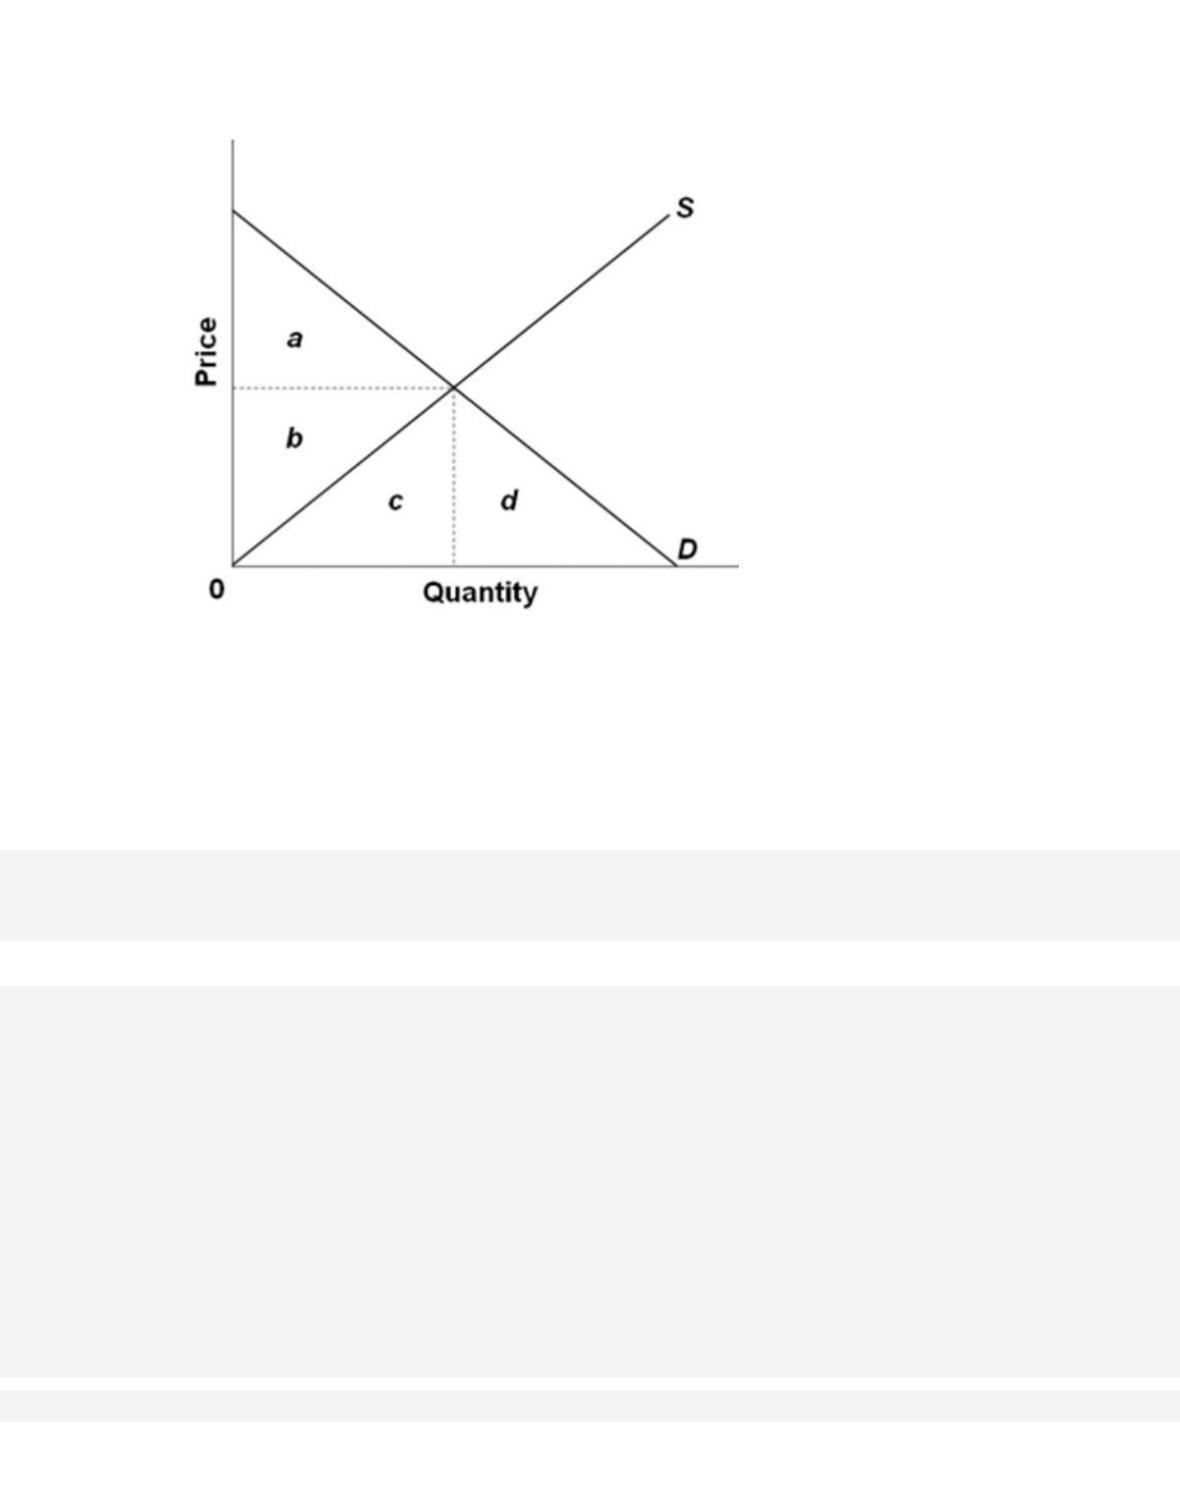
175.
The accompanying graph represents the purely competitive market for a product. When the
market is at equilibrium, the total opportunity cost of producing the equilibrium output level
would be represented by the area
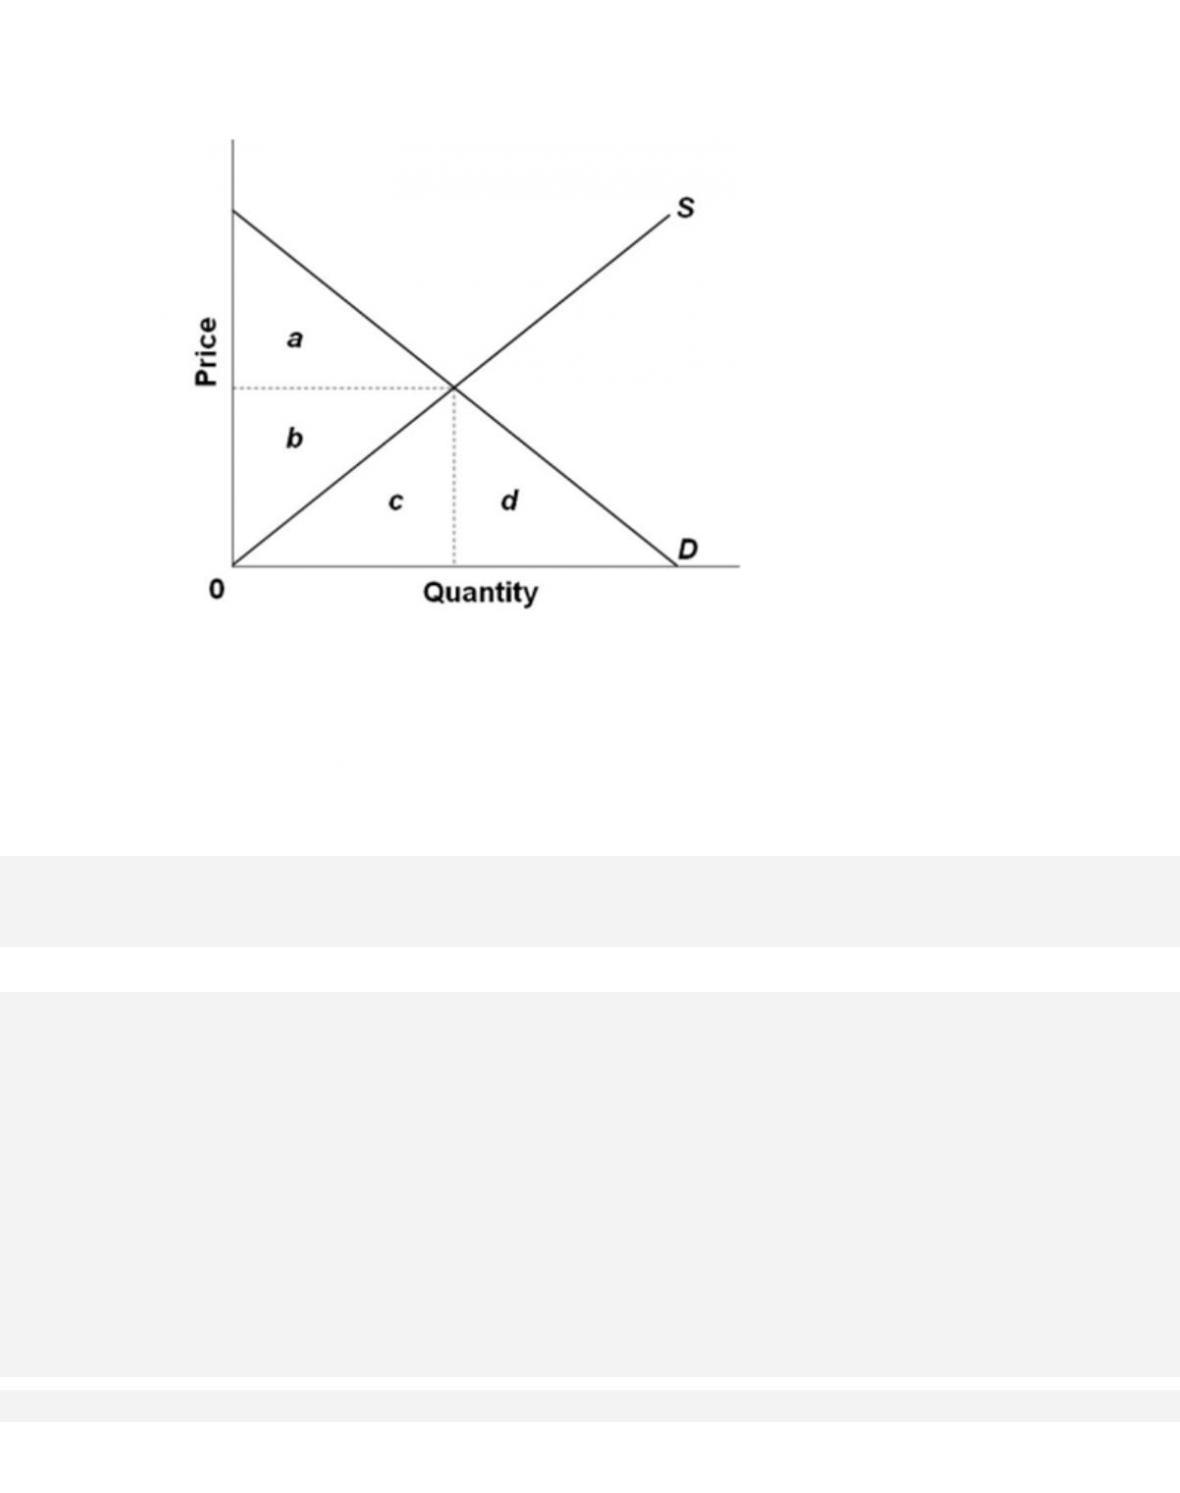
176.
The accompanying graph represents the purely competitive market for a product. When the
market is at equilibrium, the total revenues from selling the equilibrium output level would be
represented by the area
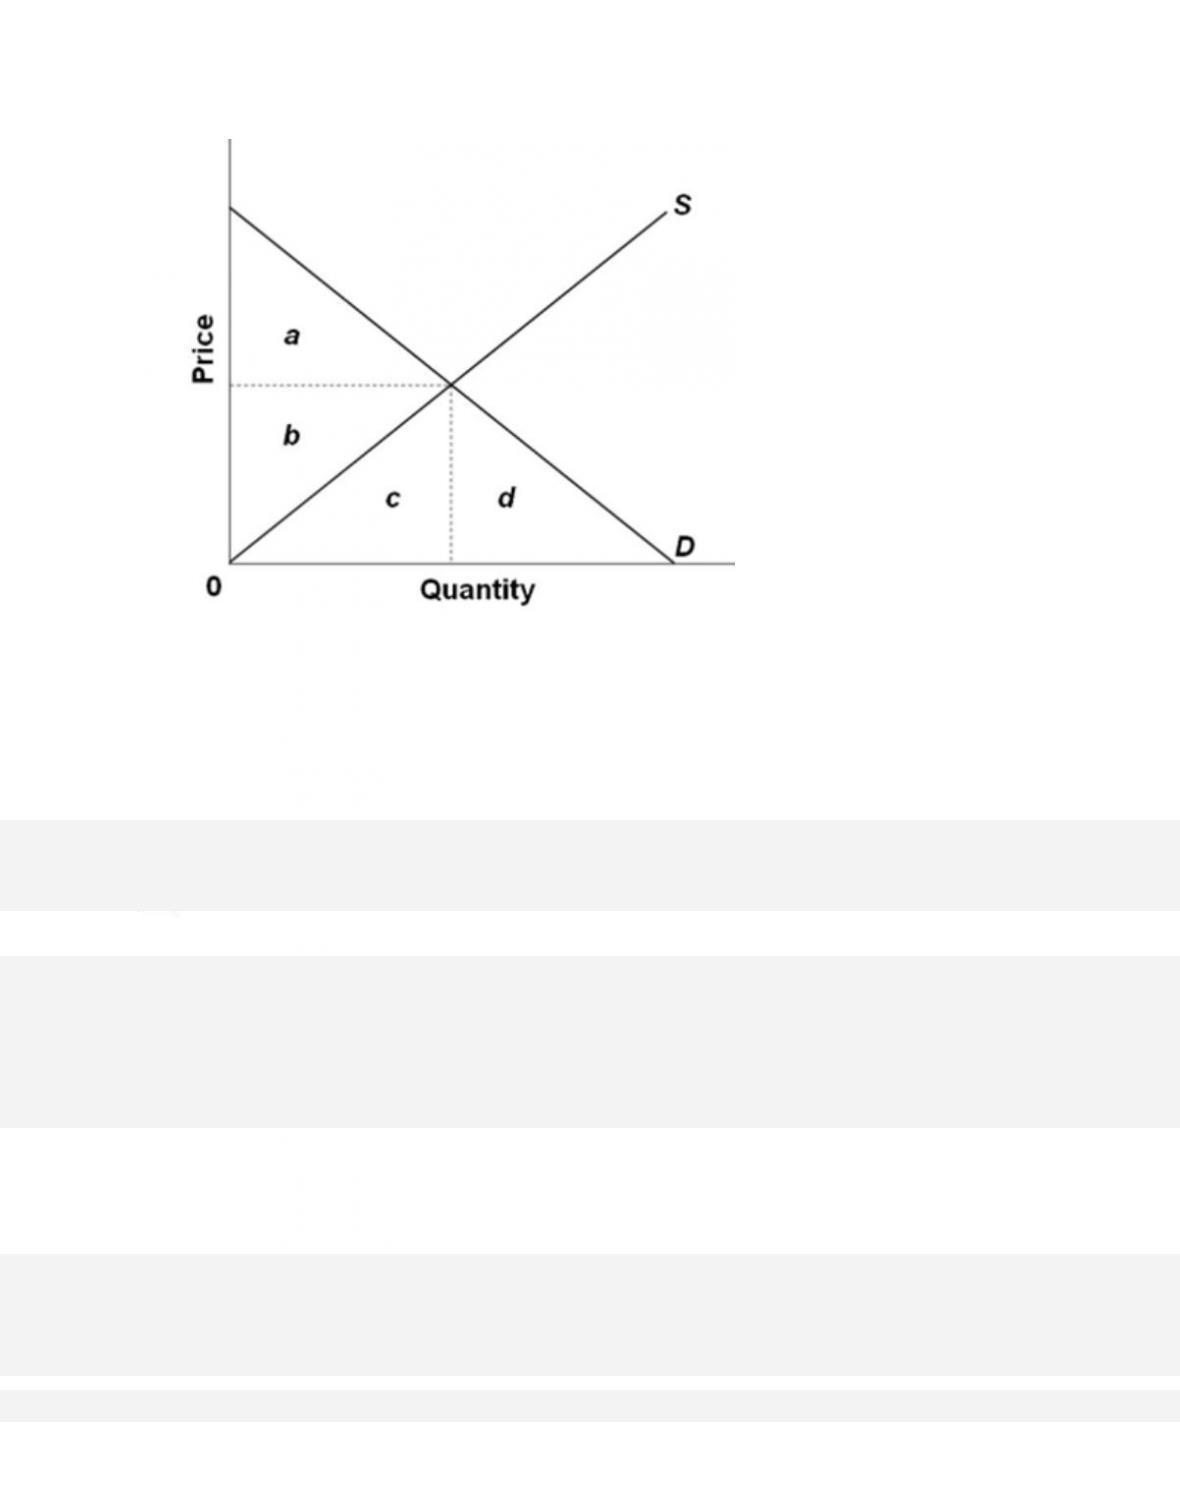
177.
The accompanying graph represents the purely competitive market for a product. When the
market is at equilibrium, the deadweight loss would be
178. If there is allocative efficiency in a purely competitive market for a product, the maximum
price consumers are willing to pay is

179. When there is allocative efficiency in a purely competitive market for a product, the
minimum price producers are willing to accept is
180. In a purely competitive market at its long-run equilibrium, which of the following is not
true?

11–93
Copyright © 2018 McGraw-Hill Education. All rights reserved. No reproduction or distribution without the prior
written consent of McGraw-Hill Education.
Test Bank: II
Topic:
Pure Competition and Efficiency
181. The “invisible hand” in a competitive market pushes the firms in the market to
182. If a competitive firm successfully adopts a better production technology ahead of the others,
then
183. Competitive firms will always try to earn more than a normal profit by doing the following
except

11–94
Copyright © 2018 McGraw-Hill Education. All rights reserved. No reproduction or distribution without the prior
written consent of McGraw-Hill Education.
Ac c e s s ib i l i t y:
Keyboard Navigation
Blooms: Understand
Diffi culty :
02 Medium
Learning Objective: 11–05 Discuss creative destruction and the profit incentives for innovation.
Test Bank: II
Topic:
Technological Advance and Competition
184. Creative destruction is most often associated with
185. Creative destruction is illustrated by which of the following pairs of products?
186. So-called creative destruction leads to all of the following except