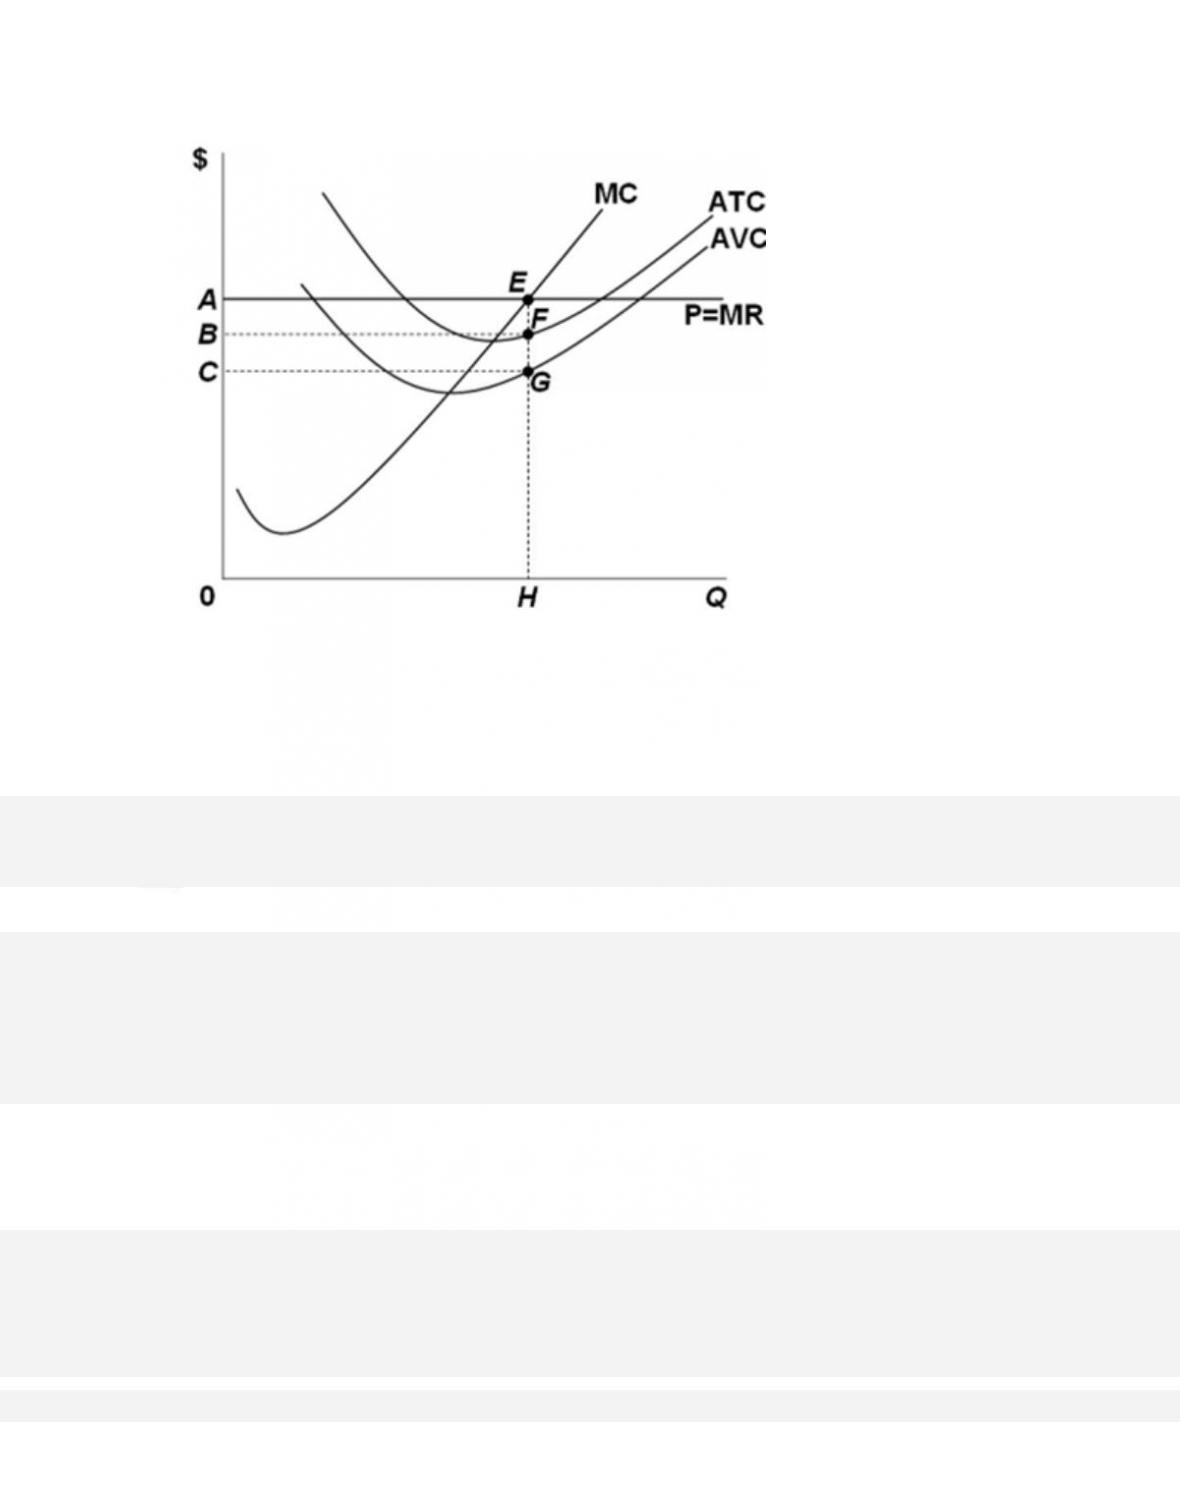
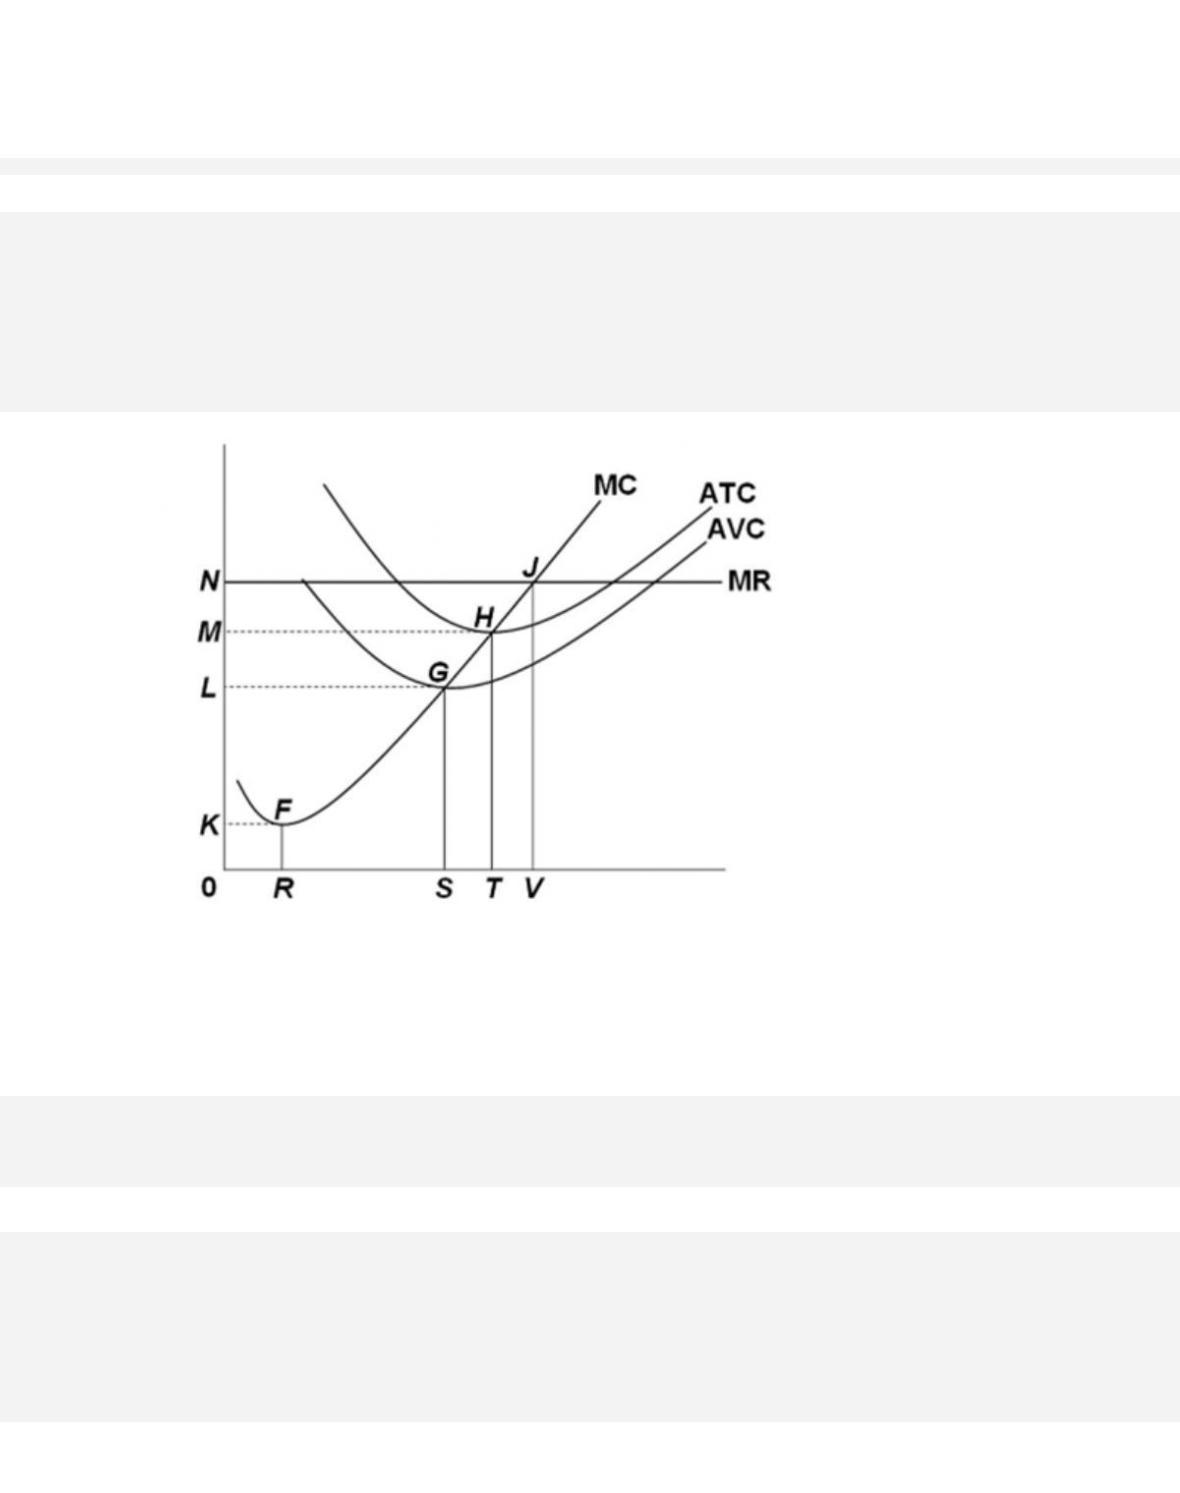
244.
At output level H in the provided graph, the area
245. A purely competitive firm will be willing to produce even at a loss in the short run, as
long as
10-142
Copyright © 2018 McGraw-Hill Education. All rights reserved. No reproduction or distribution without the prior
written consent of McGraw-Hill Education.
AACSB: Knowledge Application
A c c e s s i b i l i t y :
Keyboard Navigation
Blooms: Understand
D i f f i c u l t y:
02 Medium
Learning Objective: 10–06 Explain why a competitive firms marginal cost curve is the same as
its supply curve.
Test Bank: II
Topic:
Marginal Cost and Short-Run Supply
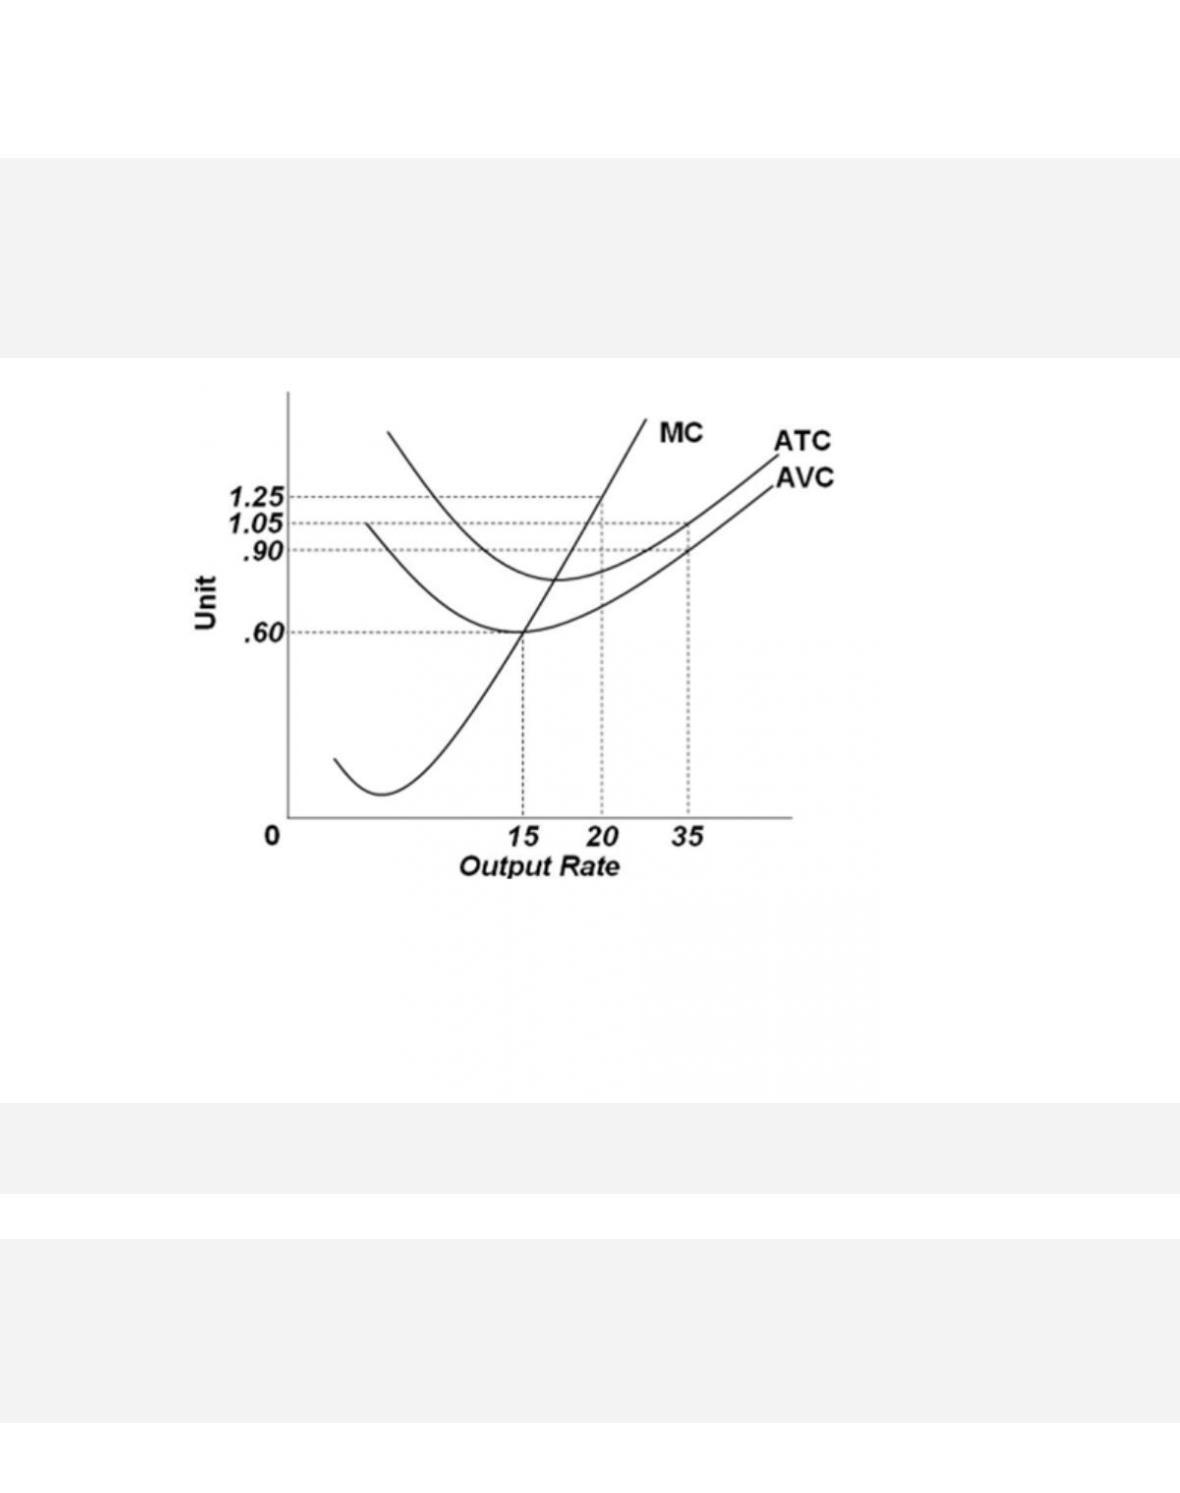
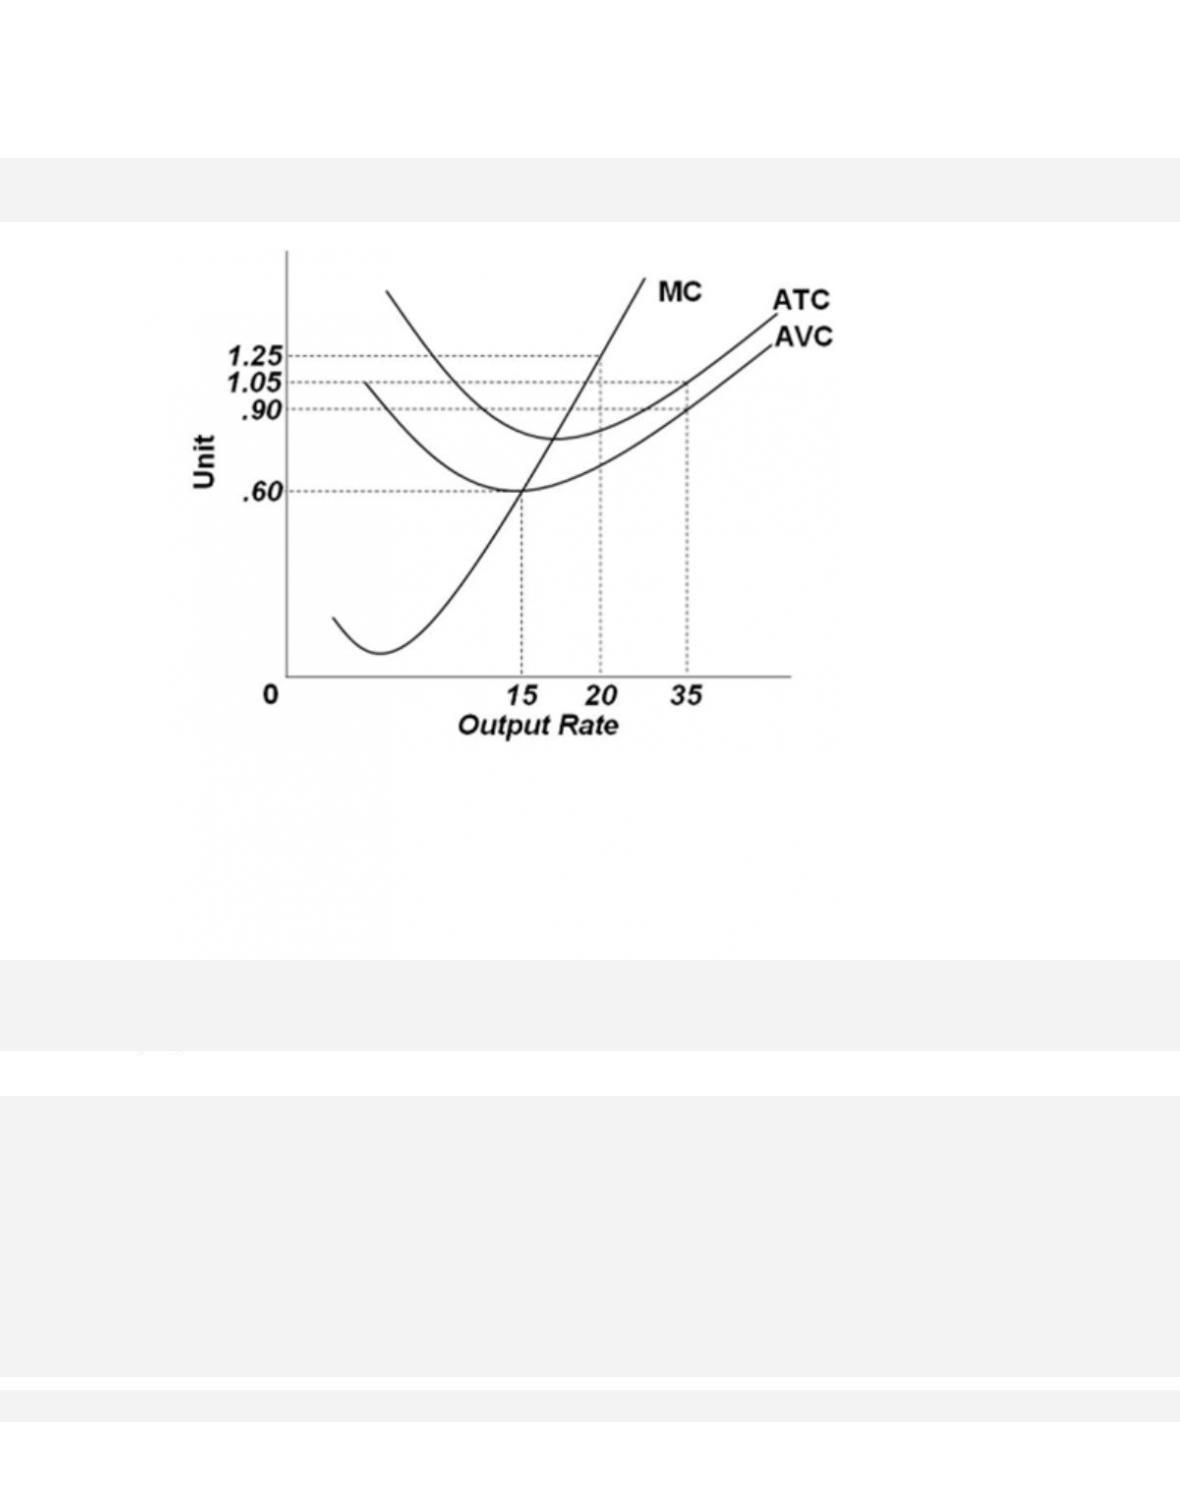
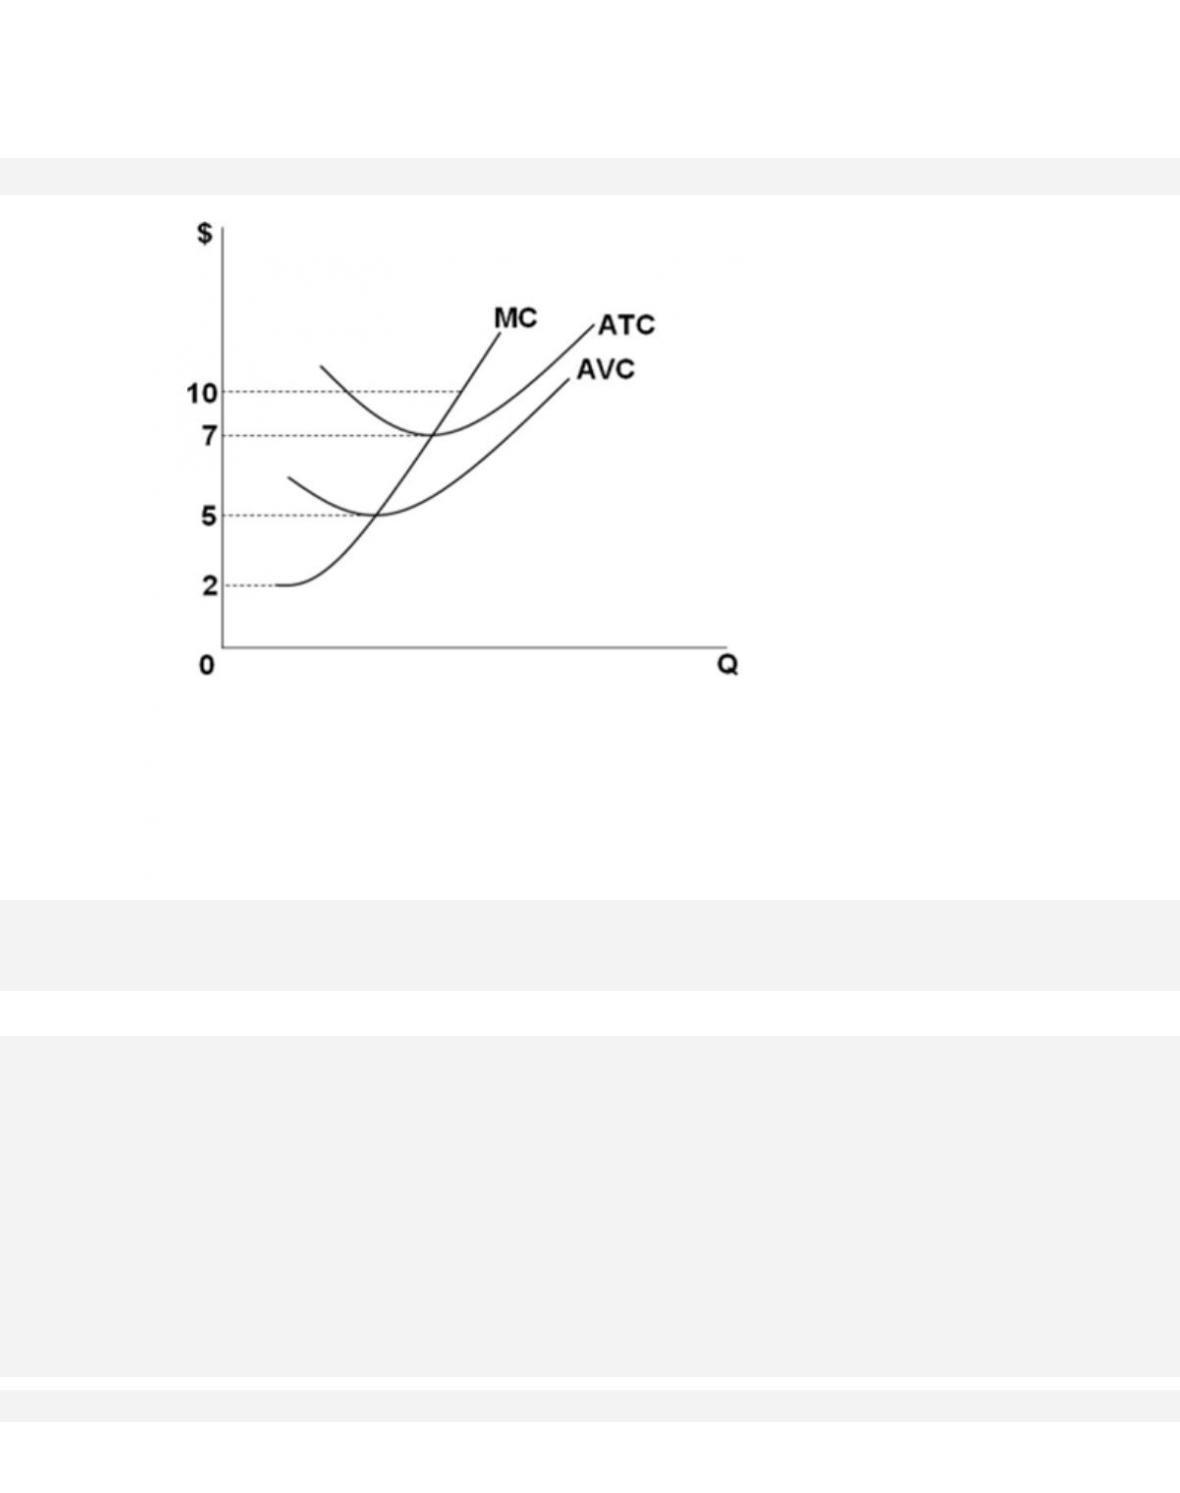
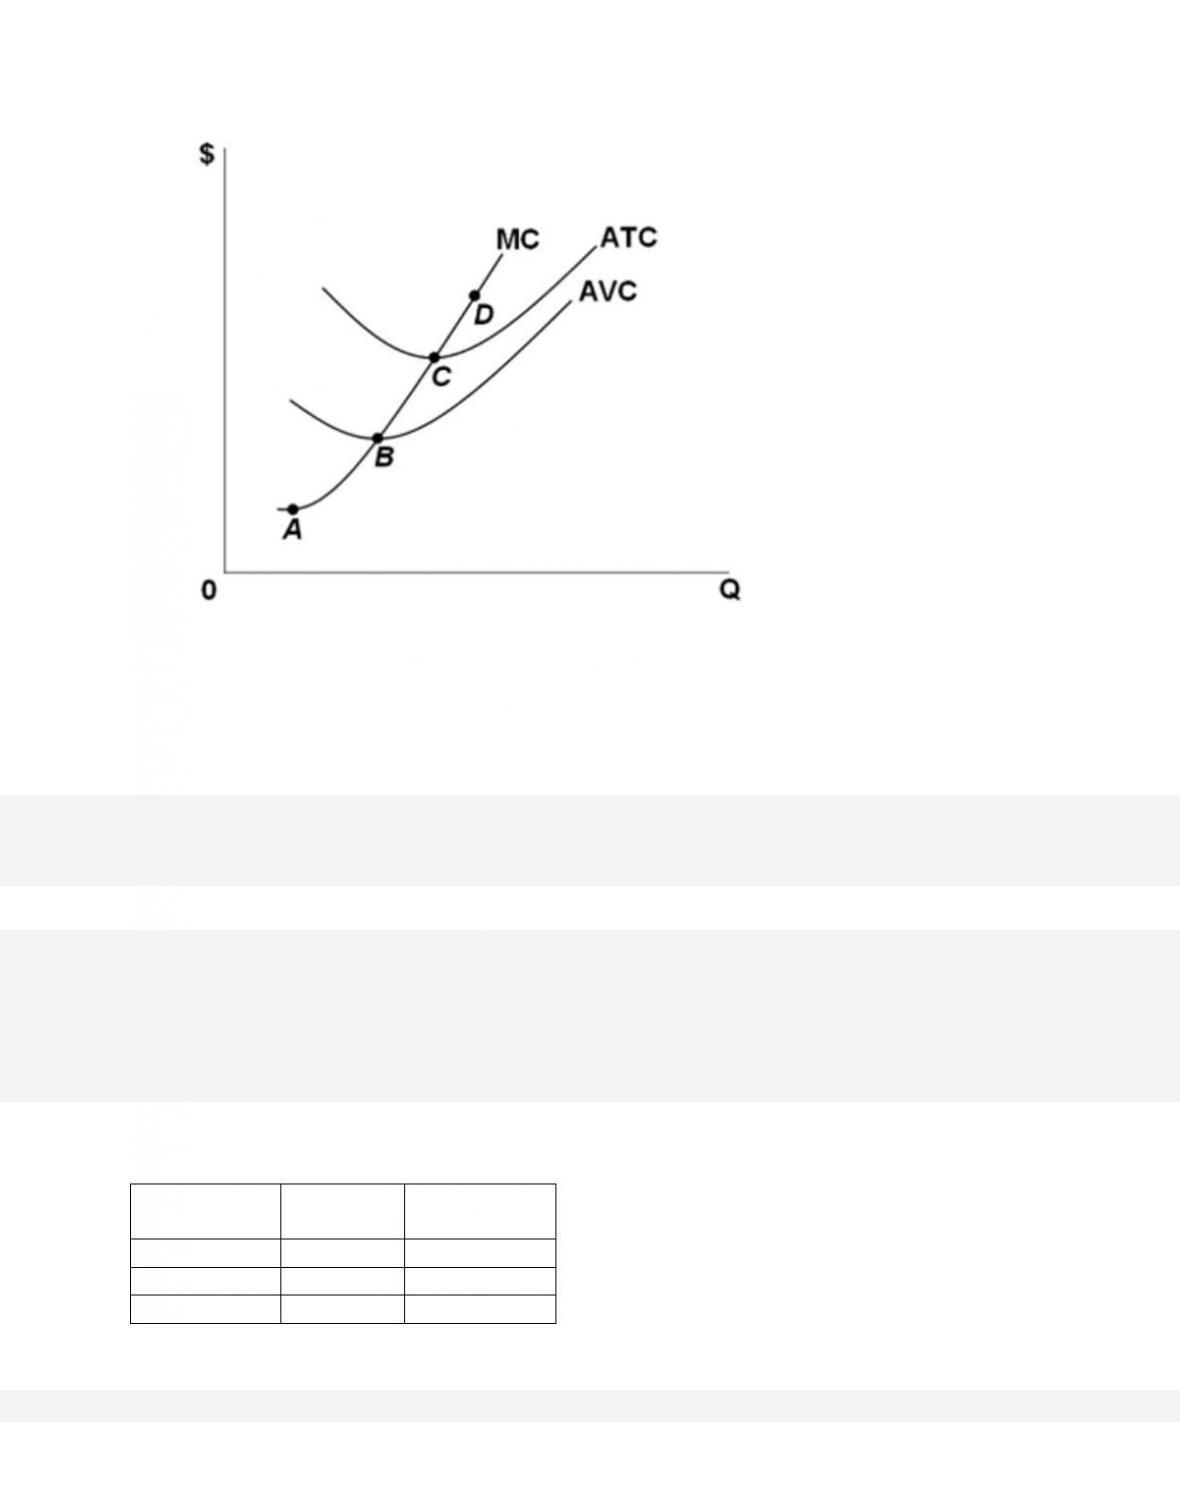
246.
The accompanying graph shows the cost curves for a competitive firm. If the market price falls
to $0.55, the optimal output is
10-143
Copyright © 2018 McGraw-Hill Education. All rights reserved. No reproduction or distribution without the prior
written consent of McGraw-Hill Education.
its supply curve.
Test Bank: II
Topic:
Marginal Cost and Short-Run Supply
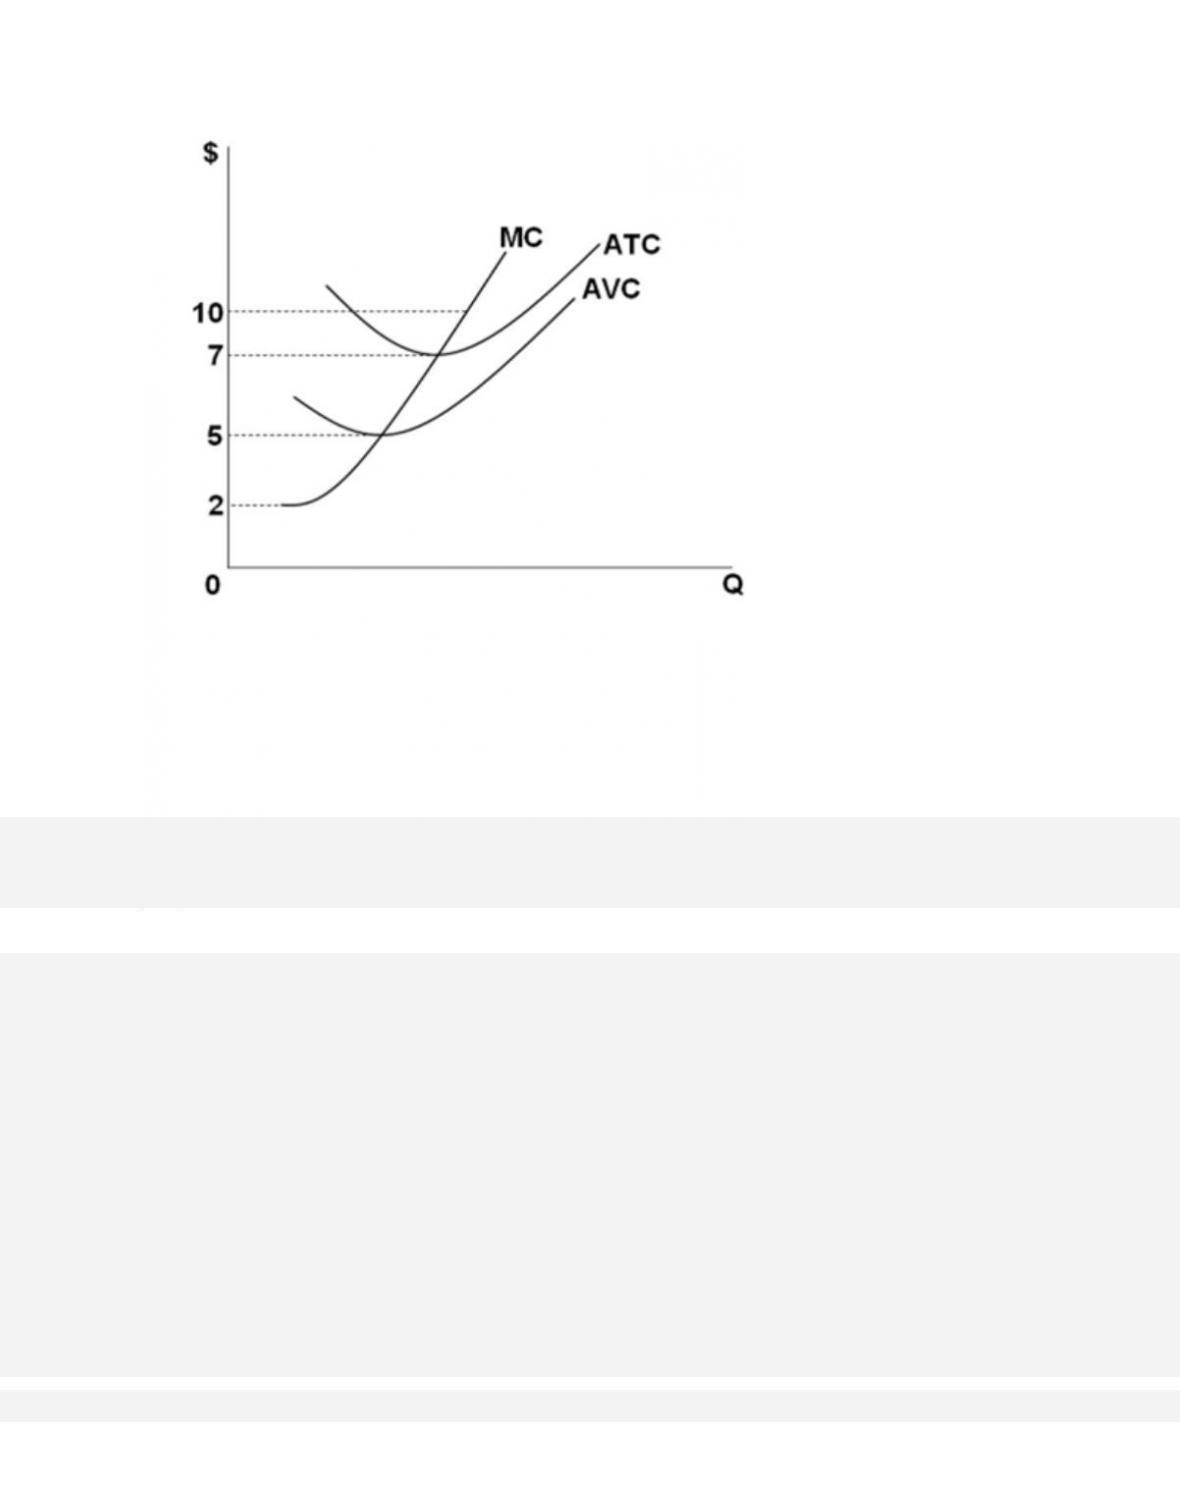
247.
The accompanying graph shows the cost curves for a competitive firm. What is the lowest price
at which the firm will start producing output in the
short run?
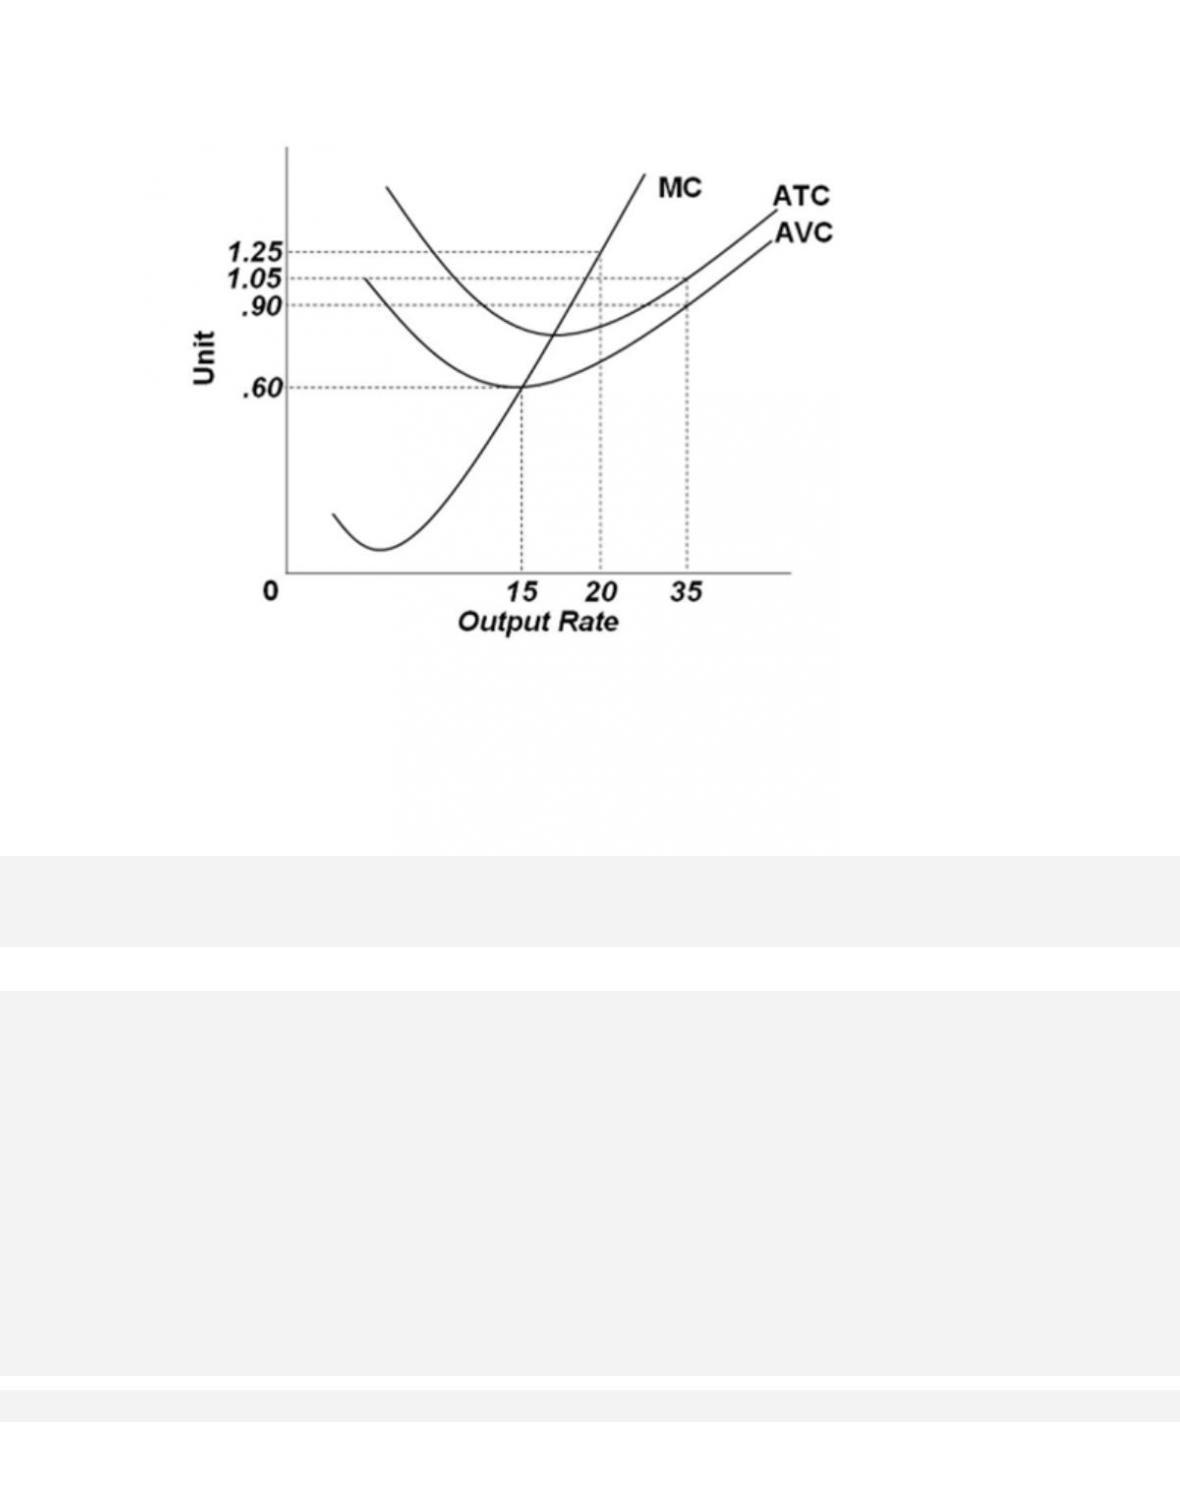
248.
The accompanying graph shows the cost curves for a competitive firm. If the market price of
the product is $1.05 per unit, then the firm will produce
how many units in the short run?

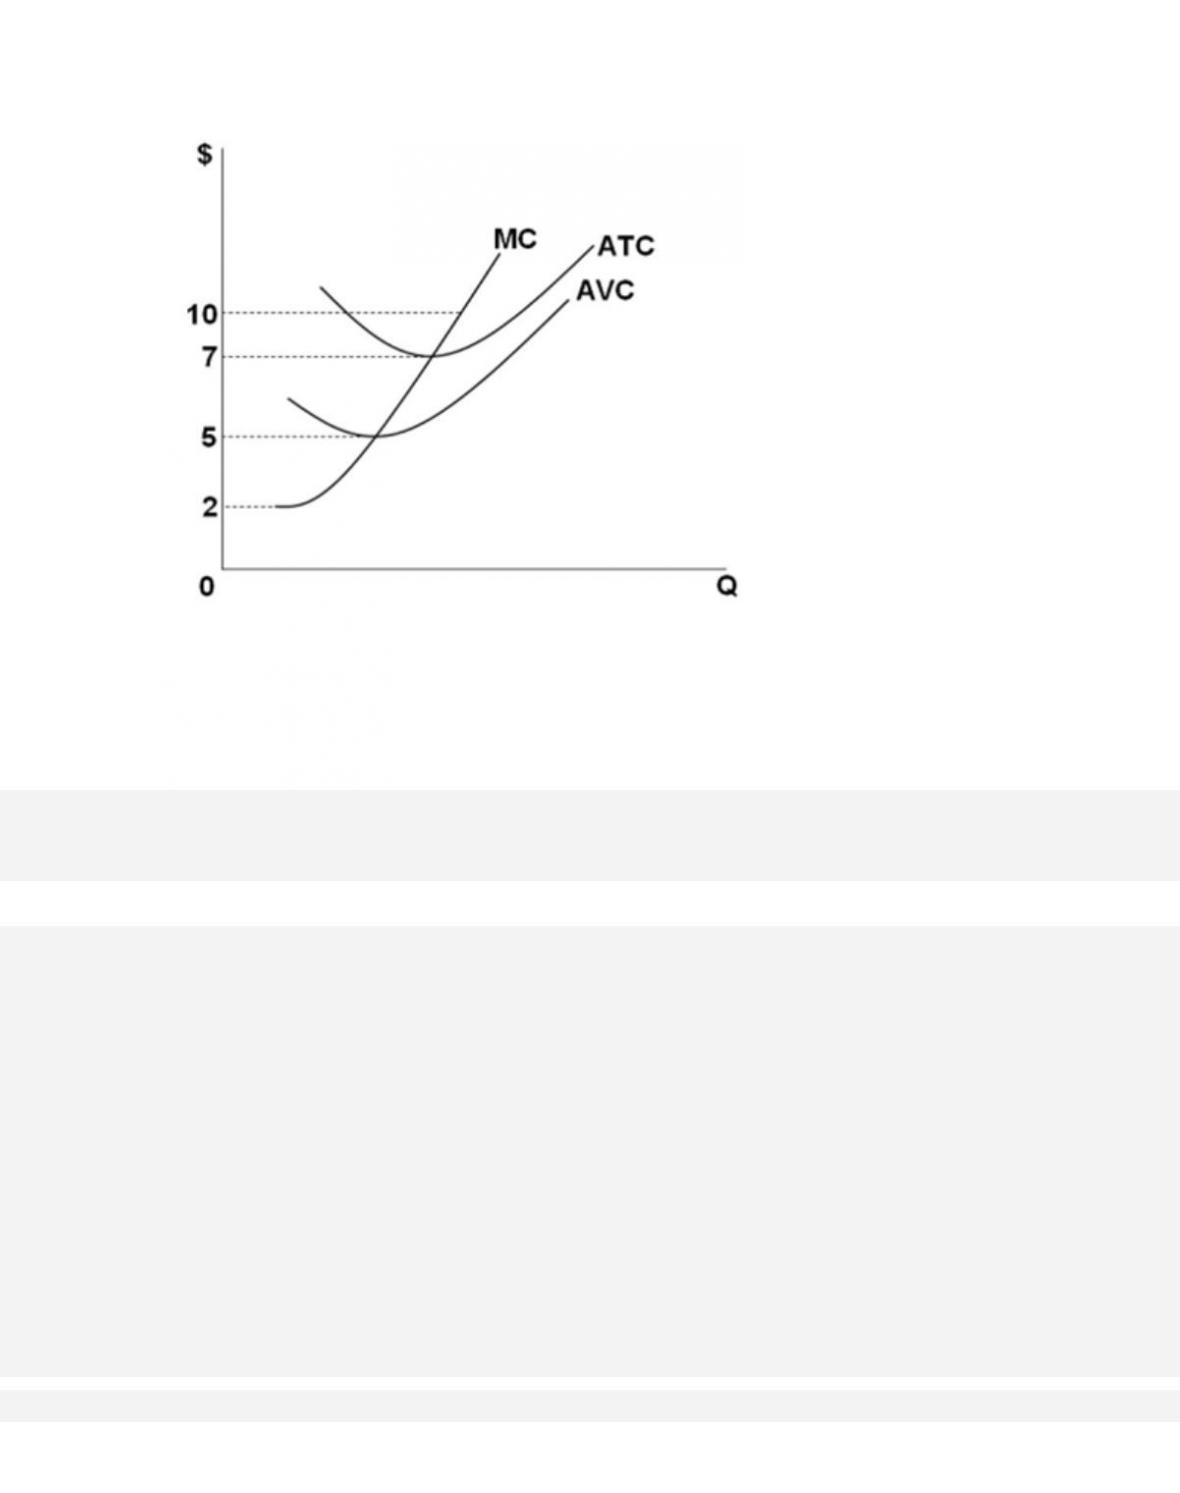
249.
The accompanying graph shows short-run cost curves for a competitive firm. At what price
would the firm face the same profit or loss whether it
chooses to produce or not?
250.
The accompanying graph shows short-run cost curves for a competitive firm. At what minimum
price would the firm be willing to produce some
output in the short run?
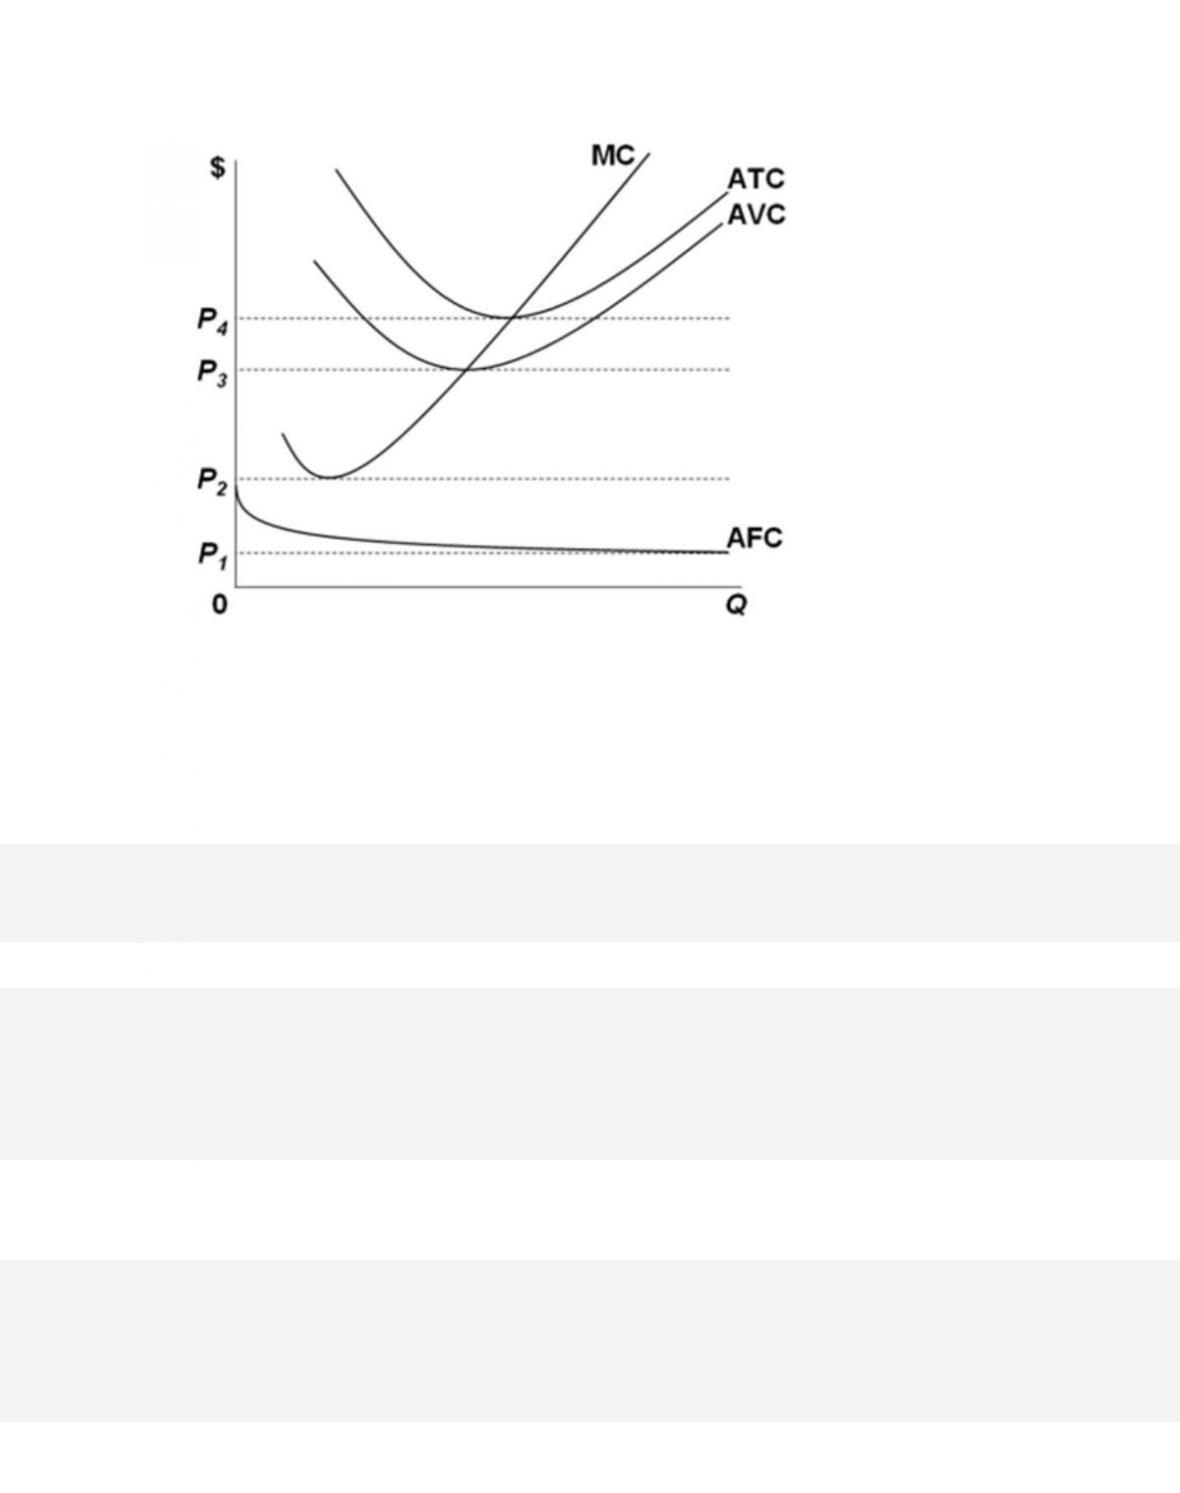
251.
The accompanying graph shows short-run cost curves for a competitive firm. At what price
would the firm break even?
252. The short-run supply curve for a competitive firm is the
10-148
Copyright © 2018 McGraw-Hill Education. All rights reserved. No reproduction or distribution without the prior
written consent of McGraw-Hill Education.
D. segment of the AVC curve lying to the right of the MC curve.
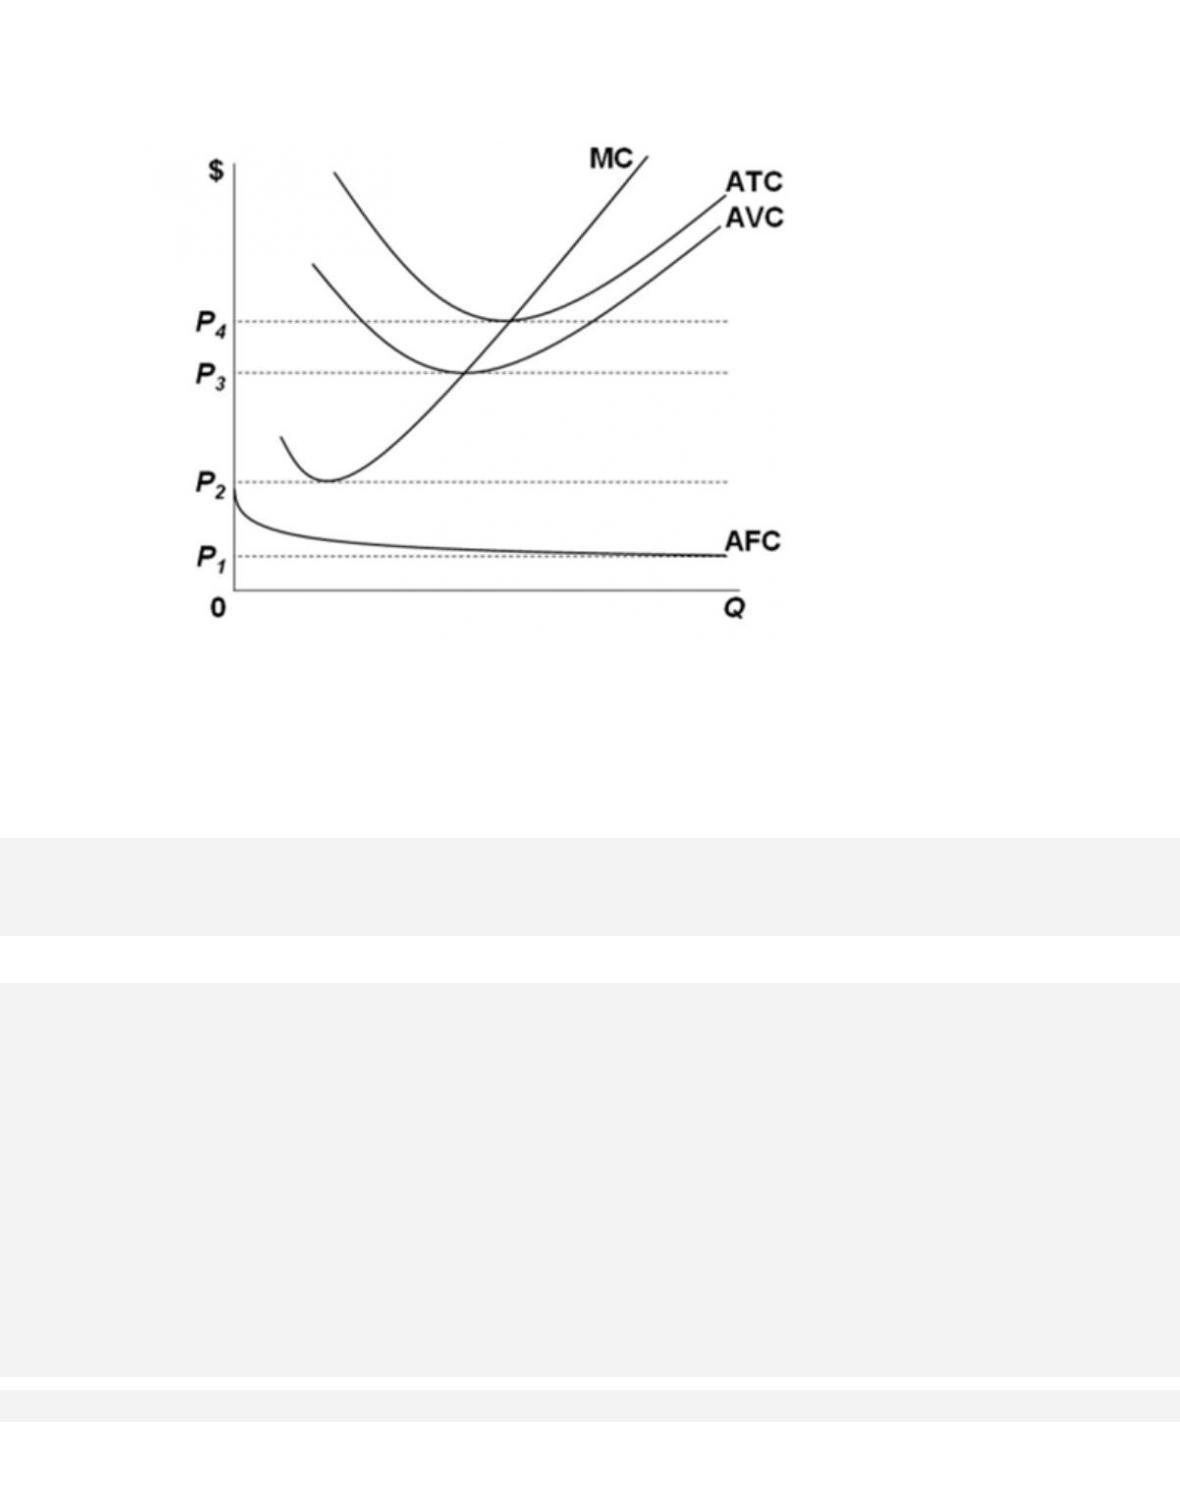
253.
Given the provided graph, the competitive firm’s supply curve is the
10-149
Copyright © 2018 McGraw-Hill Education. All rights reserved. No reproduction or distribution without the prior
written consent of McGraw-Hill Education.
Test Bank: II
Topic:
Marginal Cost and Short-Run Supply
254.
This purely competitive firm shown in the accompanying graph will not produce unless price is
at least
255.
At which of the following prices will the firm shown in the accompanying graph make an
economic profit?
256.
At what price will the firm shown in the accompanying graph make just a normal profit?
10-152
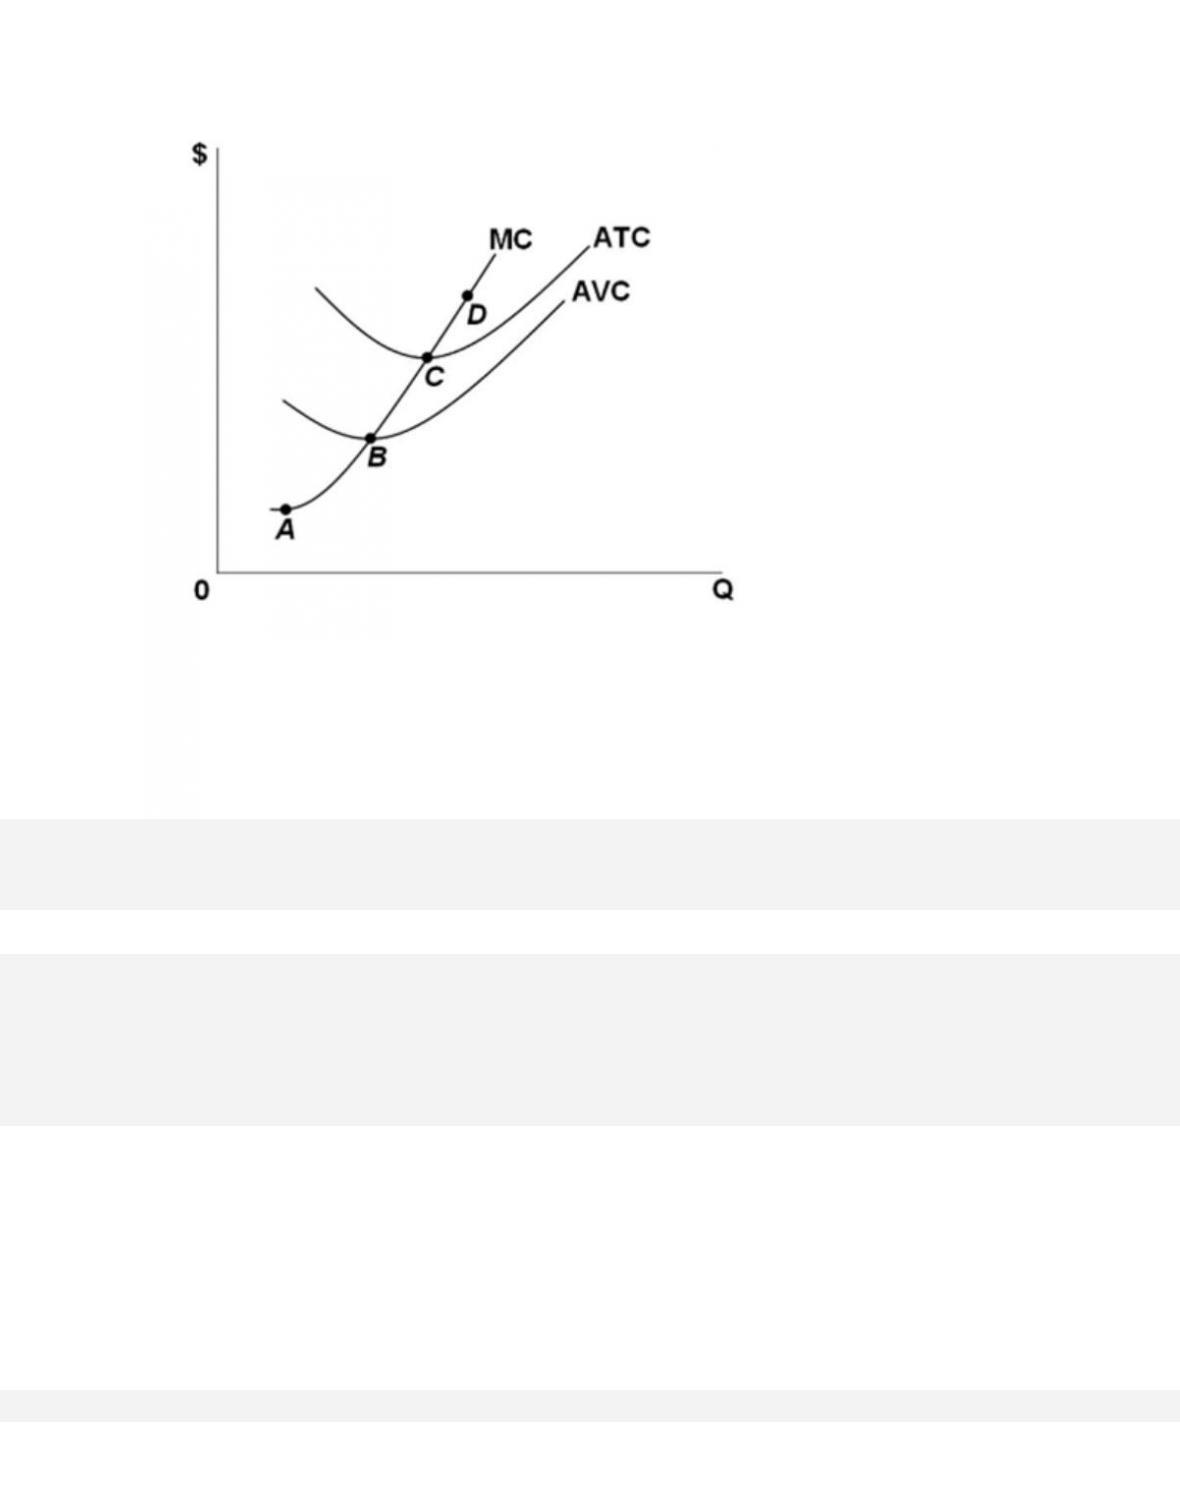
257.
Which point in the accompanying graph is definitely not on the competitive firm’s short-run
supply curve?
258.
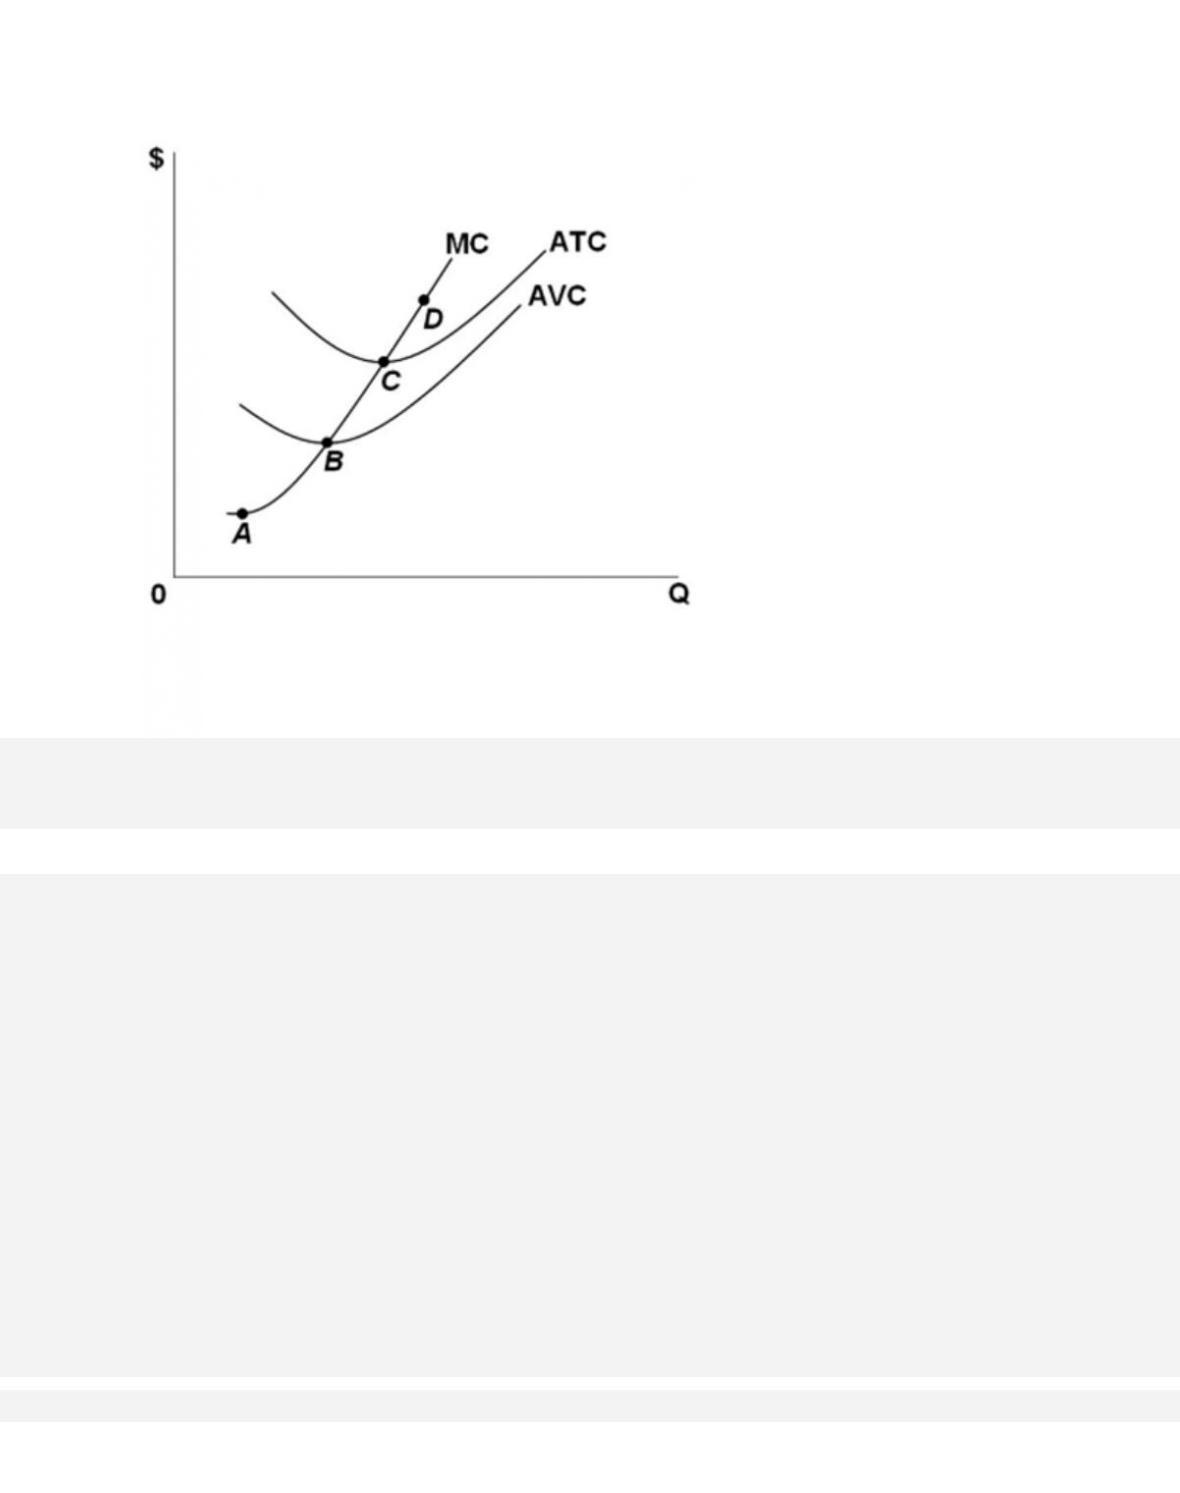
Which point in the accompanying graph is the break-even point for the firm?
10-154
259.
Which point in the accompanying graph is the shutdown point for the firm?
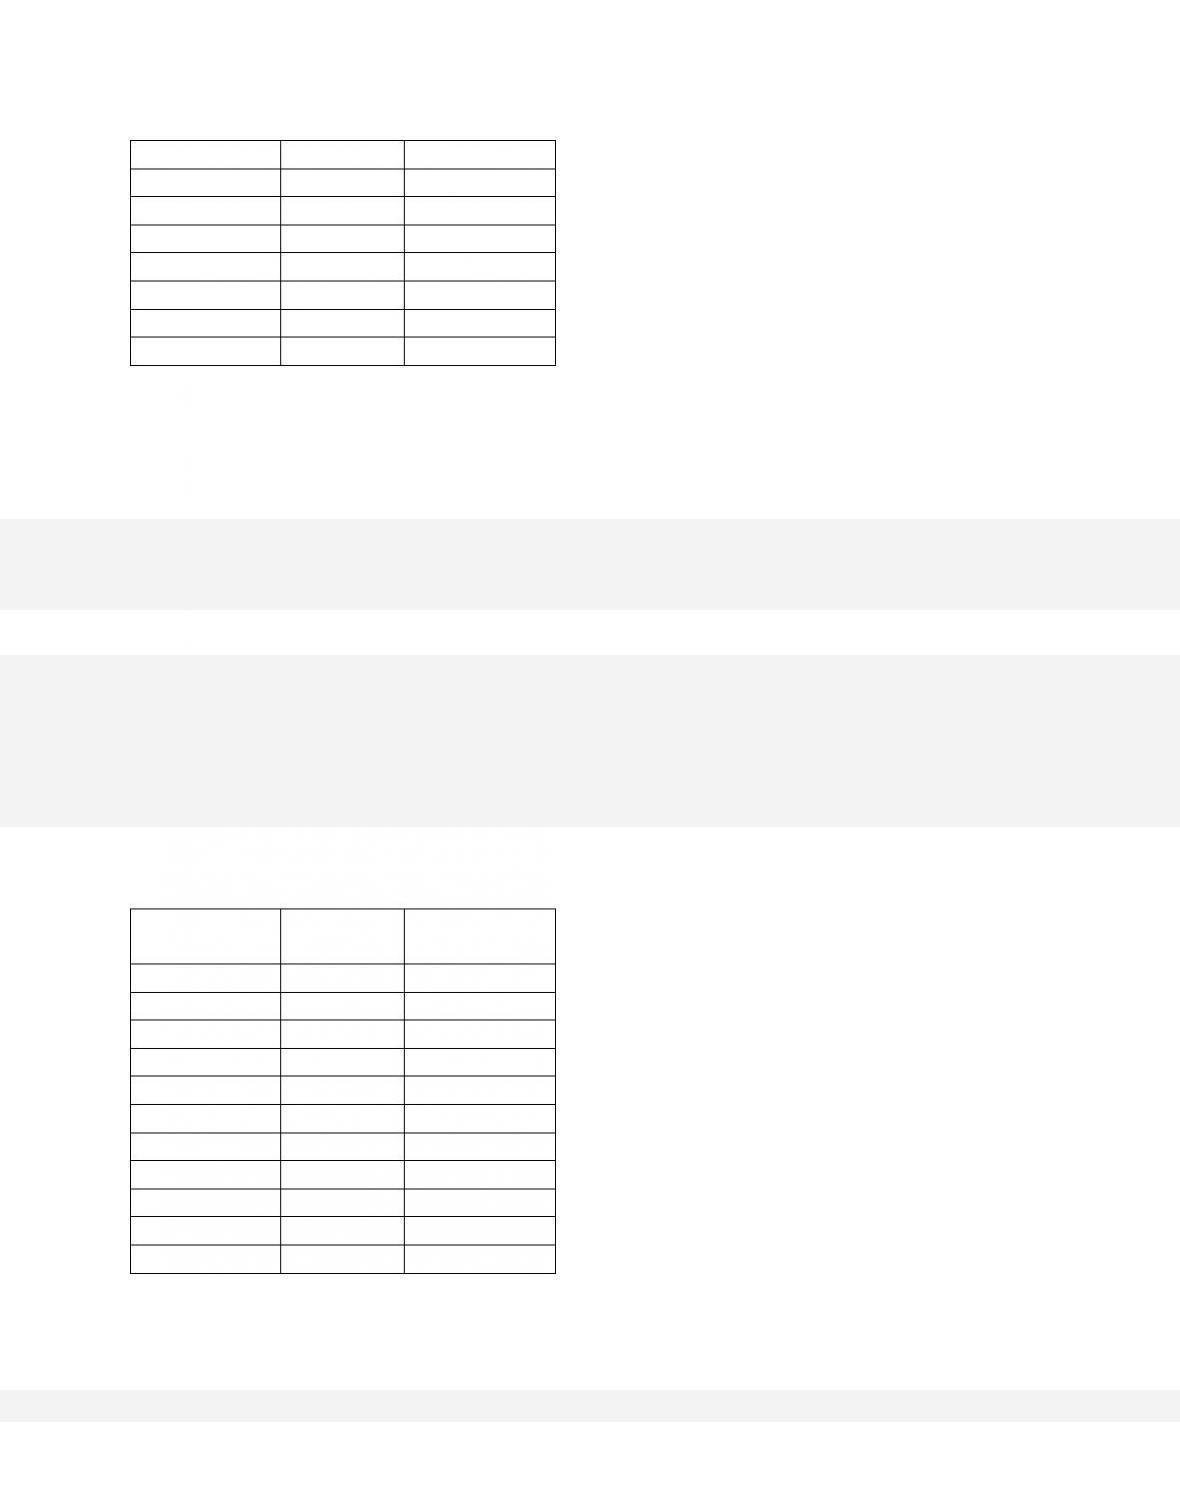
260.
Total Product
Total
Fixed Cost
Total
Variable Cost
0
$150
$ 0
1
150
50
2
150
75
10-155
3
150
105
4
150
145
5
150
200
6
150
270
7
150
360
8
150
475
9
150
620
10
150
800
Refer to the accompanying cost table. If a competitive firm faced with these costs finds that it
can sell its product at $60 per unit, it will
261.
Total Product
Total
Fixed Cost
Total
Variable Cost
0
$150
$ 0
1
150
50
2
150
75
3
150
105
4
150
145
5
150
200
6
150
270
7
150
360
8
150
475
9
150
620
10
150
800
10-156
Refer to the accompanying cost table. If price of the product were $30 per unit, the firm would
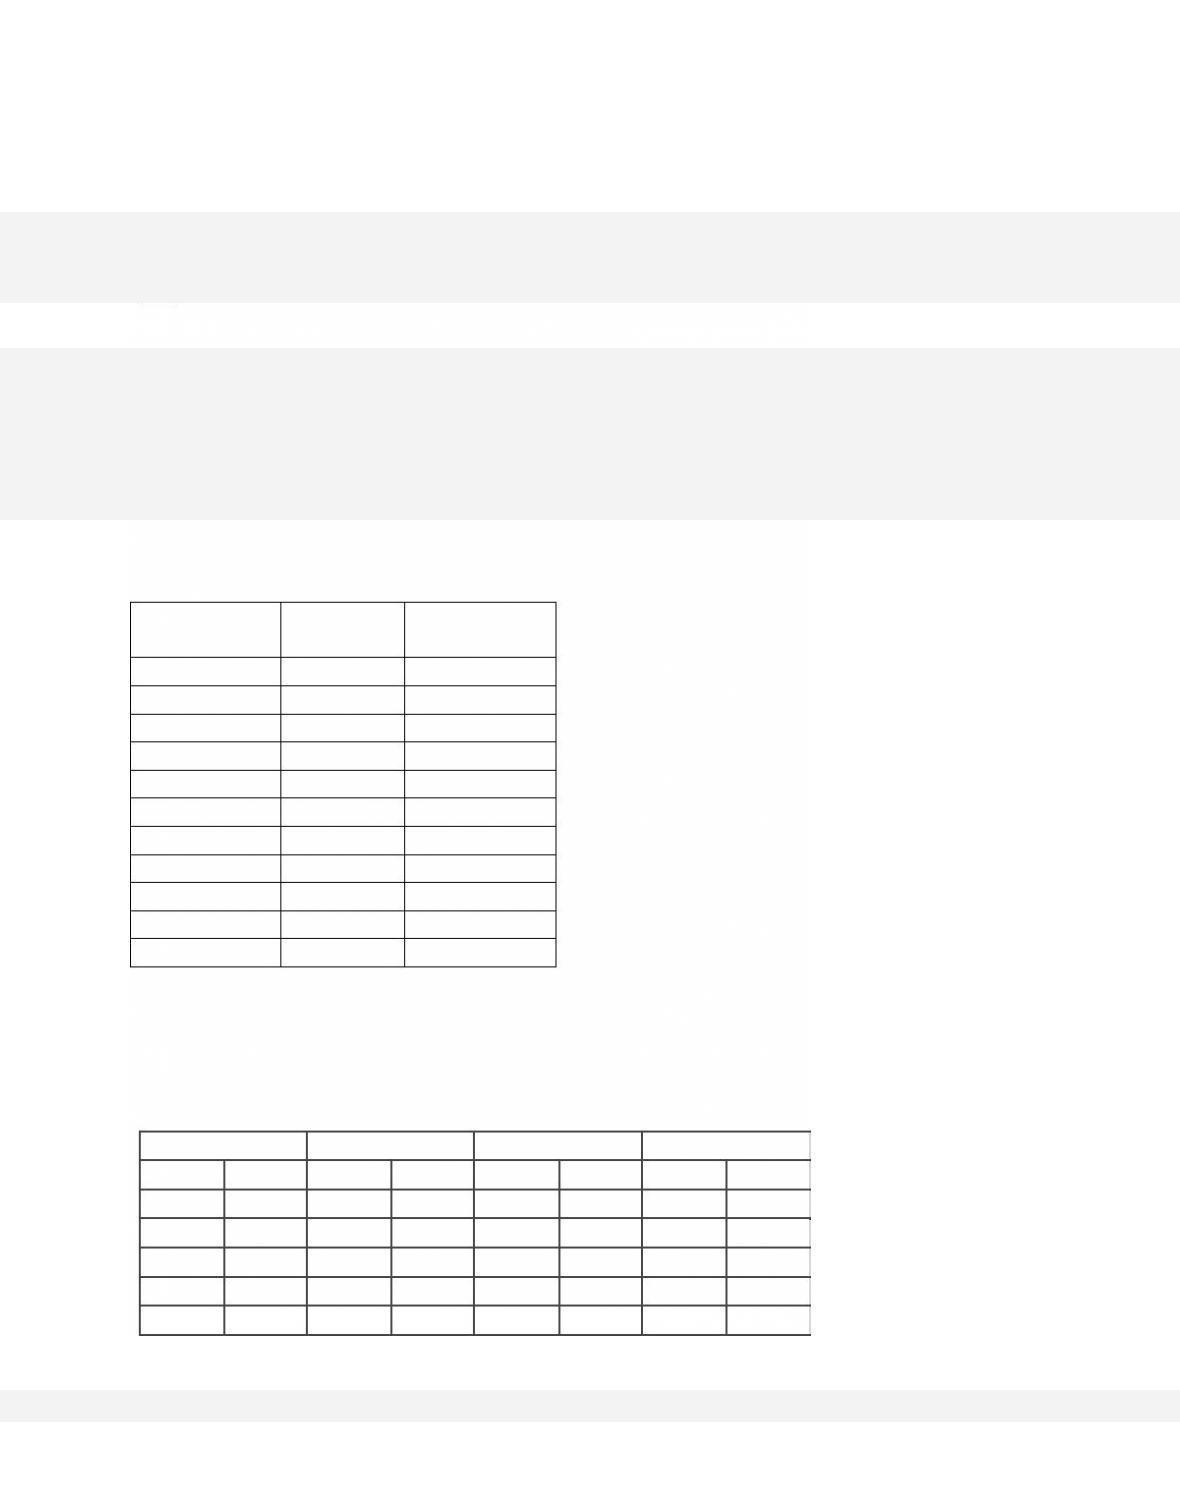
262.
Total Product
Total
Fixed Cost
Total
Variable Cost
0
$150
$ 0
1
150
50
2
150
75
3
150
105
4
150
145
5
150
200
6
150
270
7
150
360
8
150
475
9
150
620
10
150
800
Based on the cost data given in the accompanying table, which of the price-quantity tables
correctly represents the firm’s short-run supply schedule?
(a)
(b)
(c)
(d)
P
Qs
P
Qs
P
Qs
P
Qs
$20
1
$20
0
$20
0
$20
3
30
2
30
0
30
0
30
4
45
3
45
4
45
0
45
5
60
4
60
5
60
0
60
6
75
5
75
6
75
5
75
7
10-157
95
6
95
7
95
6
95
8
120
7
120
8
120
7
120
9
150
8
150
9
150
8
150
10
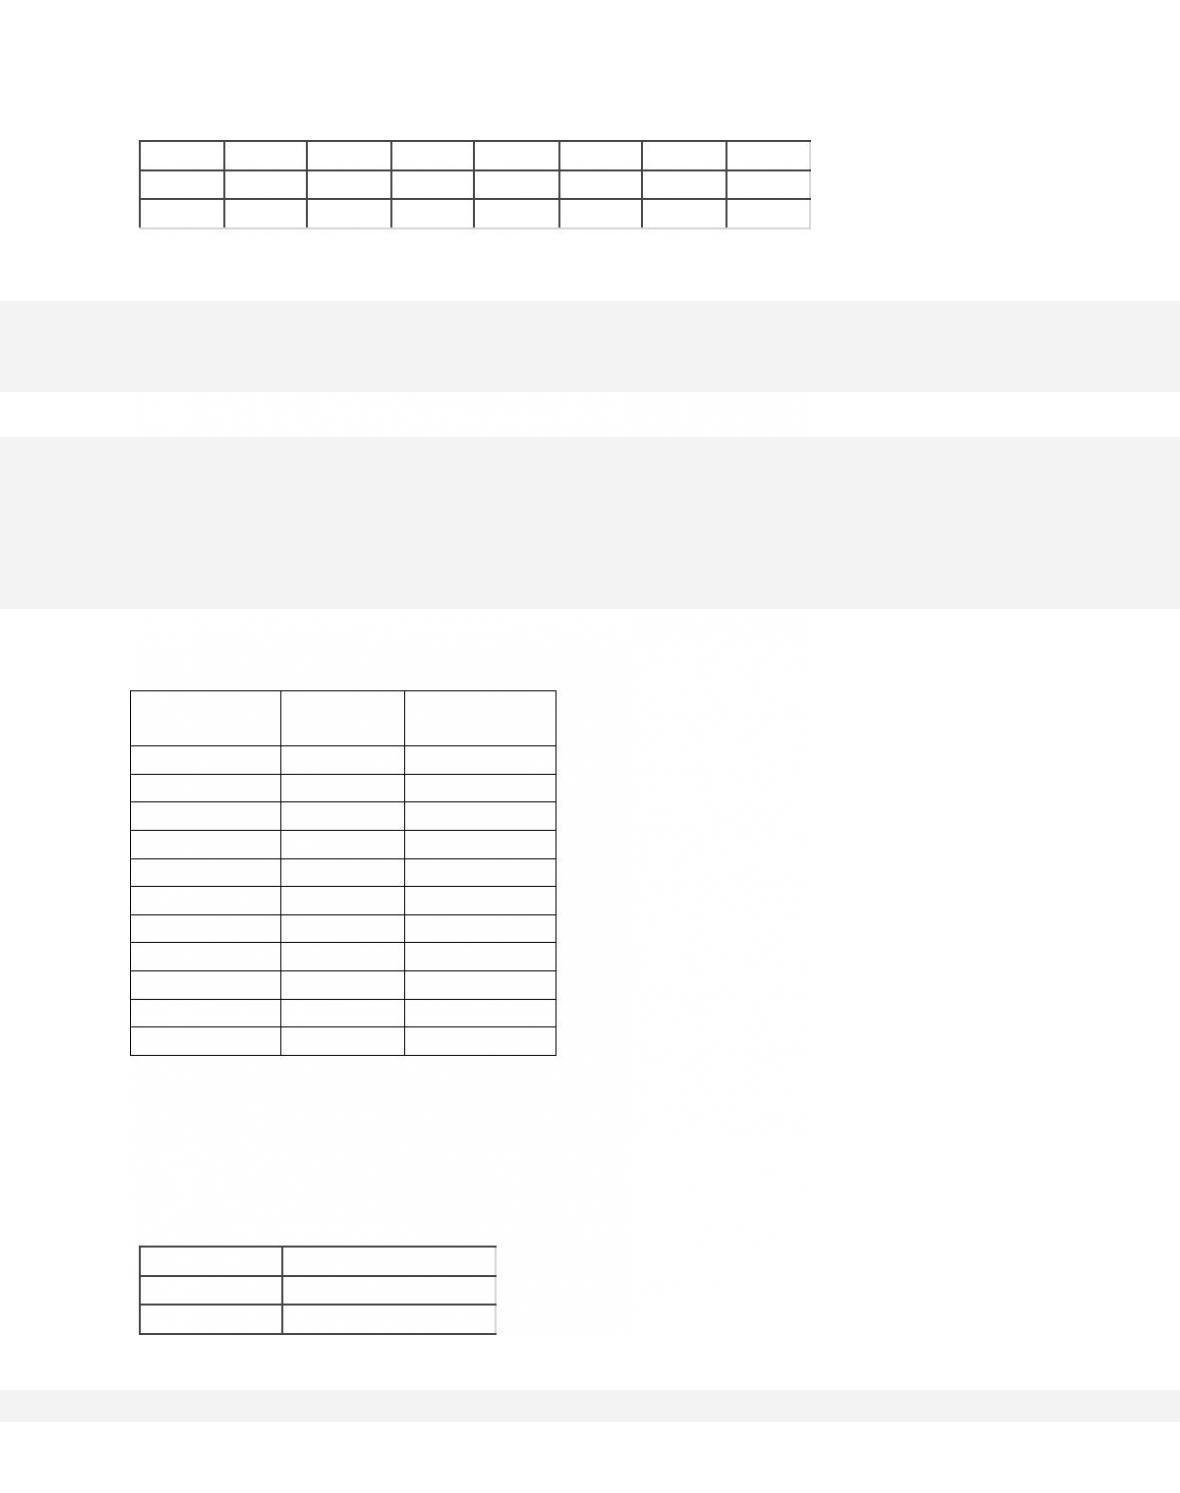
263.
Total Product
Total
Fixed Cost
Total
Variable Cost
0
$150
$ 0
1
150
50
2
150
75
3
150
105
4
150
145
5
150
200
6
150
270
7
150
360
8
150
475
9
150
620
10
150
800
The first table shows cost data for a single firm. Now suppose that there are 600 identical firms
in this industry, each with the same cost data.
Suppose, too, that the demand curve for this
industry is as shown in the second table.
Price
Quantity Demanded
$20
6,800
30
5,975