
10-101
Copyright © 2018 McGraw-Hill Education. All rights reserved. No reproduction or distribution without the prior
written consent of McGraw-Hill Education.
Blooms: Understand
D i f f i c u lt y :
02 Medium
Learning Objective: 10–03 Explain how demand is seen by a purely competitive seller.
Test Bank: II
Topic:
Demand as Seen by a Purely Competitive Seller
179.
In pure competition, the demand for the product of a single firm is perfectly
180.
If a firm is a price taker, then the demand curve for the firm‘s product is
181.
Xavier produces and sells tomatoes in a purely competitive market. This implies that
Xavier’s marginal revenue from an extra unit of tomatoes is
always equal to the

10-102
Copyright © 2018 McGraw-Hill Education. All rights reserved. No reproduction or distribution without the prior
written consent of McGraw-Hill Education.
AACSB: Knowledge Application
A c c e s s i b i l i t y :
Keyboard Navigation
Blooms: Understand
D i f f i c u lt y :
02 Medium
Learning Objective: 10–03 Explain how demand is seen by a purely competitive seller.
Test Bank: II
Topic:
Demand as Seen by a Purely Competitive Seller
182.
Suppose that Joe sells pork in a purely competitive market. The market price of pork is $3
per pound. Joe’s marginal revenue from selling the 12th
pound of pork would be
183.
In pure competition, each extra unit of output that a firm sells will yield a marginal
revenue that is
184.
Average revenue is conceptually equivalent to the

10-103
Copyright © 2018 McGraw-Hill Education. All rights reserved. No reproduction or distribution without the prior
written consent of McGraw-Hill Education.
C.
marginal cost of the product.
D.
marginal revenue of the product.
185.
Unit price and average revenue are the same or equal in
186.
Average revenue and marginal revenue are equal at each output level in
187.
In a graph for a firm in pure competition with the quantity of output measured on the
horizontal axis, the total revenue curve is

10-104
Copyright © 2018 McGraw-Hill Education. All rights reserved. No reproduction or distribution without the prior
written consent of McGraw-Hill Education.
A.
downward-sloping.
B.
horizontal.
C.
vertical.
D. upward-sloping.
188.
The total revenue of a purely competitive firm from selling 6 units of output is $48. Based
on this information, the unit price of the output must be
189.
The total revenue of a purely competitive firm from 8 units of output is $48. Based on this
information, total revenue for 9 units of output must be
190.
A purely competitive firm currently producing 20 units of output earns marginal revenues
of $12 from each extra unit of output it sells. If it sells 30
units, then its total revenues would
be
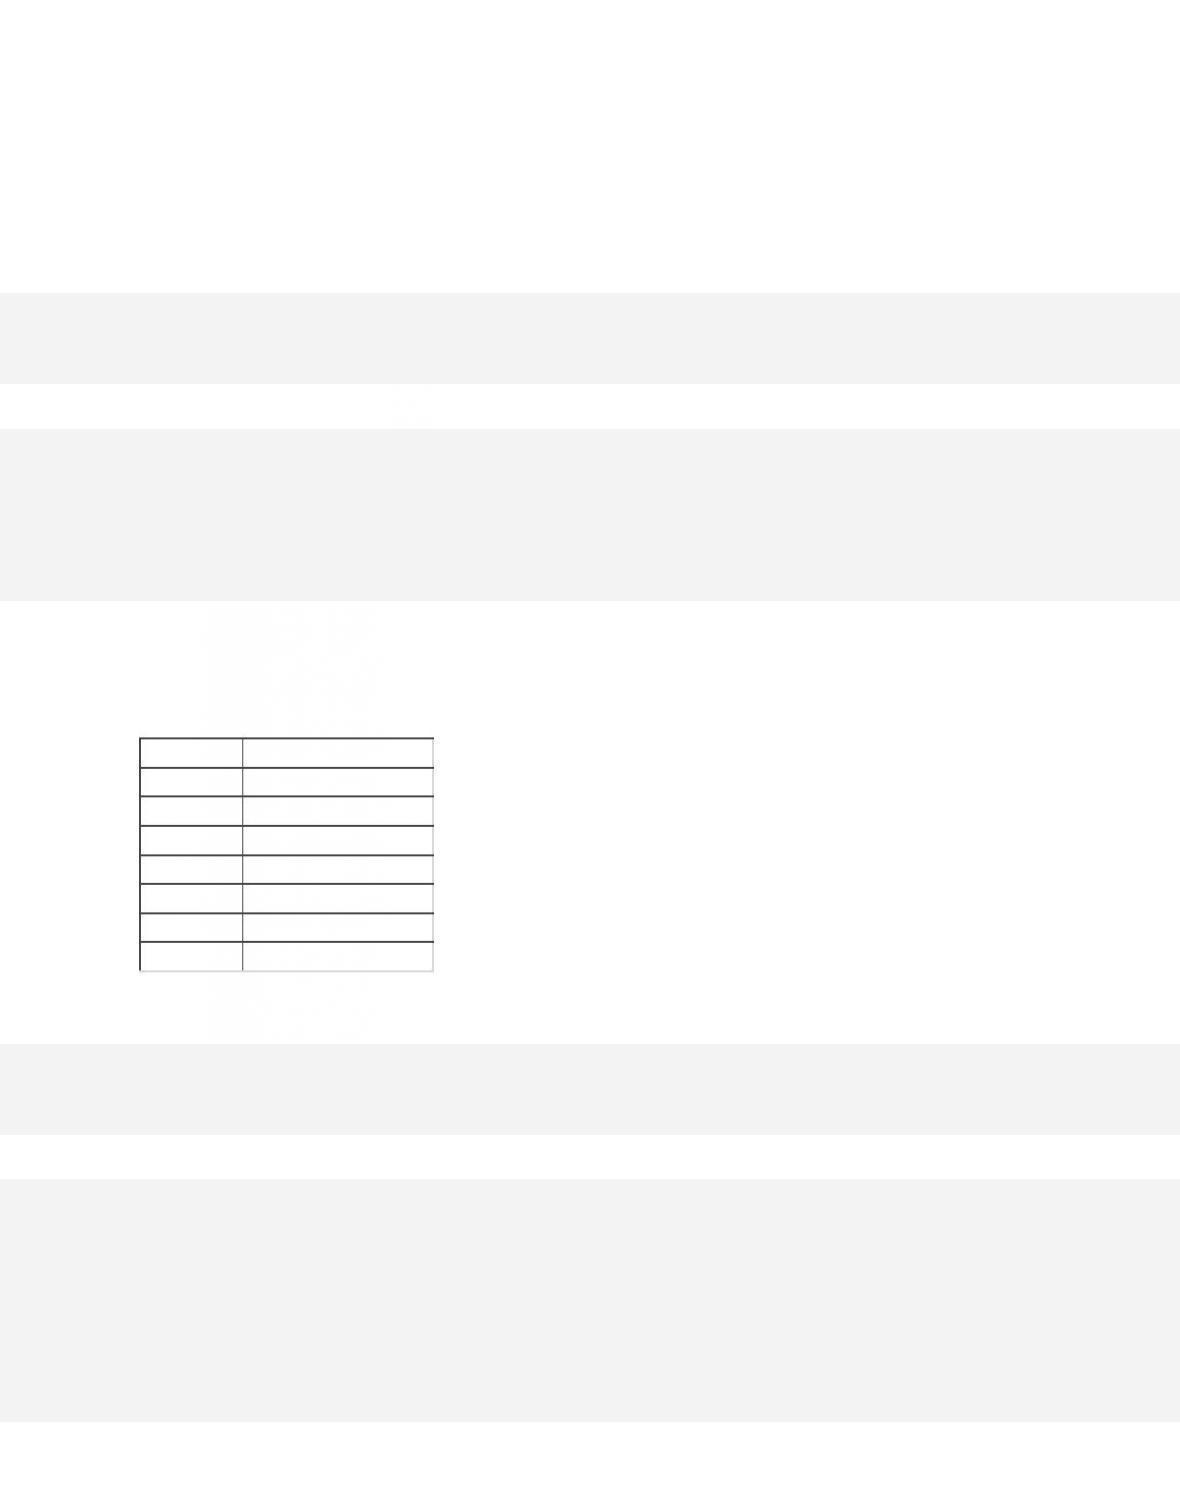
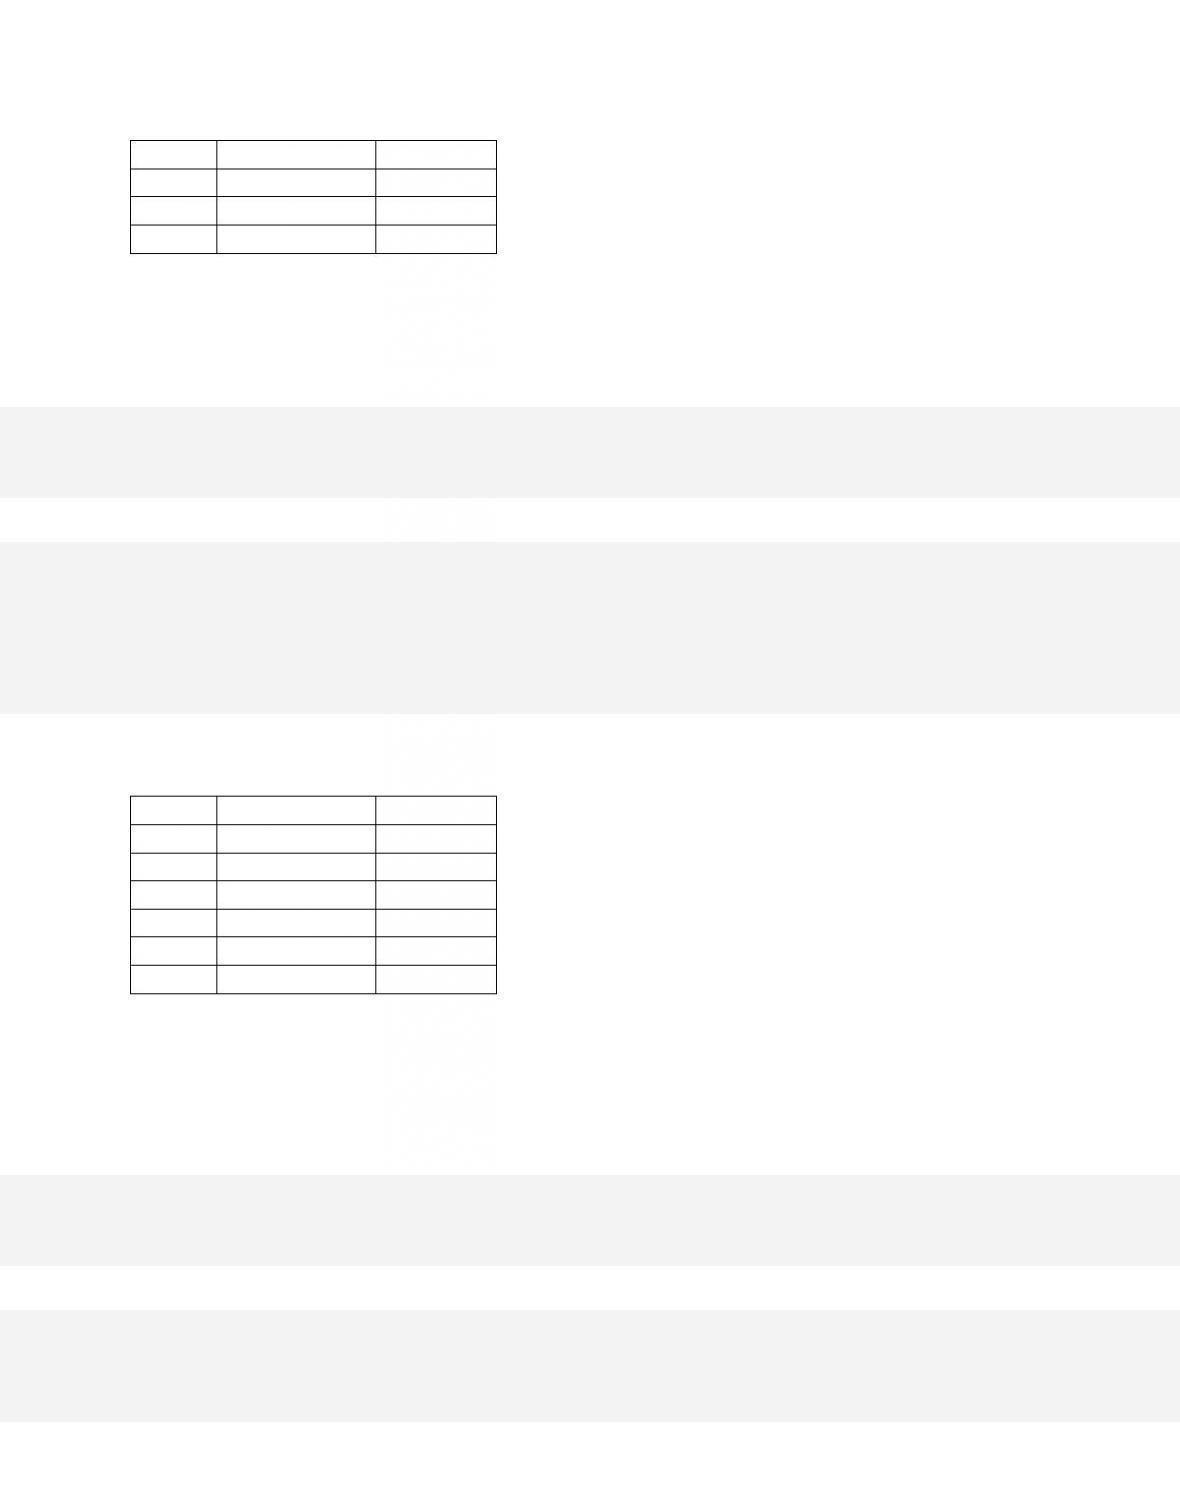
191. Assume the price of a product sold by a purely competitive firm is $5. Given the data in
the accompanying table, at what output level is total profit
highest in the short run?
Output
Total Cost
20
$70
25
75
30
85
35
100
40
125
45
155
50
190

10-106
Copyright © 2018 McGraw-Hill Education. All rights reserved. No reproduction or distribution without the prior
written consent of McGraw-Hill Education.
Topic:
Profit Maximization in the Short Run: Total-Revenue–Total-Cost Approach
192.
In the standard model of pure competition in the short run, a profit-maximizing firm will
produce the output quantity where the gap between
193.
In the standard model of pure competition, a profit-maximizing firm will shut down in the
short run if price is below
194.
In the standard model of pure competition, a profit-maximizing firm will shut down in the
short run if
10-107
Copyright © 2018 McGraw-Hill Education. All rights reserved. No reproduction or distribution without the prior
written consent of McGraw-Hill Education.
AACSB: Knowledge Application
A c c e s s i b i l i t y :
Keyboard Navigation
Blooms: Understand
D i f f i c u lt y :
02 Medium
Learning Objective: 10–04 Convey how purely competitive firms can use the total-revenue–
total-cost approach to maximize profits or minimize losses in the short run.
Test Bank: II
Topic:
Profit Maximization in the Short Run: Total-Revenue–Total-Cost Approach
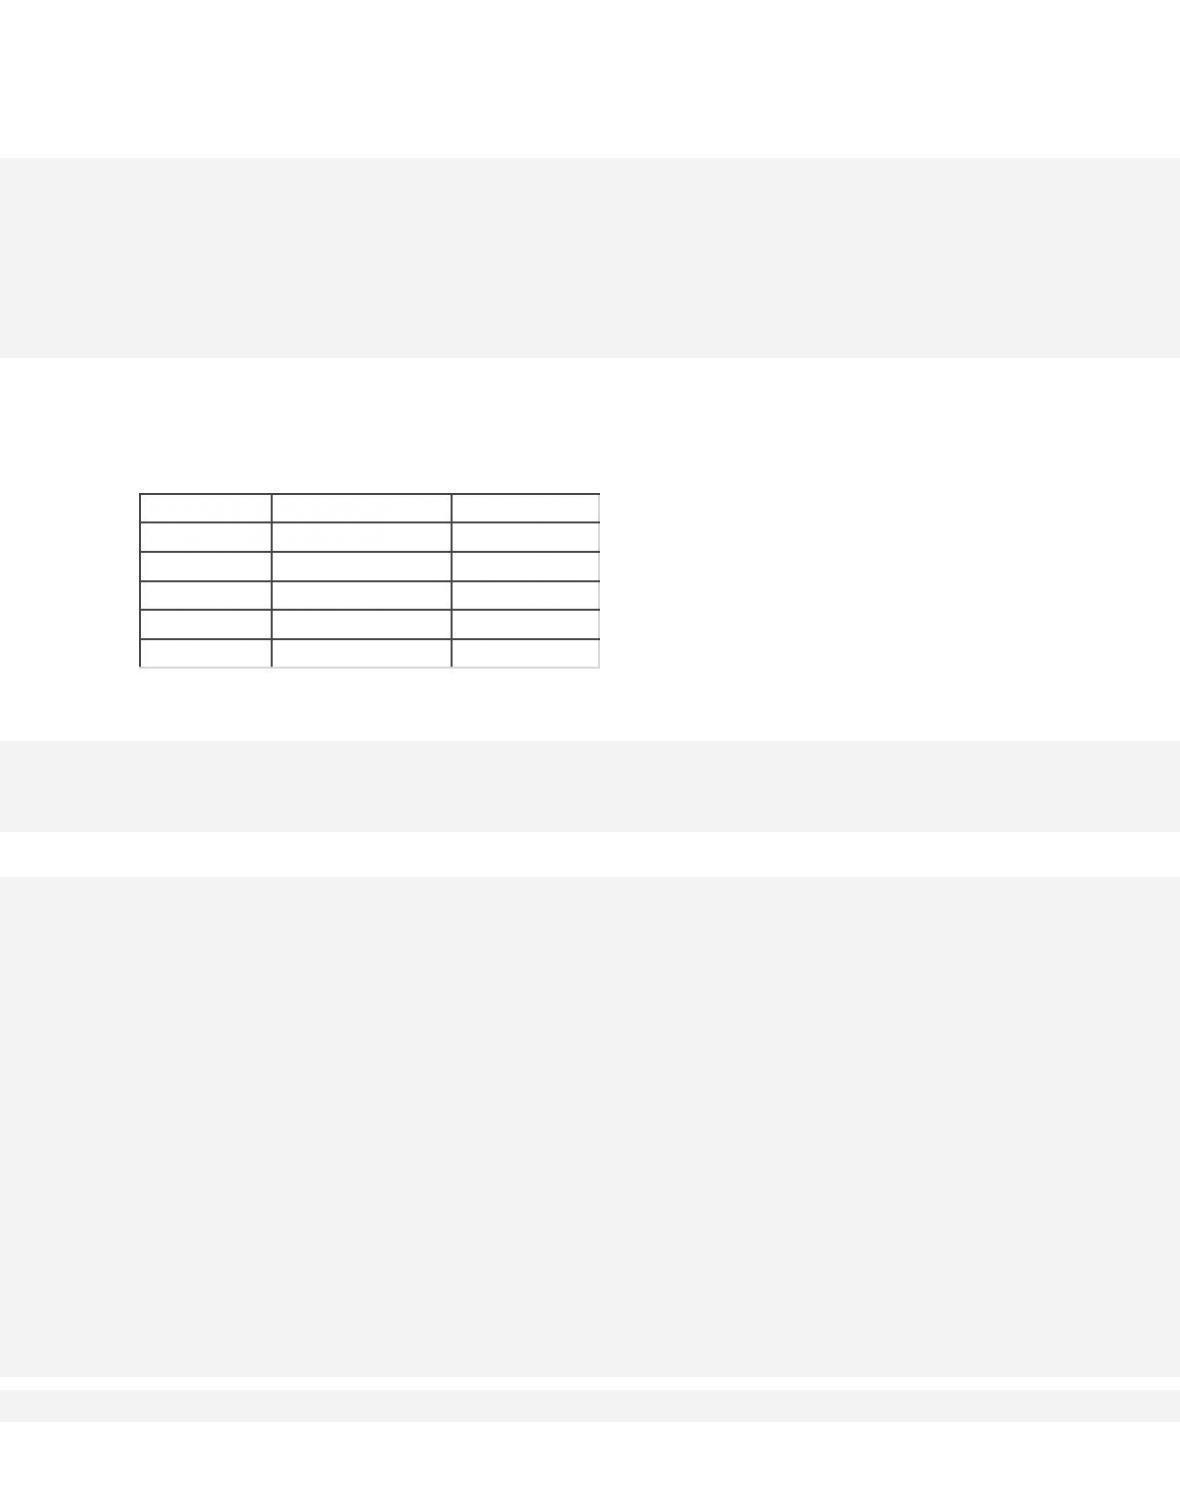
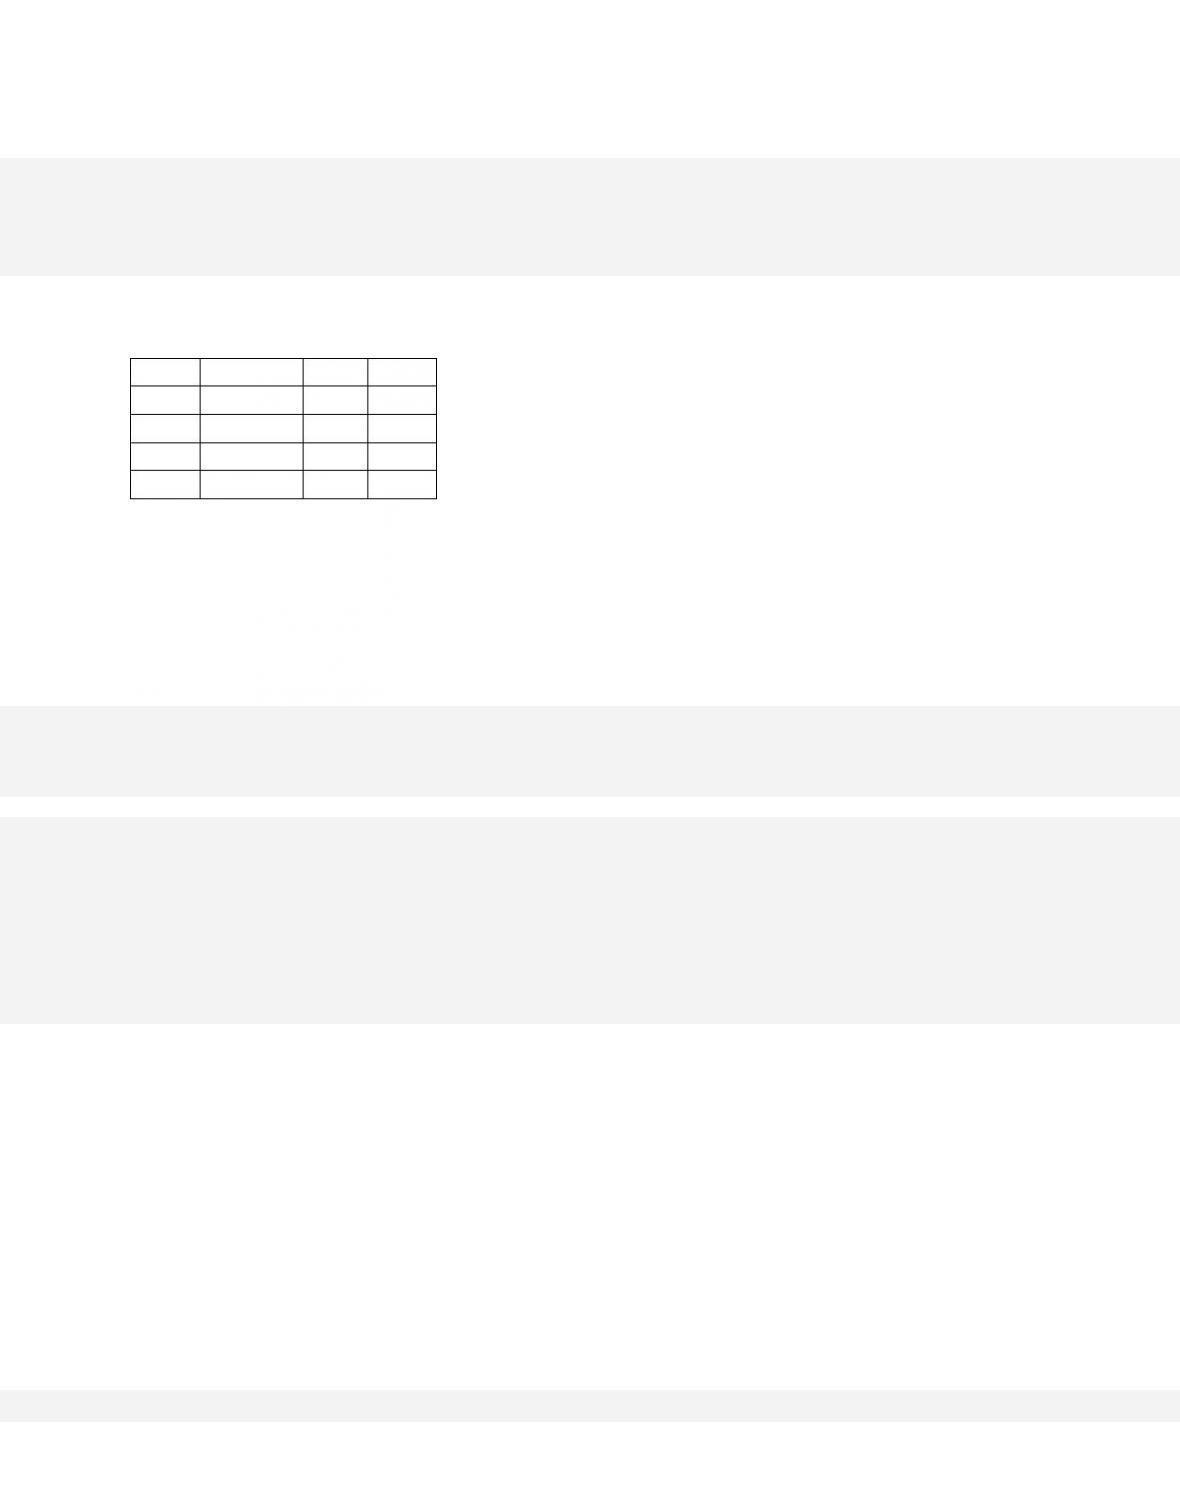
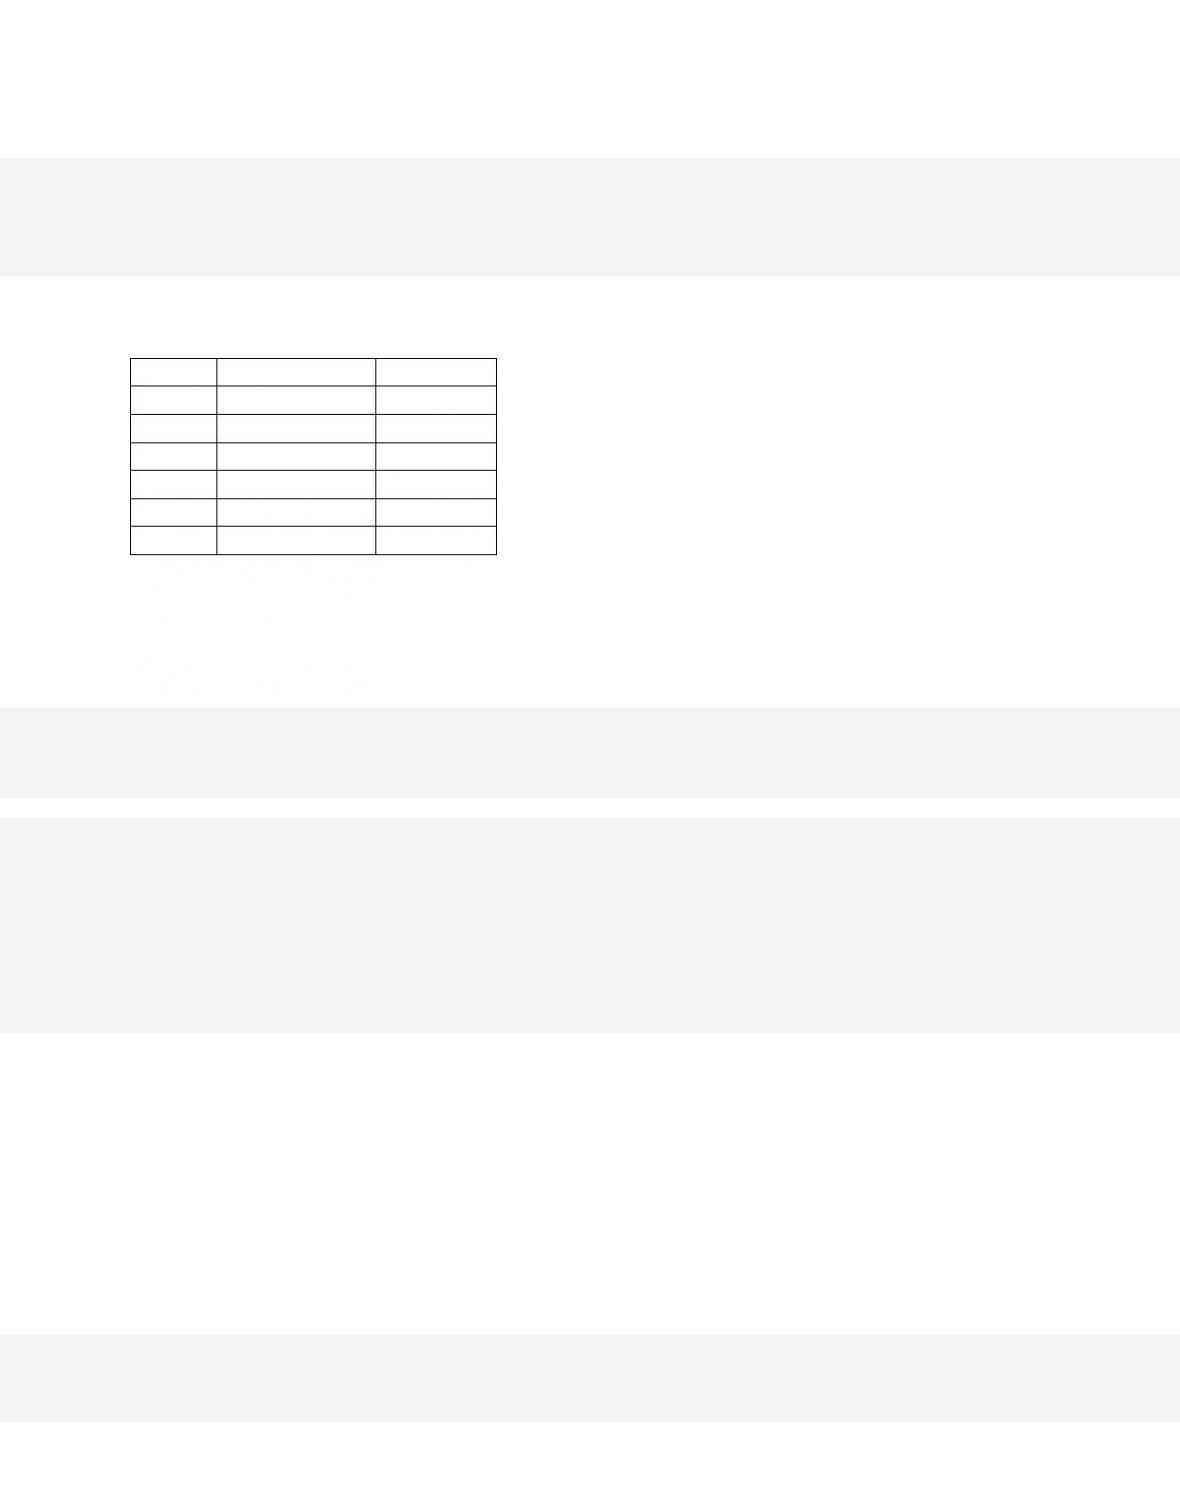
195. Given the accompanying table, what is the short-run profit-maximizing level of output for
the firm?
Output
Total Revenue
Total Cost
1
$4
2
2
8
3
3
12
6
4
16
9
5
20
14
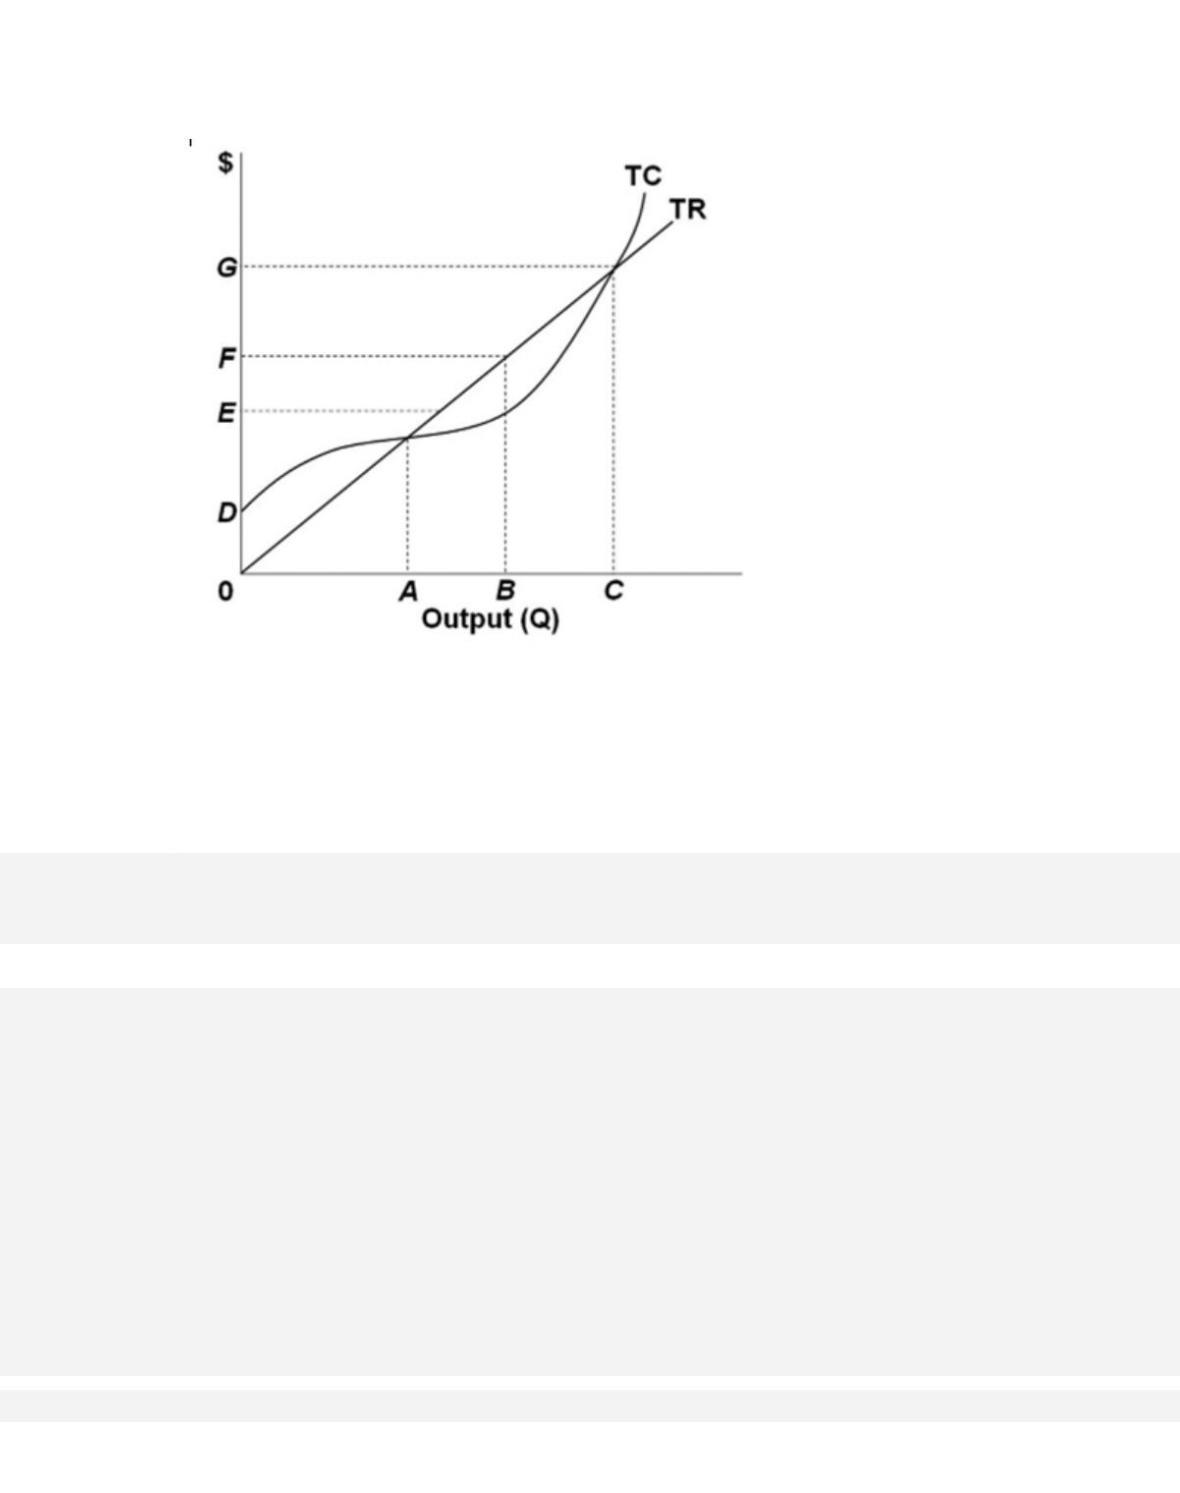
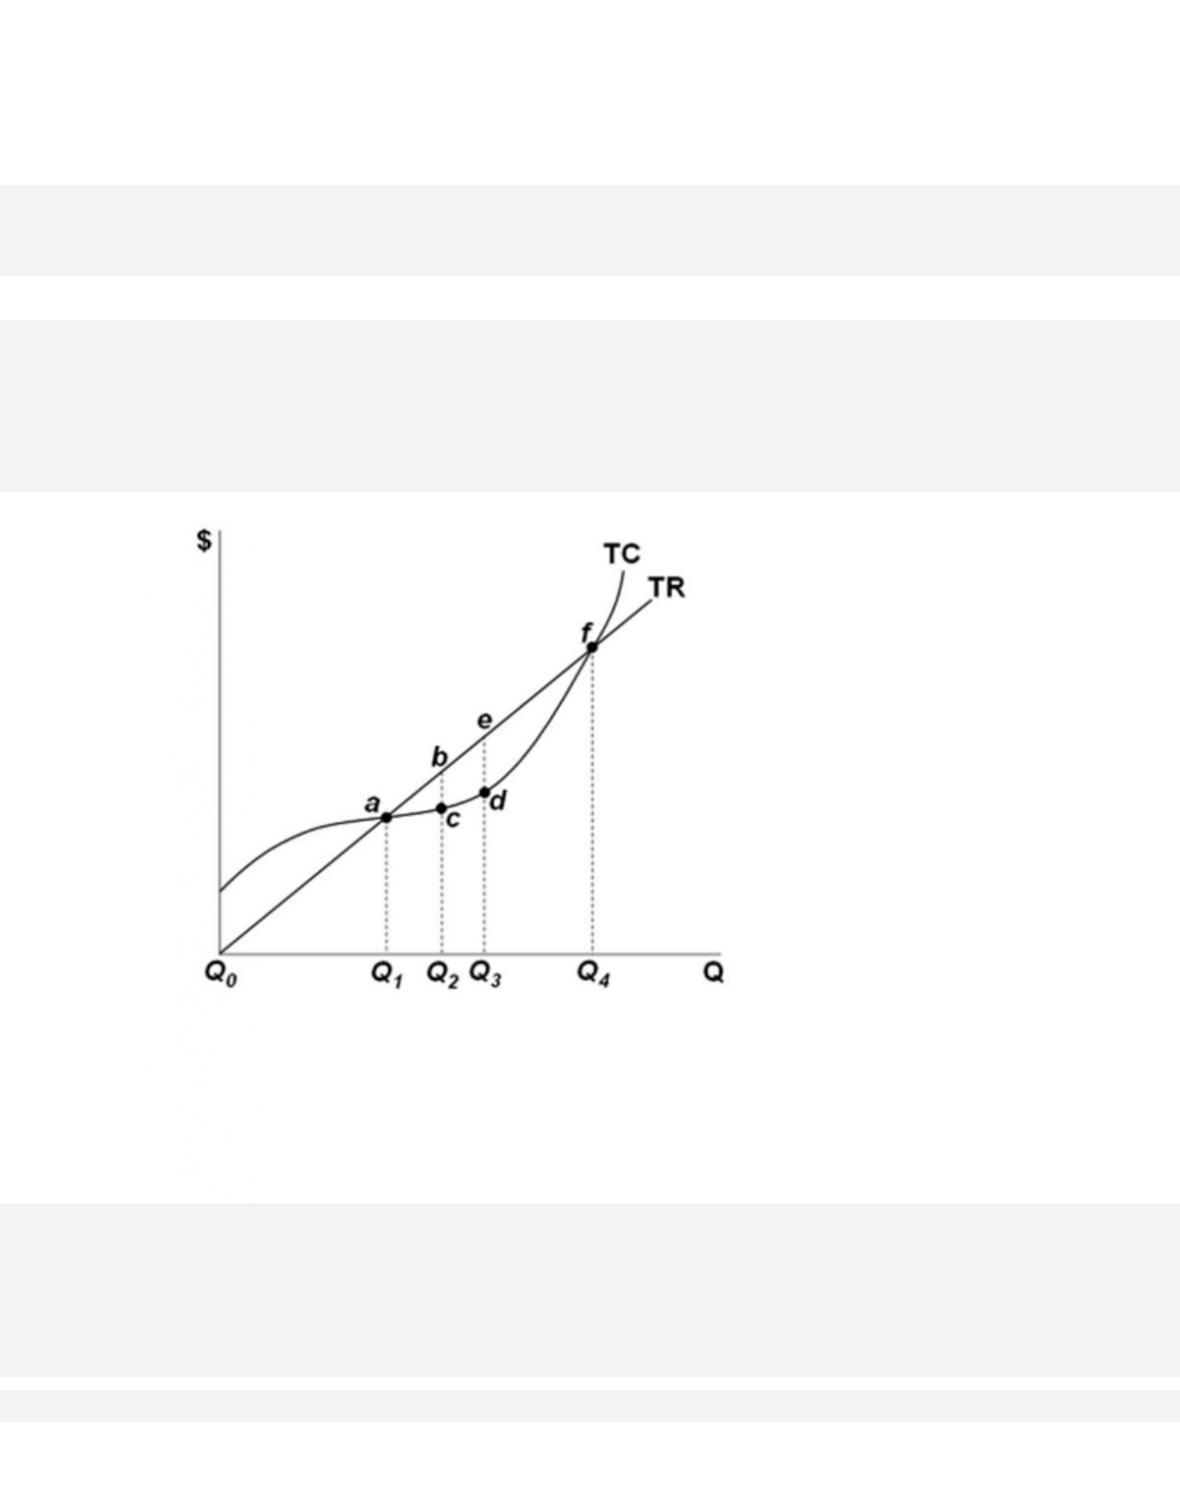
196.
Refer to the provided graph for a purely competitive firm in the short run. The firm would
suffer losses if it operated at which of the following ranges
of output?
197.
Refer to the provided graph for a purely competitive firm in the short run. Profits would be
maximized if the firm produces which level of output?
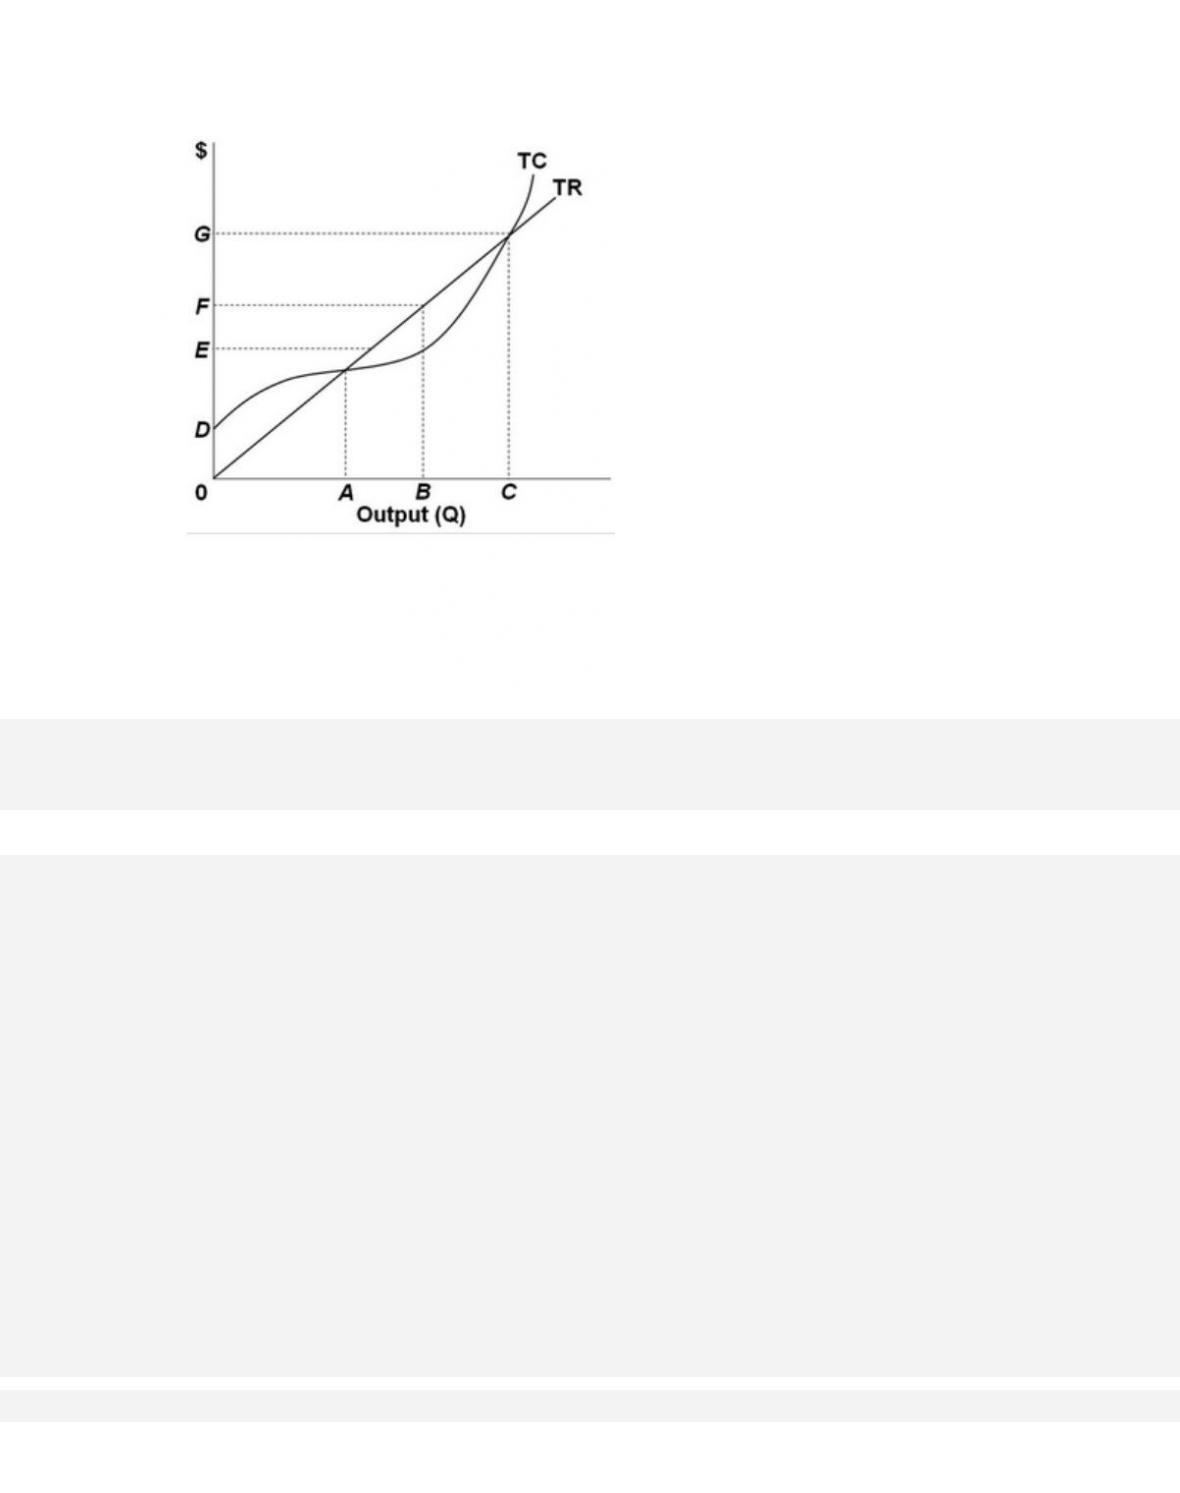
198.
Refer to the provided graph for a purely competitive firm in the short run. If the firm is
maximizing profit, the price of the product is:
199.
Refer to the provided graph for a purely competitive firm in the short run. What minimum
output level should the firm produce just for it to break
even?
10-112
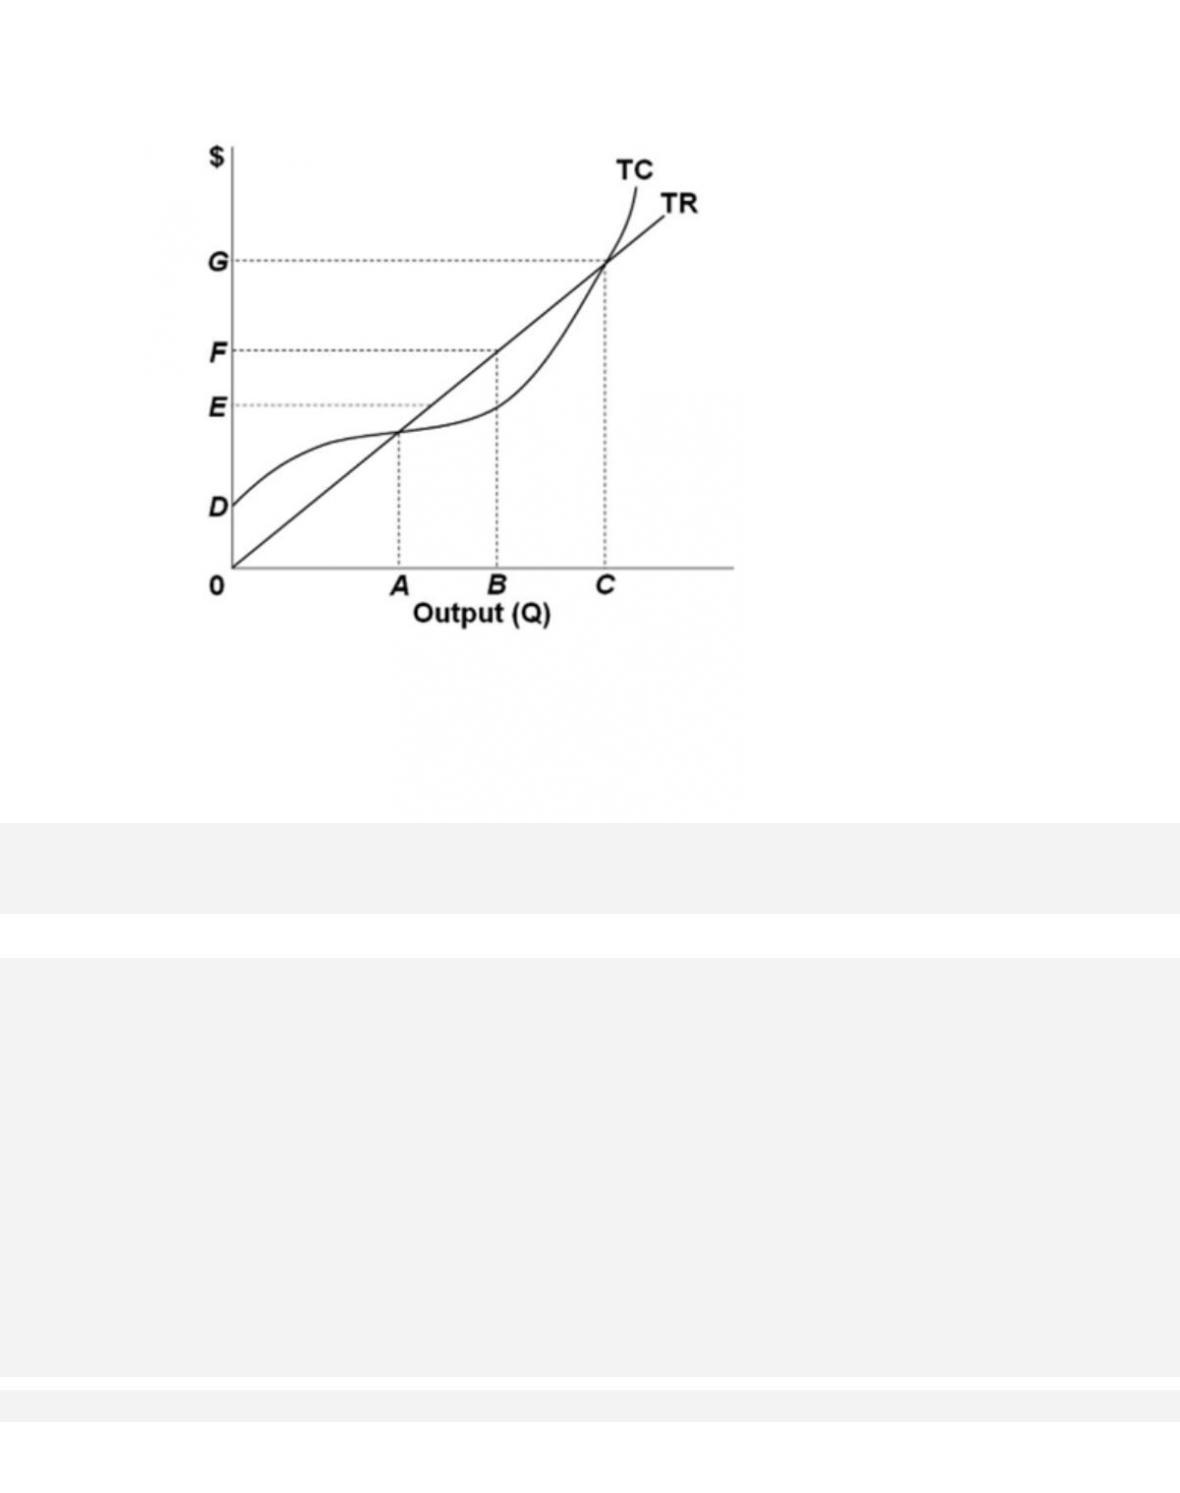
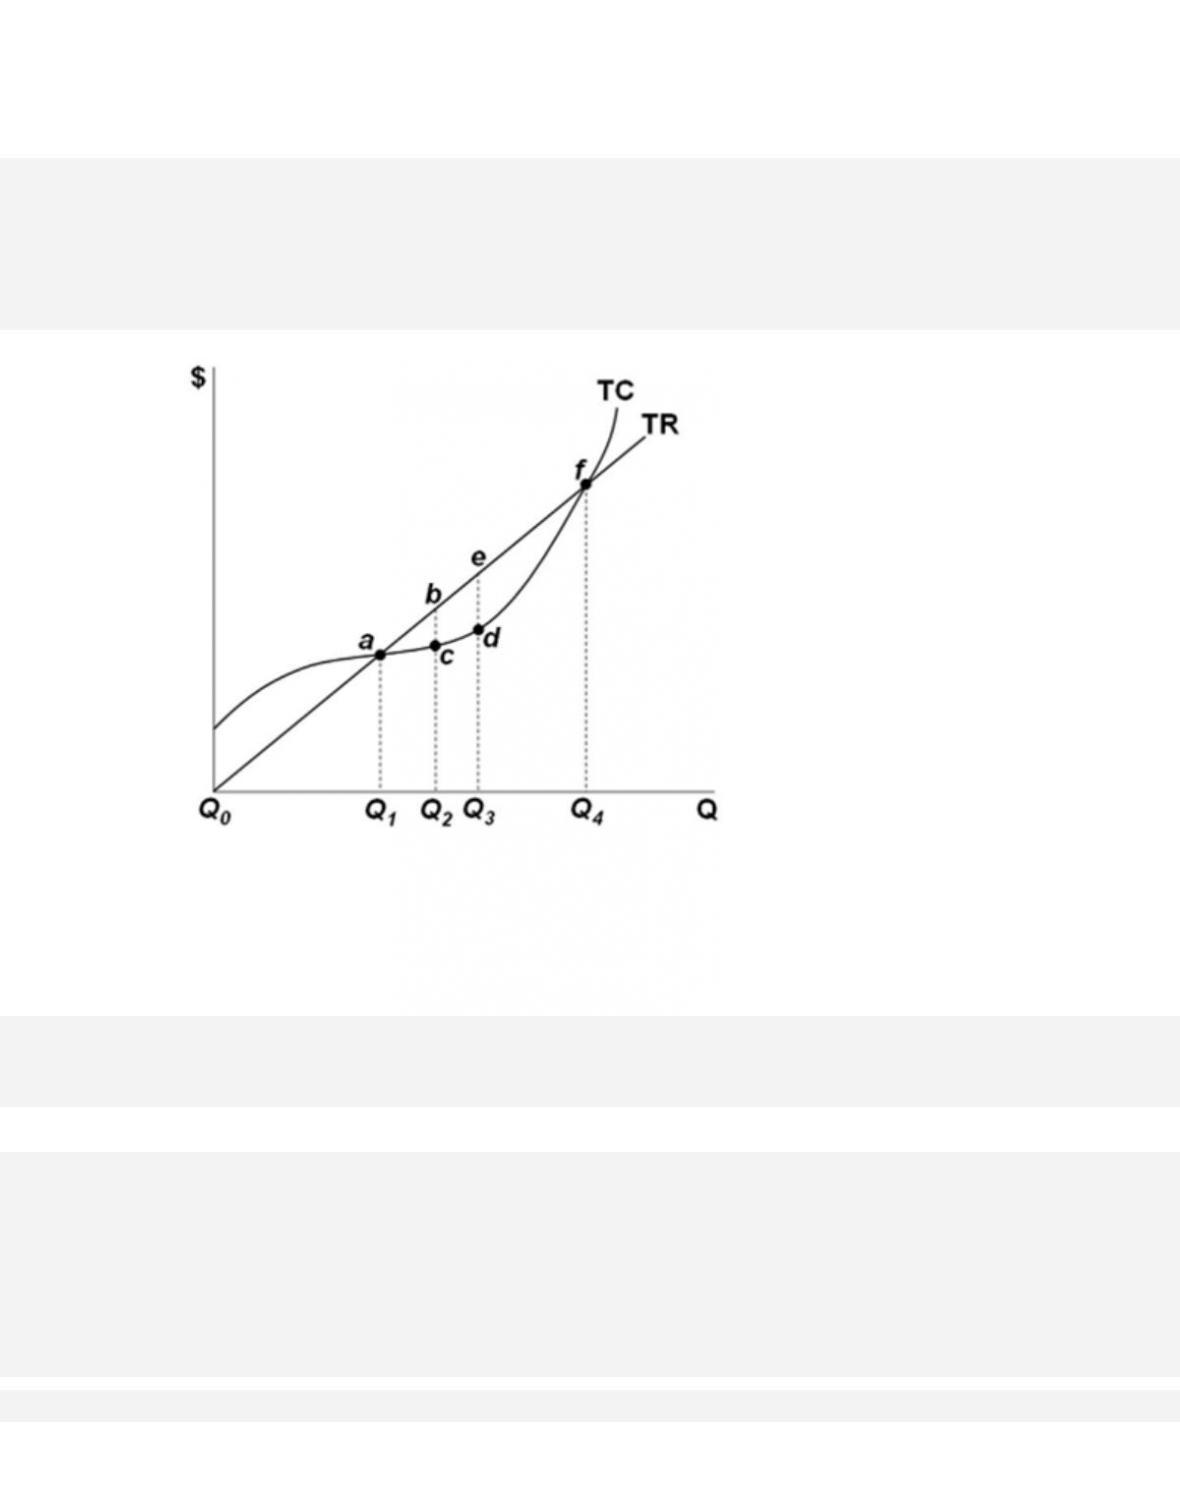
200.
Refer to the provided graph for a purely competitive firm in the short run. If the firm increases
its output level from B to C, then its total profits will
be
201.
Output
Total Cost
0
$2,500
1
2,700
2
3,100
3
3,700
4
4,500
5
6,000
The table shows the total costs for a purely competitive firm. If the firm shuts down in the short
run, the total cost will be
202.
Output
Total Cost
0
$2,500
1
2,700
2
3,100
3
3,700
4
4,500
5
6,000
The table shows the total costs for a purely competitive firm. If the product sells for $1,200 a
unit, the firm’s profit-maximizing output is
10-114
Copyright © 2018 McGraw-Hill Education. All rights reserved. No reproduction or distribution without the prior
written consent of McGraw-Hill Education.
D i f f i c u lt y :
02 Medium
Learning Objective: 10–04 Convey how purely competitive firms can use the total-revenue–
total-cost approach to maximize profits or minimize losses in the short run.
Test Bank: II
Topic:
Profit Maximization in the Short Run: Total-Revenue–Total-Cost Approach
203.
Price
Quantity
TFC
TVC
$5
5
$25
$10
5
10
25
20
5
15
25
50
5
20
25
60
Given the data in the table, at what quantity would a purely competitive firm cover all of its
costs and earn only normal profits?
204. Total Revenue $3,000 Per Week
Total Variable Cost $2,000 Per Week
Total Fixed Cost
$2,000 Per Week
Let us suppose Harry’s, a local supplier of chili and pizza, has the revenue and cost structure
shown here.
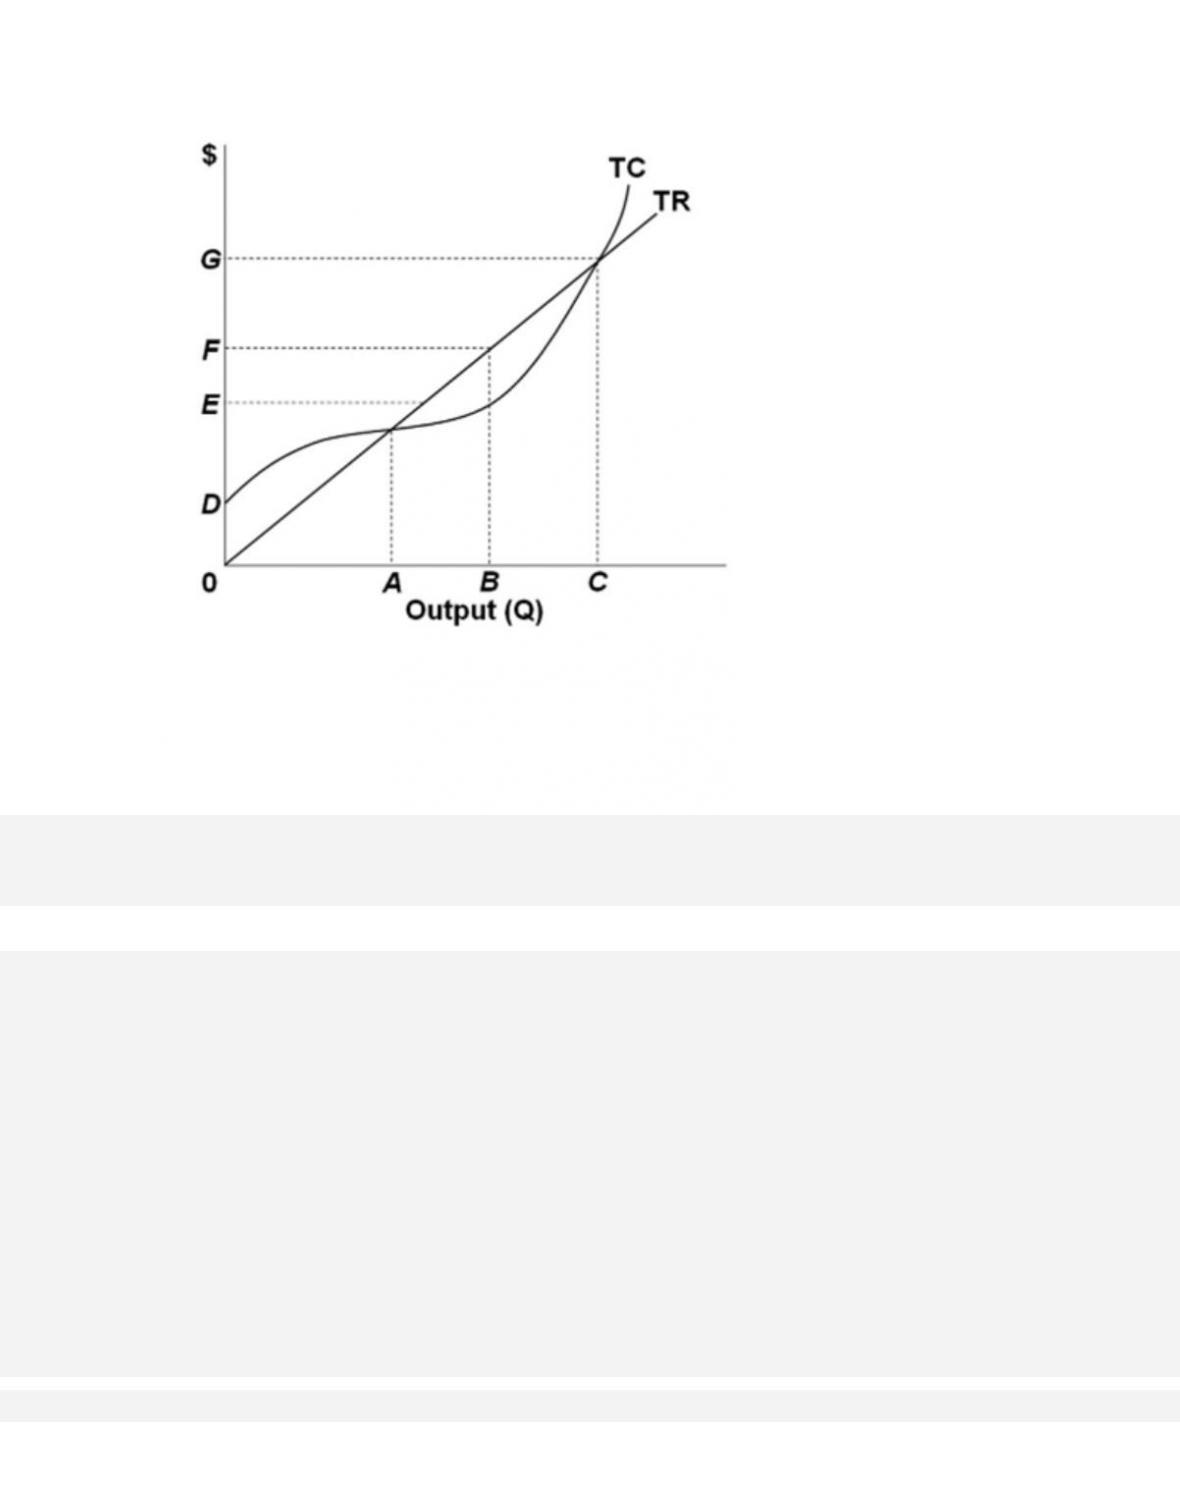
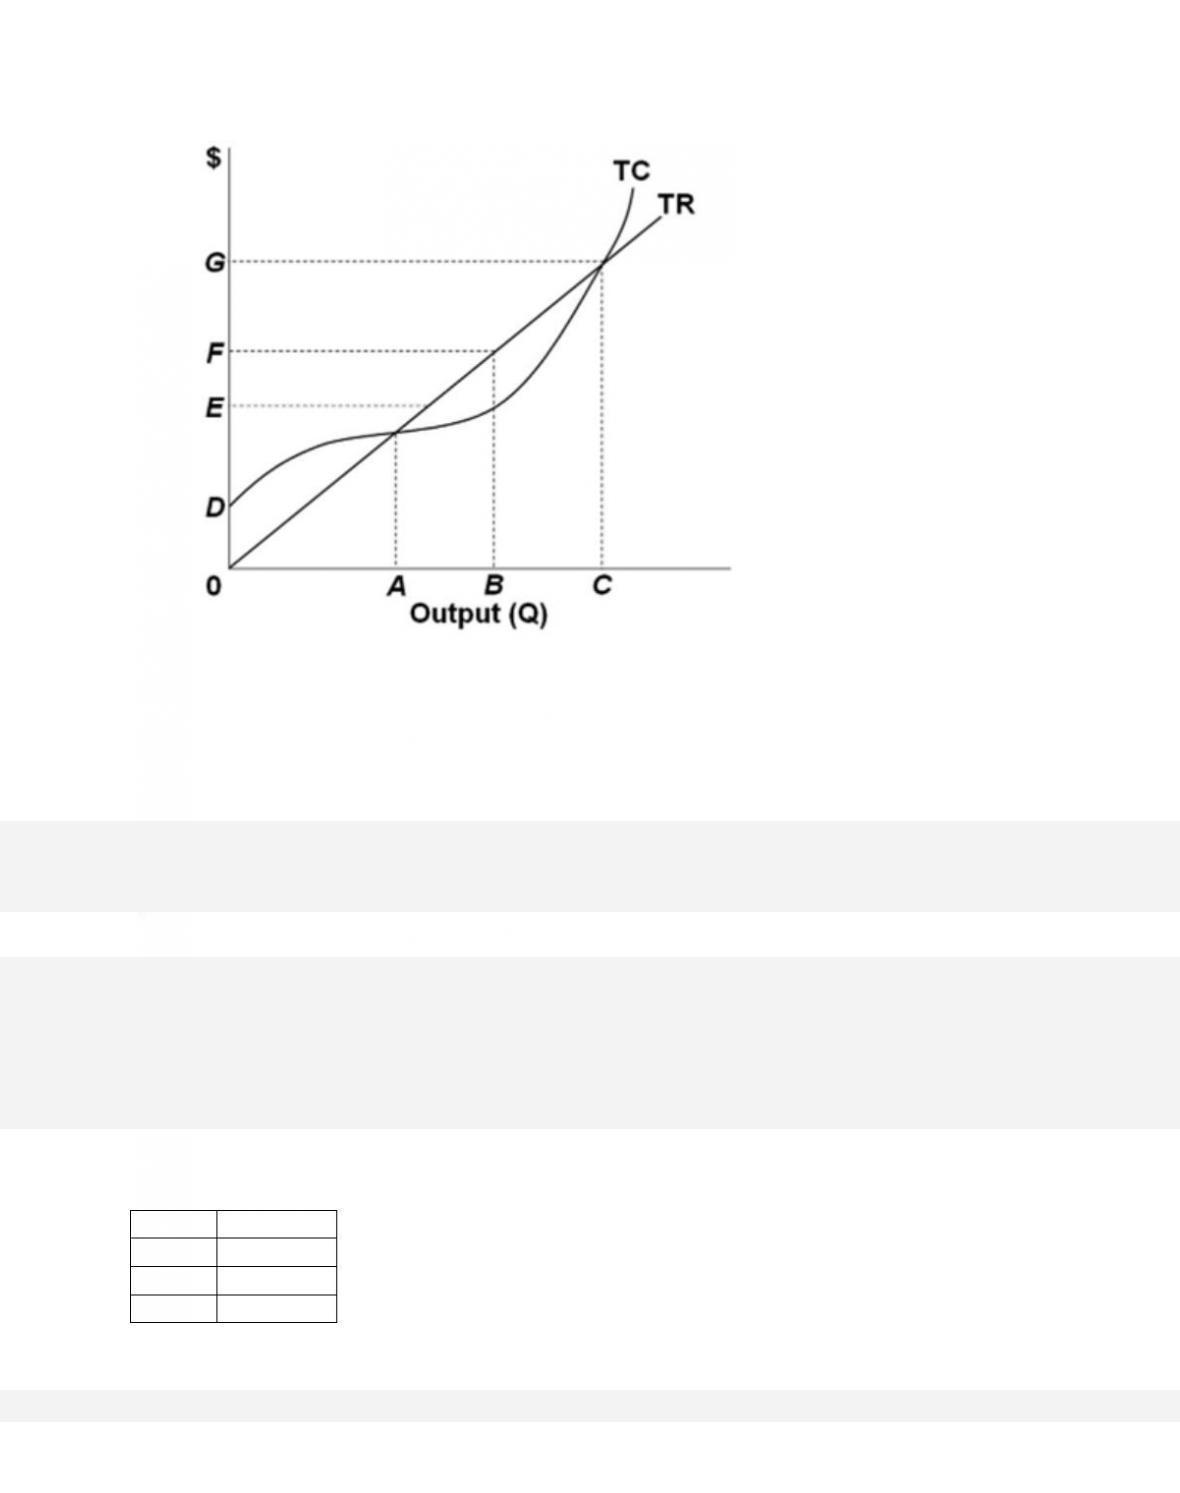
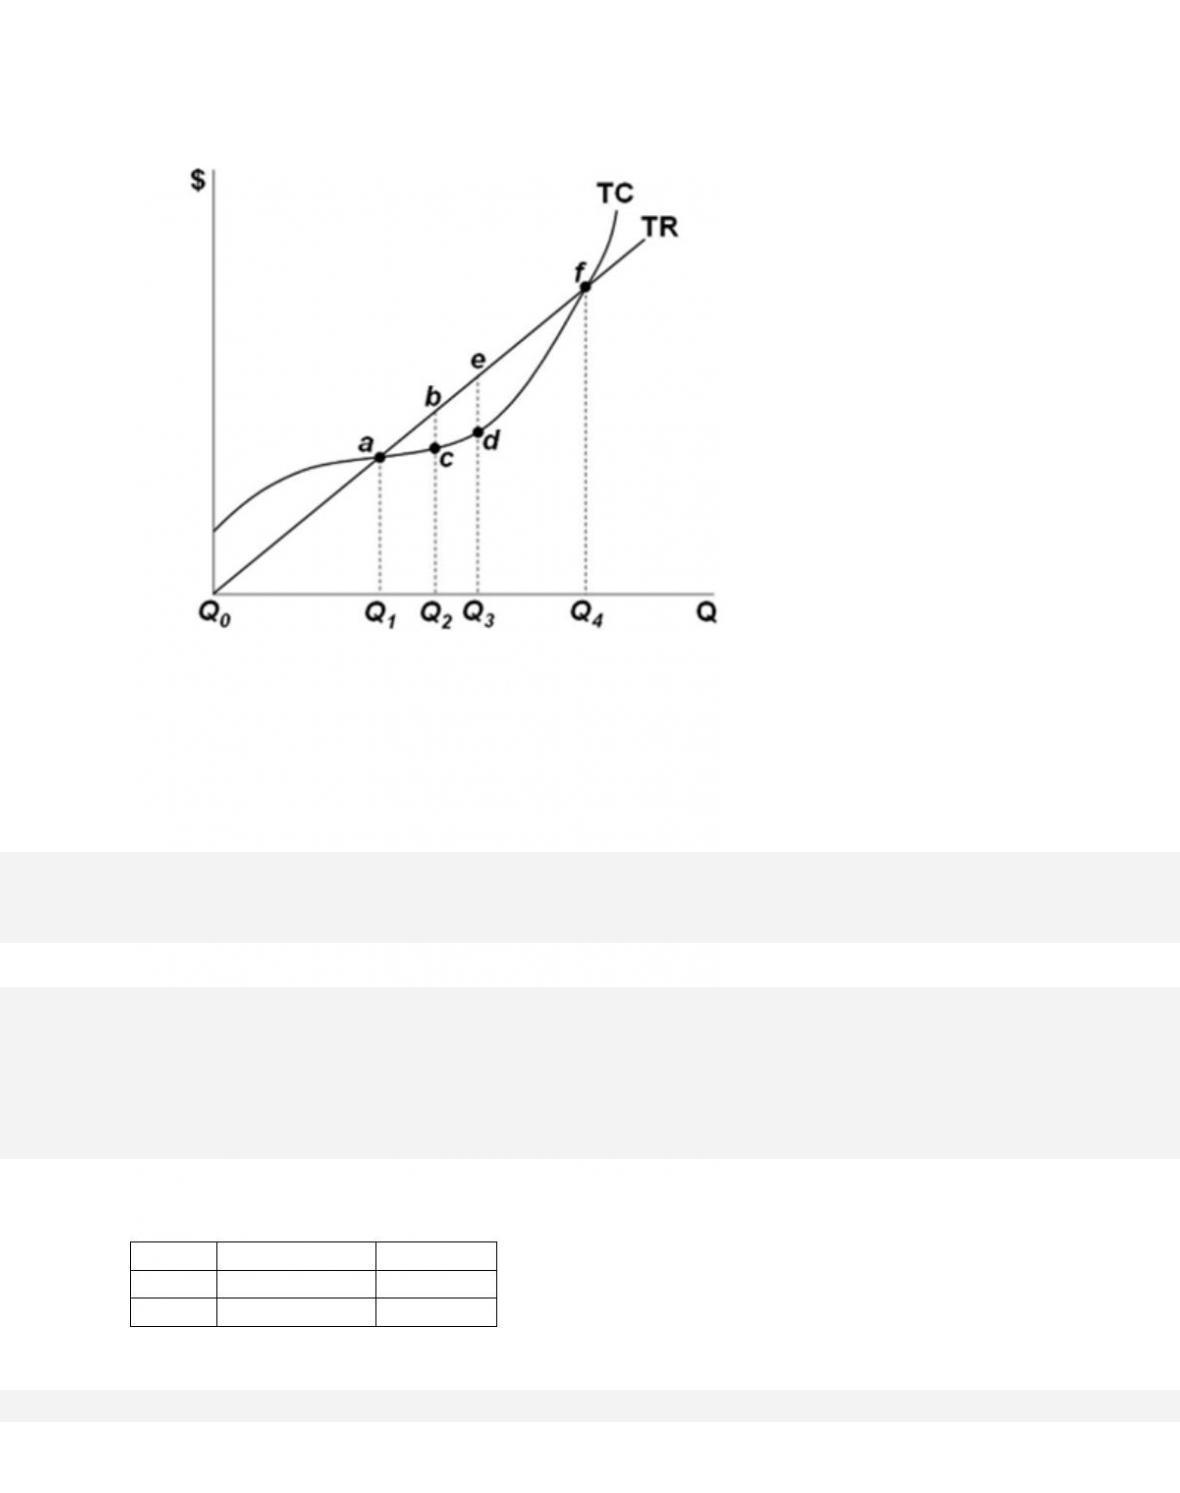
205.
Which of the output levels in the accompanying graph is the profit-maximizing output level for
this firm?
10-116
Copyright © 2018 McGraw-Hill Education. All rights reserved. No reproduction or distribution without the prior
written consent of McGraw-Hill Education.
AACSB: Knowledge Application
Blooms: Understand
D i f f i c u lt y :
02 Medium
Learning Objective: 10–04 Convey how purely competitive firms can use the total-revenue–
total-cost approach to maximize profits or minimize losses in the short run.
Test Bank: II
Topic:
Profit Maximization in the Short Run: Total-Revenue–Total-Cost Approach
206.
In the graph, the amount of profit is measured by the gap between
10-117
207.
In a typical graph for a purely competitive firm, at the point where the total cost and total
revenue curves intersect, the firm
208.
Output
Total Revenue
Total Cost
0
$0
$50
1
40
74
2
80
94
3
120
117
4
160
142
5
200
172
The table gives data for a purely competitive firm. The market price of the product in the short
run is
209.
Output
Total Revenue
Total Cost
0
$0
$50
1
40
74
2
80
94
3
120
117
4
160
142
5
200
172
The table gives data for a purely competitive firm. The marginal revenue from the third unit of
output is
10-119
Copyright © 2018 McGraw-Hill Education. All rights reserved. No reproduction or distribution without the prior
written consent of McGraw-Hill Education.
D i f f i c u lt y :
02 Medium
Learning Objective: 10–05 Explain how purely competitive firms can use the marginal-revenue–
marginal-cost approach to maximize profits or minimize losses in the short run.
Test Bank: II
Topic:
Profit Maximization in the Short Run: Marginal-Revenue–Marginal-Cost Approach
210.
Output
Total Revenue
Total Cost
0
$0
$50
1
40
74
2
80
94
3
120
117
4
160
142
5
200
172
The table gives data for a purely competitive firm. When the firm produces 3 units of output, it
makes an economic
211.
Rent (Binding 20-Year Lease) $1,000 Per Week
Sales $2,000 Per Week
Raw Material Cost $1,000 Per Week
Value of Your Own Labor $500 Per Week
As president and owner of the Sour Grapes Lemonade Company, you face the costs shown. To
maximize your financial well-being, you should

10-120
Copyright © 2018 McGraw-Hill Education. All rights reserved. No reproduction or distribution without the prior
written consent of McGraw-Hill Education.
B.
shut down because variable costs exceed fixed costs.
C.
shut down because the company is losing money.
D. continue operating in the short run.
AACSB: Knowledge Application
Blooms: Understand
D i f f i c u lt y :
02 Medium
Learning Objective: 10–04 Convey how purely competitive firms can use the total-revenue–
total-cost approach to maximize profits or minimize losses in the short run.
Test Bank: II
Topic:
Profit Maximization in the Short Run: Total-Revenue–Total-Cost Approach
212.
A profit-maximizing firm in the short run will expand output
213.
Farmer Jones is producing wheat and must accept the market price of $6.00 per bushel. At
this time, her average total costs and her marginal costs
both equal $8.00 per bushel. Her
average variable costs are $5 per bushel. In order to maximize profits or minimize losses in the
short run, farmer
Jones should