10–41
Copyright © 2018 McGraw-Hill Education. All rights reserved. No reproduction or distribution without the prior
written consent of McGraw-Hill Education.
marginal-cost approach to maximize profits or minimize losses in the short run.
Test Bank: I
T o p i c :
Profit Maximization in the Short Run: Marginal-Revenue–Marginal-Cost Approach
Type: Table
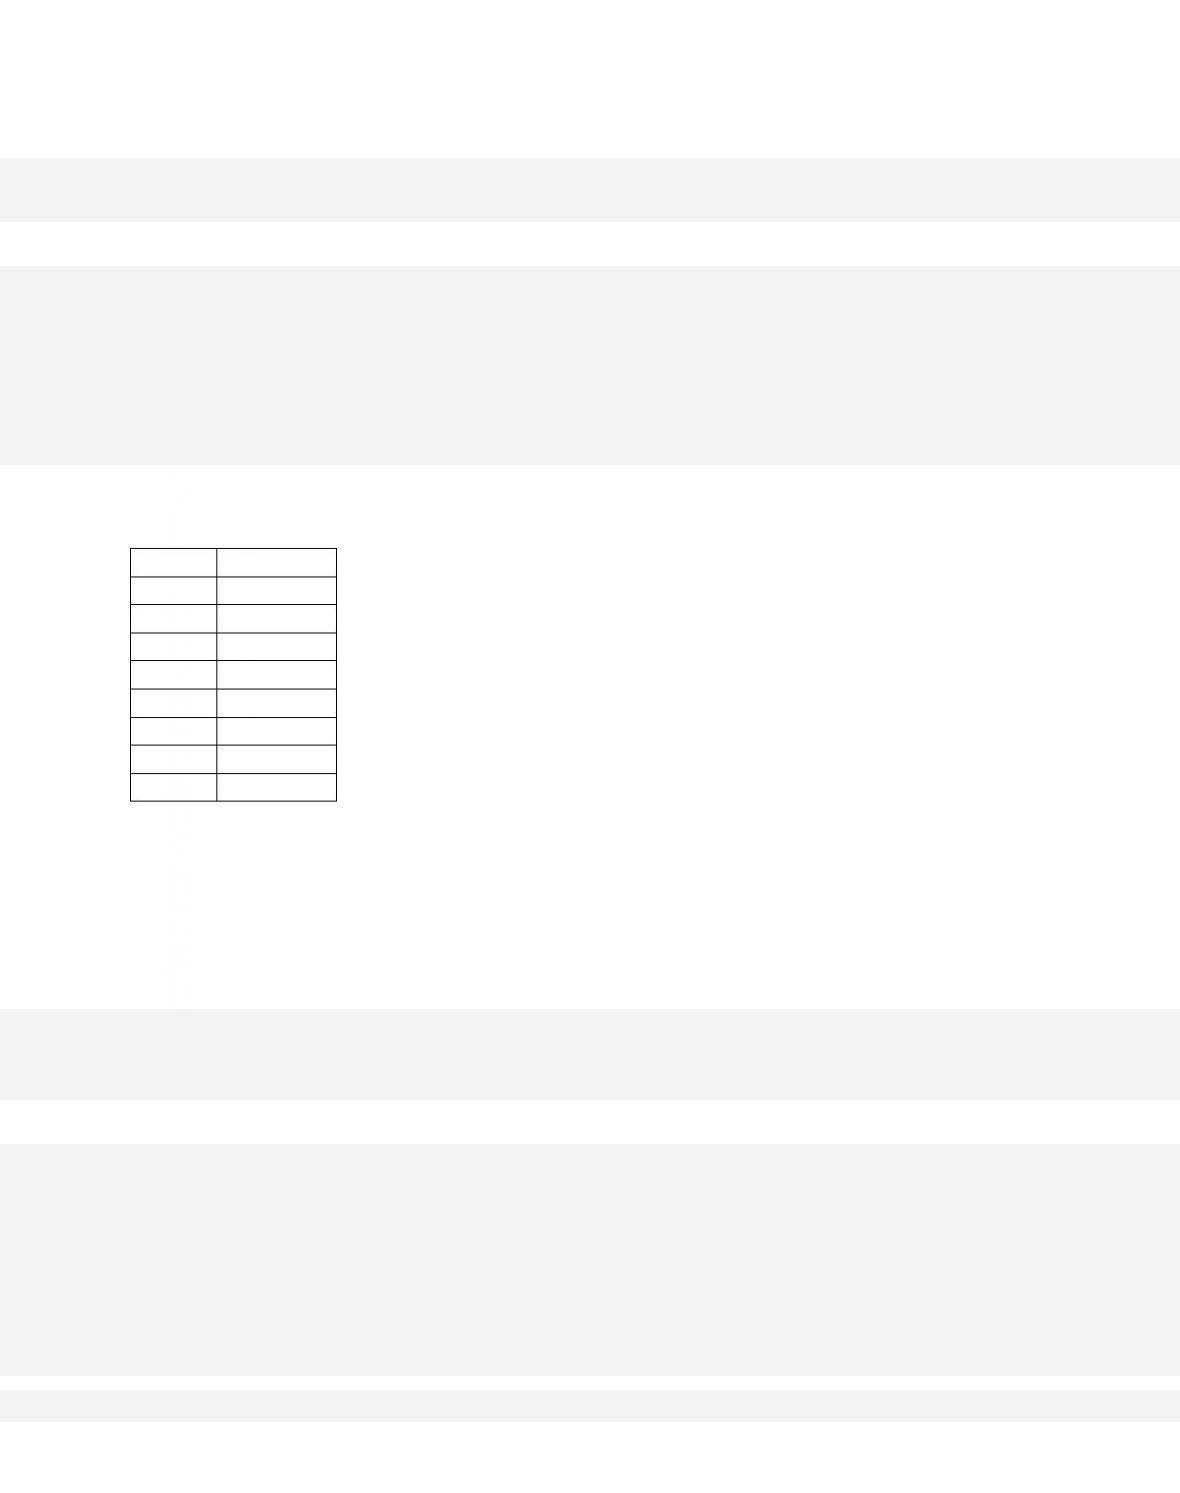
77.
Total
Product
Average Fixed
Cost
Average Variable
Cost
Average Total
Cost
Marginal
Cost
1
$100.00
$17.00
$117.00
$17
2
50.00
16.00
66.00
15
3
33.33
15.00
48.33
13
4
25.00
14.25
39.25
12
5
20.00
14.00
34.00
13
6
16.67
14.00
30.67
14
7
14.29
15.71
30.00
26
8
12.50
17.50
30.00
30
9
11.11
19.44
30.55
35
10
10.00
21.60
31.60
41
11
9.09
24.00
33.09
48
12
8.33
26.67
35.00
56
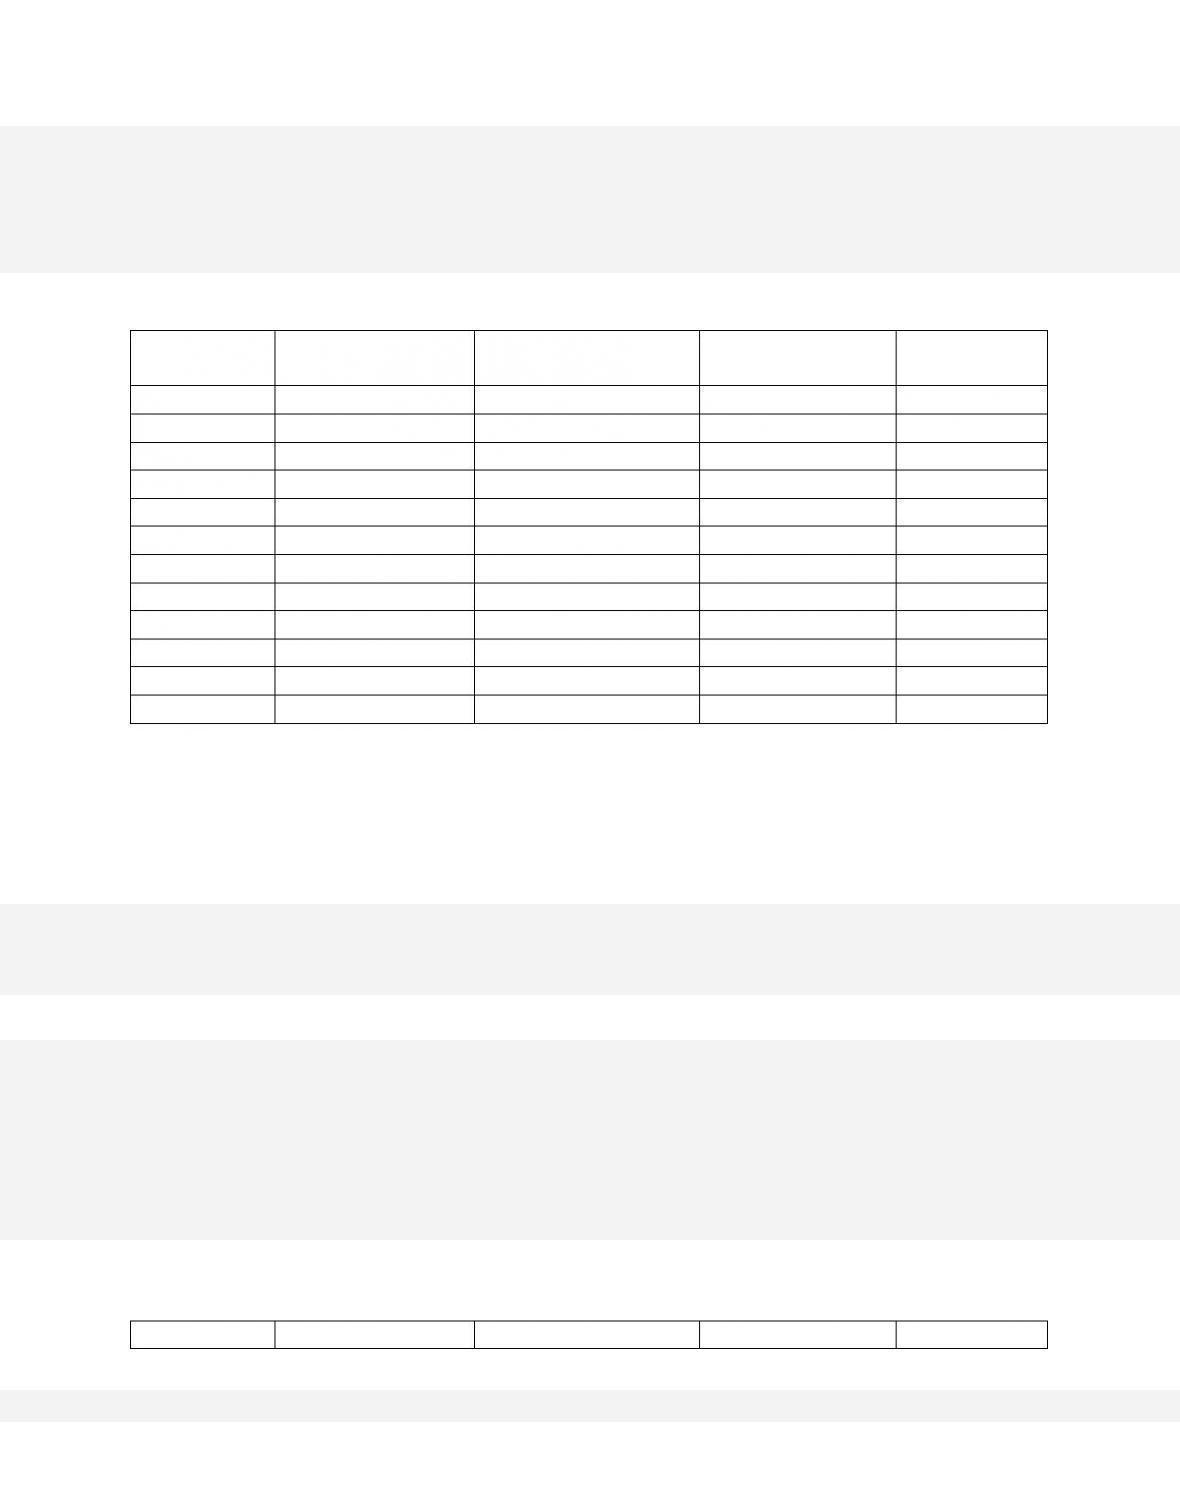
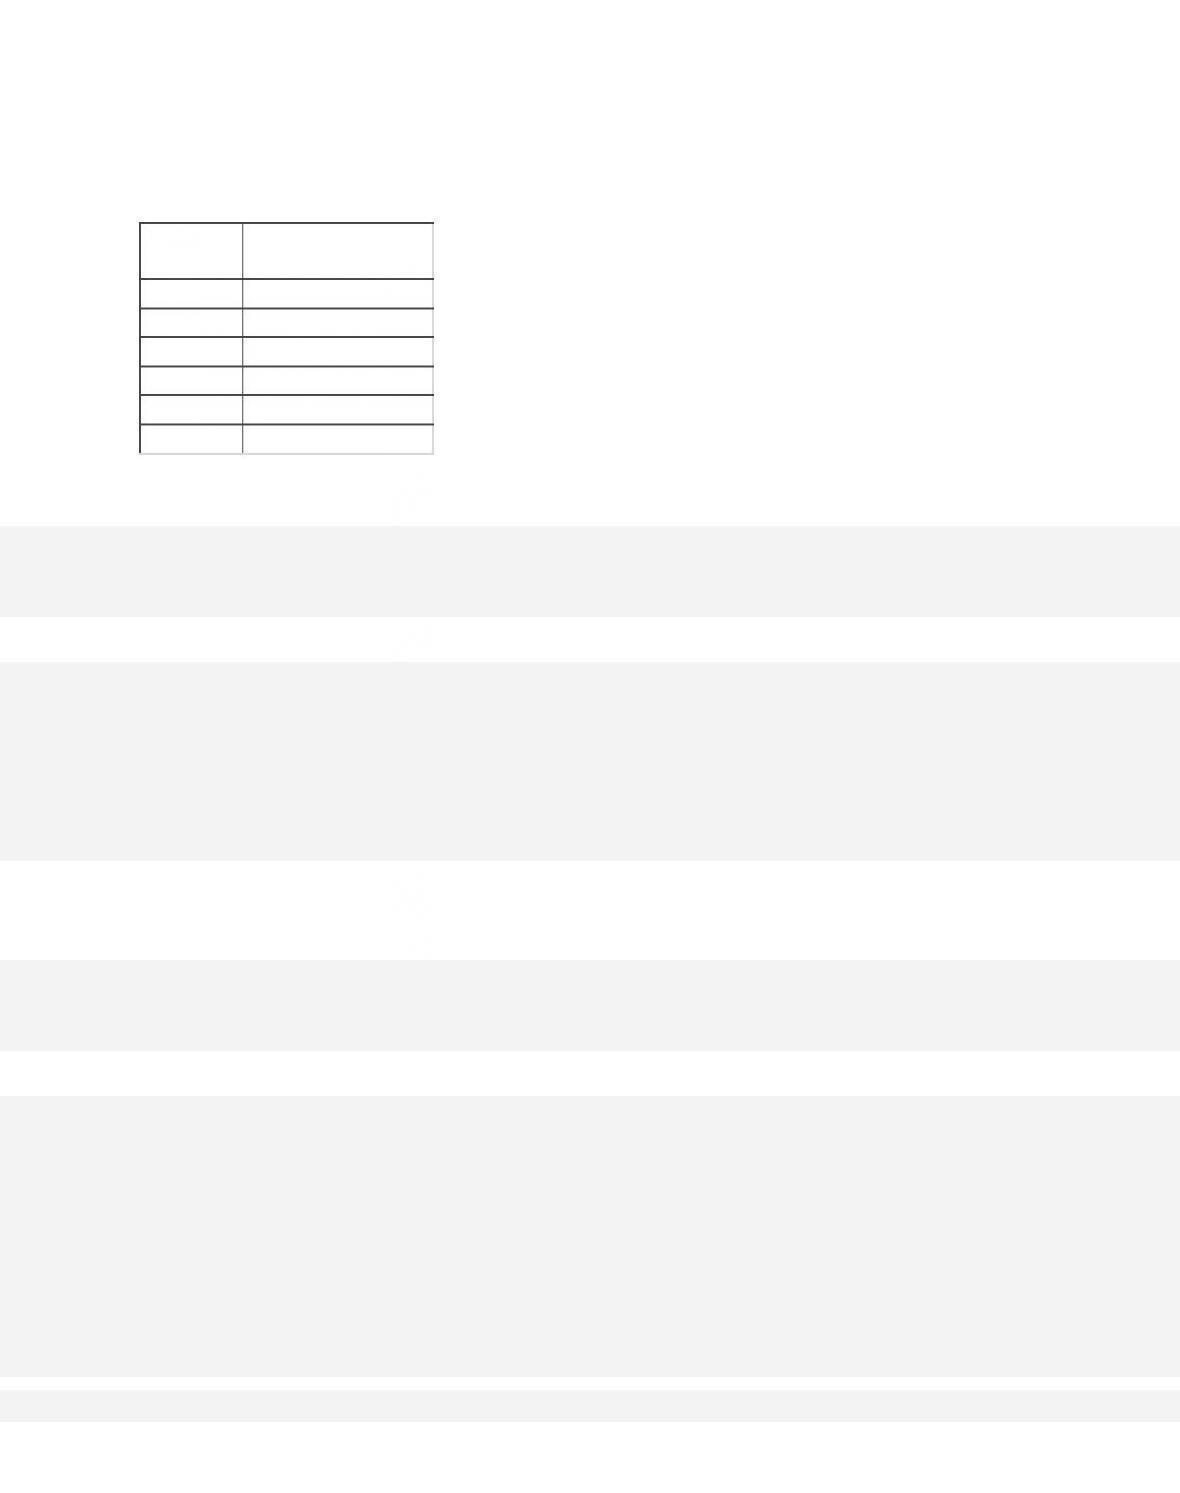
The accompanying table gives cost data for a firm that is selling in a purely competitive market.
If the market price for the firm’s product is $32, the
competitive firm will produce
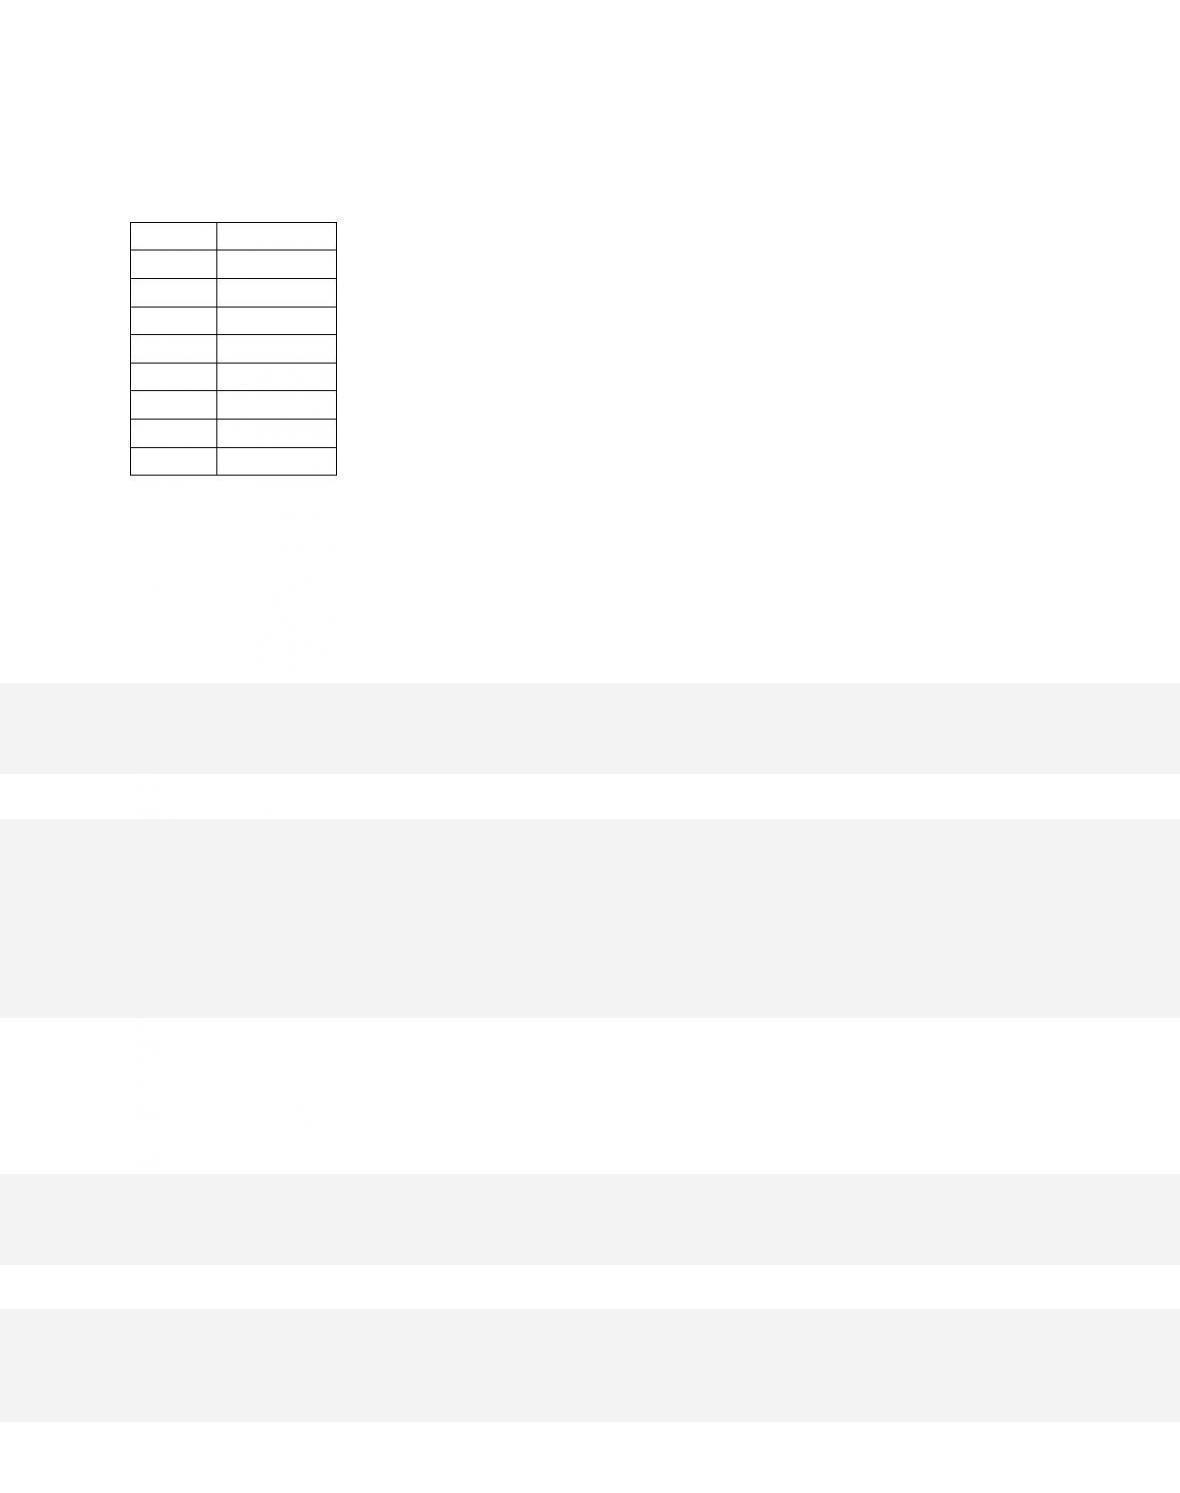
78.
Total
Average Fixed
Average Variable
Average Total
Marginal
10–42
Product
Cost
Cost
Cost
Cost
1
$100.00
$17.00
$117.00
$17
2
50.00
16.00
66.00
15
3
33.33
15.00
48.33
13
4
25.00
14.25
39.25
12
5
20.00
14.00
34.00
13
6
16.67
14.00
30.67
14
7
14.29
15.71
30.00
26
8
12.50
17.50
30.00
30
9
11.11
19.44
30.55
35
10
10.00
21.60
31.60
41
11
9.09
24.00
33.09
48
12
8.33
26.67
35.00
56
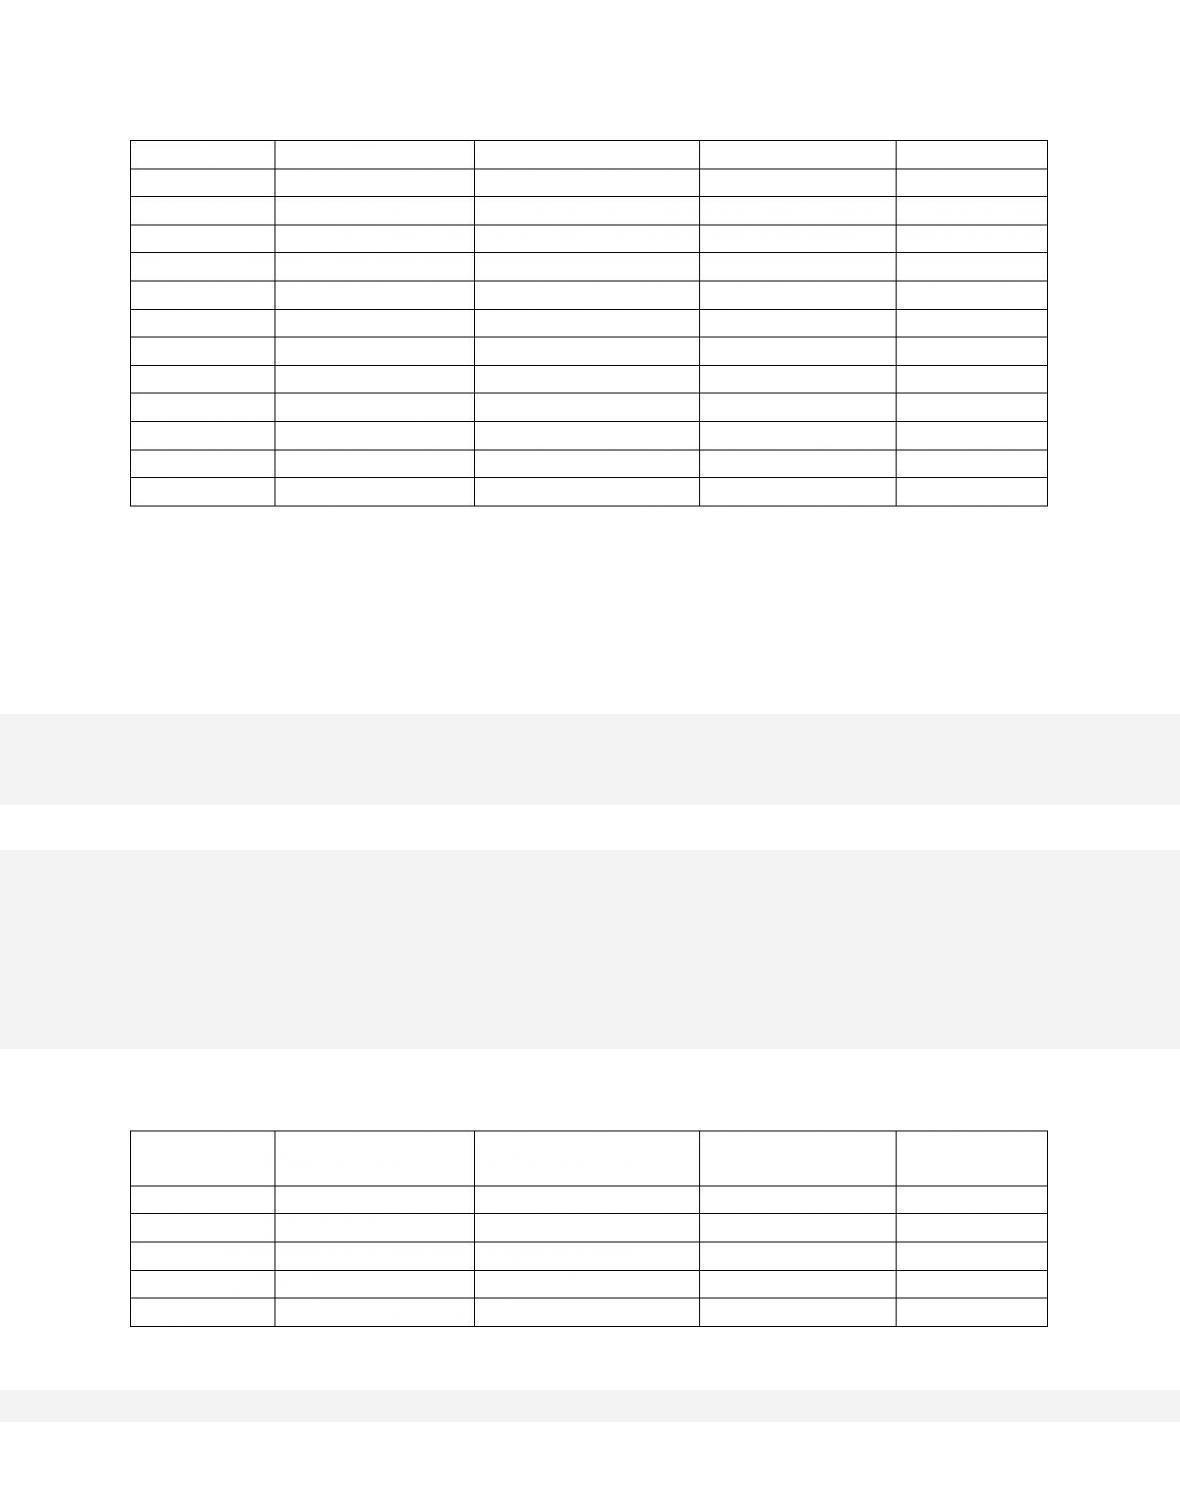
The accompanying table gives cost data for a firm that is selling in a purely competitive market.
If the market price for the firm’s product is $28, the
competitive firm will
79.
Total
Product
Average Fixed
Cost
Average Variable
Cost
Average Total
Cost
Marginal
Cost
1
$100.00
$17.00
$117.00
$17
2
50.00
16.00
66.00
15
3
33.33
15.00
48.33
13
4
25.00
14.25
39.25
12
5
20.00
14.00
34.00
13
6
16.67
14.00
30.67
14
7
14.29
15.71
30.00
26
8
12.50
17.50
30.00
30
9
11.11
19.44
30.55
35
10
10.00
21.60
31.60
41
11
9.09
24.00
33.09
48
12
8.33
26.67
35.00
56
The accompanying table gives cost data for a firm that is selling in a purely competitive
market. Which of the following tables gives the firm’s short-
run supply schedule?
10–44
20
6
13
0
D.
Price
Qs
$50
11
42
10
36
9
32
8
20
6
13
5
80.
Total
Product
Average Fixed
Cost
Average Variable
Cost
Average Total
Cost
Marginal
Cost
1
$100.00
$17.00
$117.00
$17
2
50.00
16.00
66.00
15
3
33.33
15.00
48.33
13
4
25.00
14.25
39.25
12
5
20.00
14.00
34.00
13
6
16.67
14.00
30.67
14
7
14.29
15.71
30.00
26
8
12.50
17.50
30.00
30
9
11.11
19.44
30.55
35
10
10.00
21.60
31.60
41
11
9.09
24.00
33.09
48
12
8.33
26.67
35.00
56
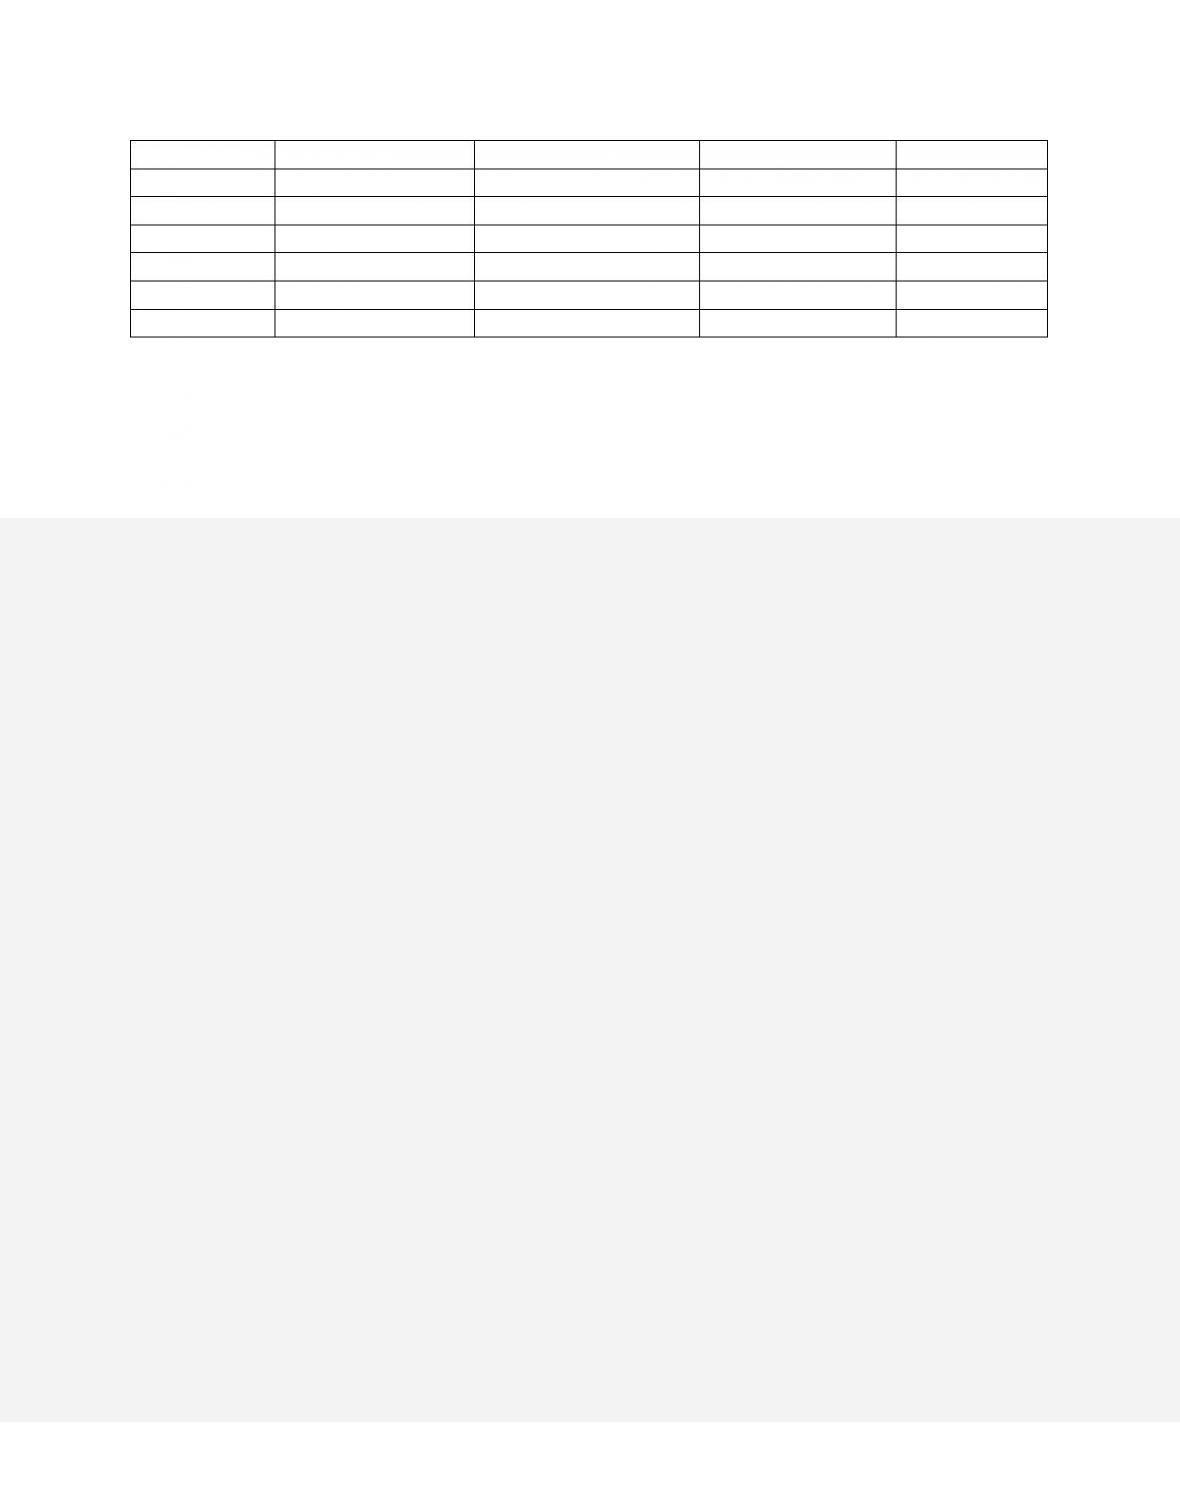
The accompanying table gives cost data for a firm that is selling in a purely competitive
market. If there were 1,000 identical firms in this industry
and total, or market, demand is as
shown in the second table, equilibrium price will be
Price
Quantity
Demanded
$50
3,000
42
6,000
36
9,000
32
11,000
20
14,000
13
19,500
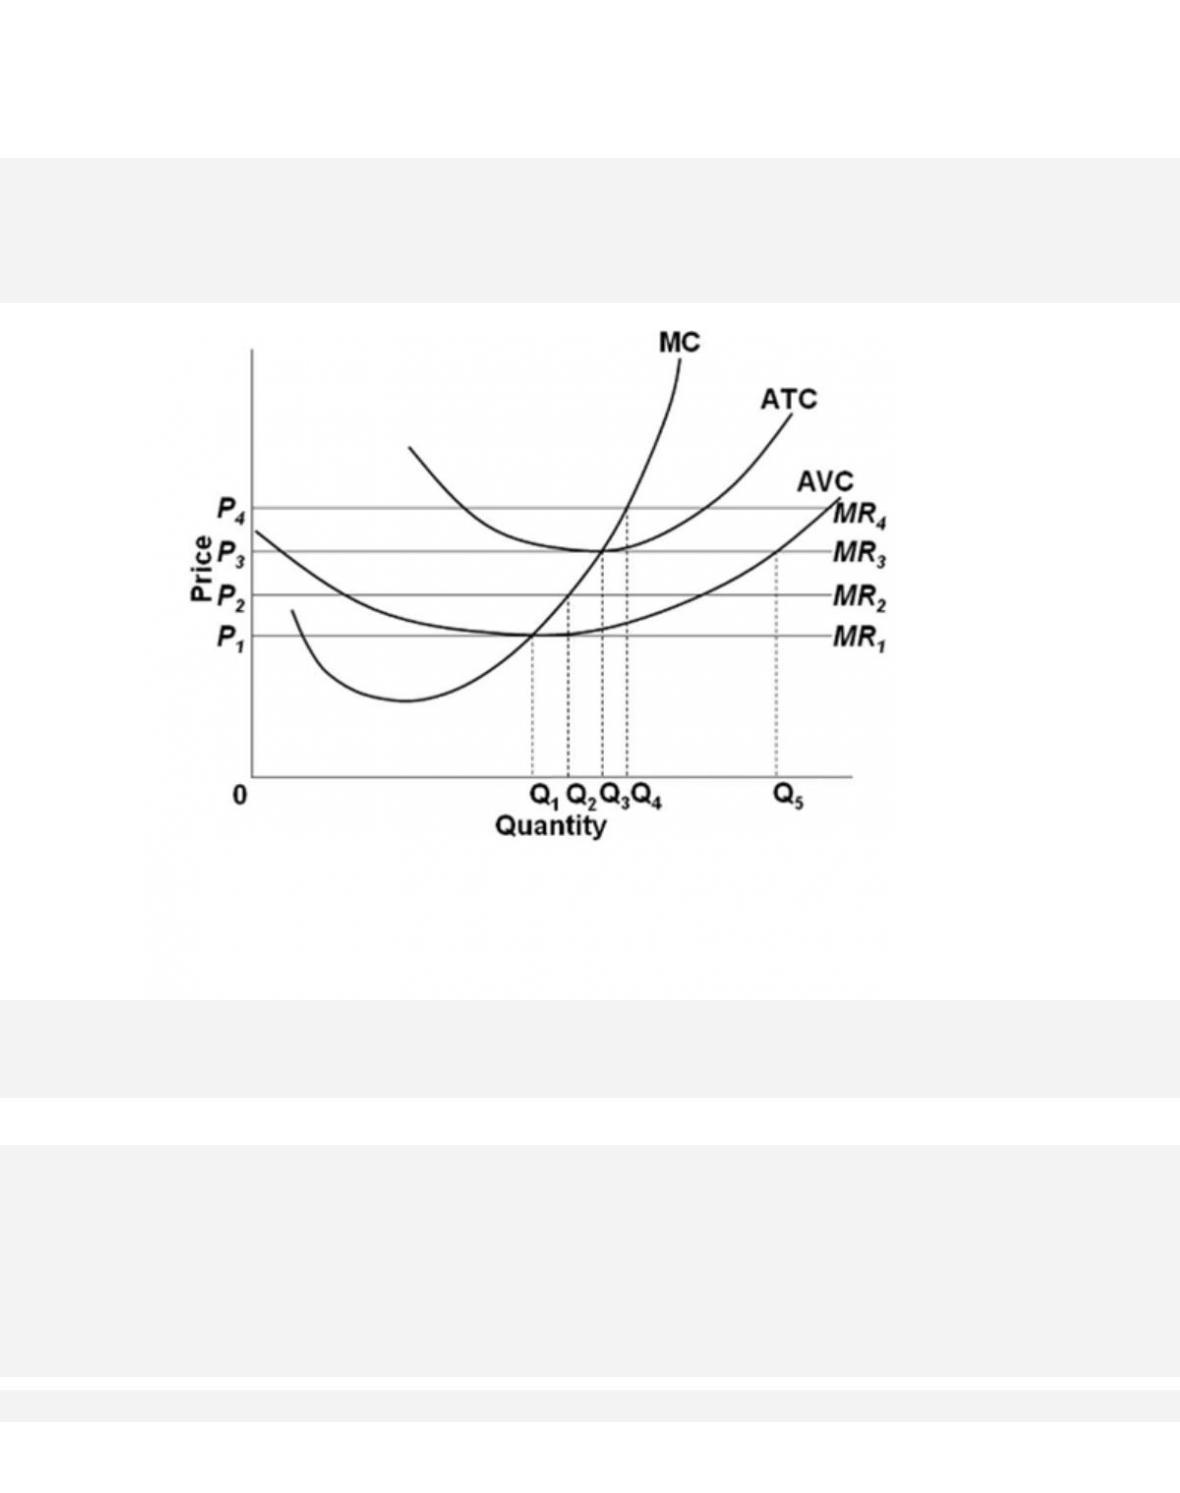
81. If at the MC = MR output, AVC exceeds price,
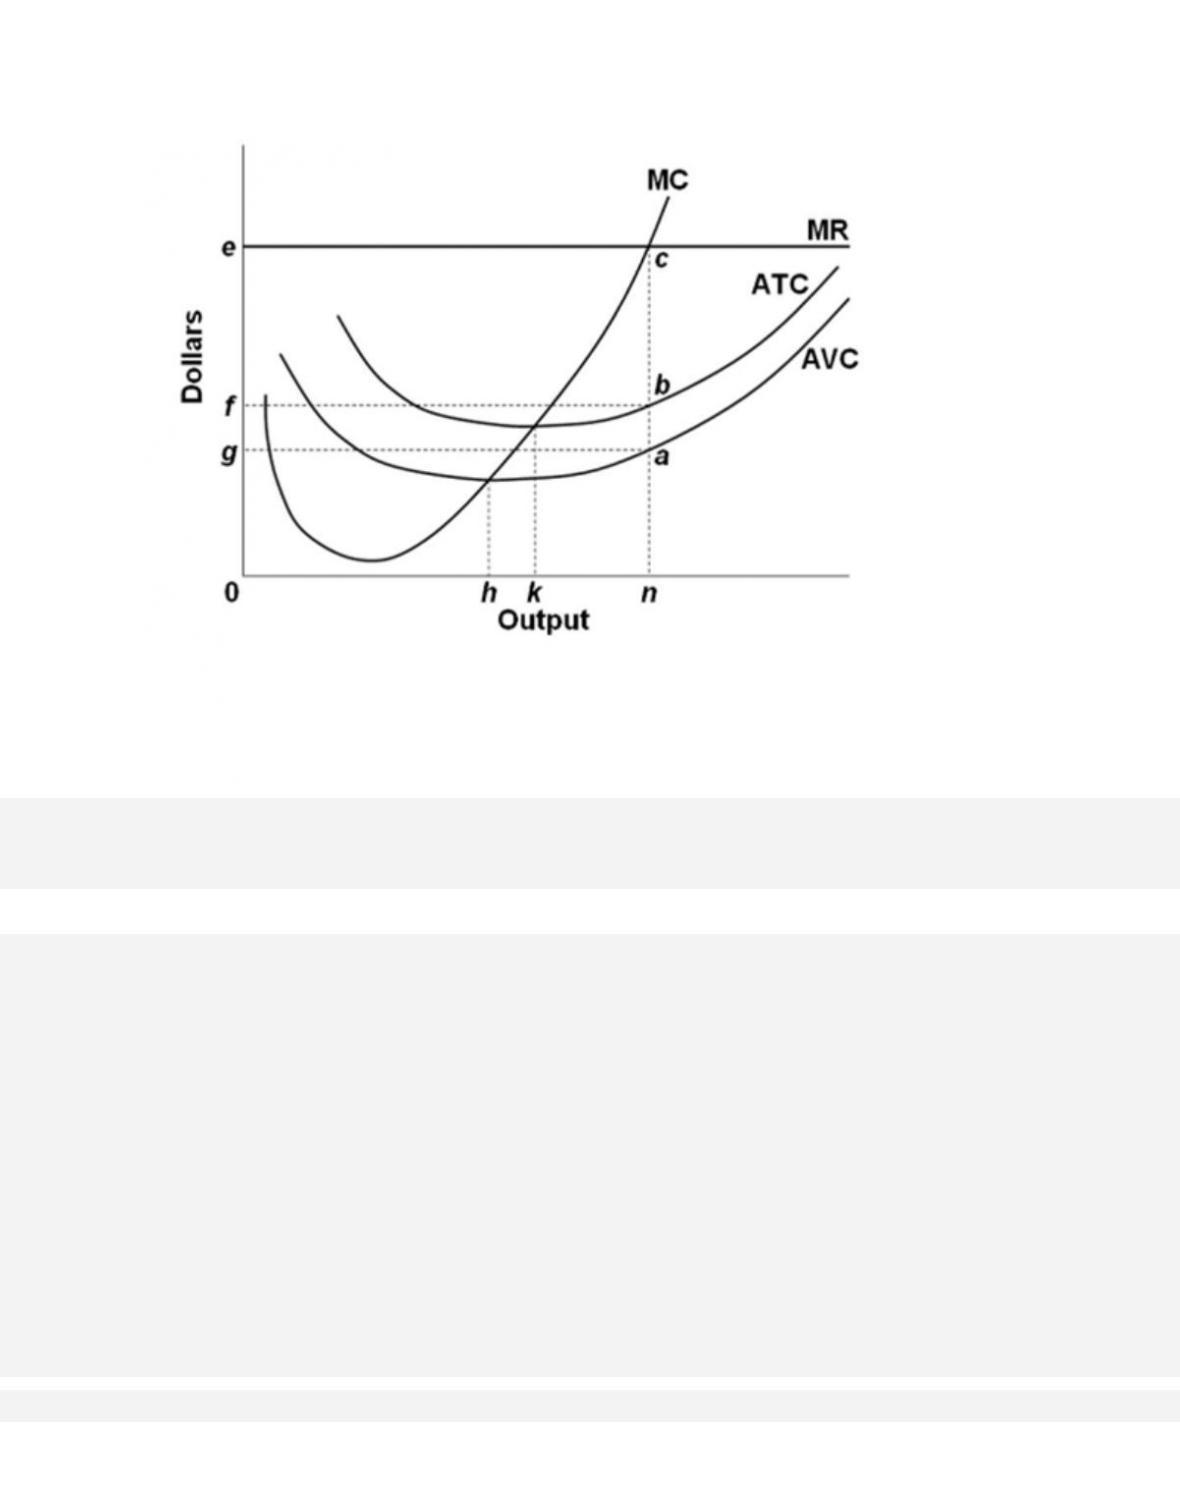
82.
In the provided diagram, the profit-maximizing output
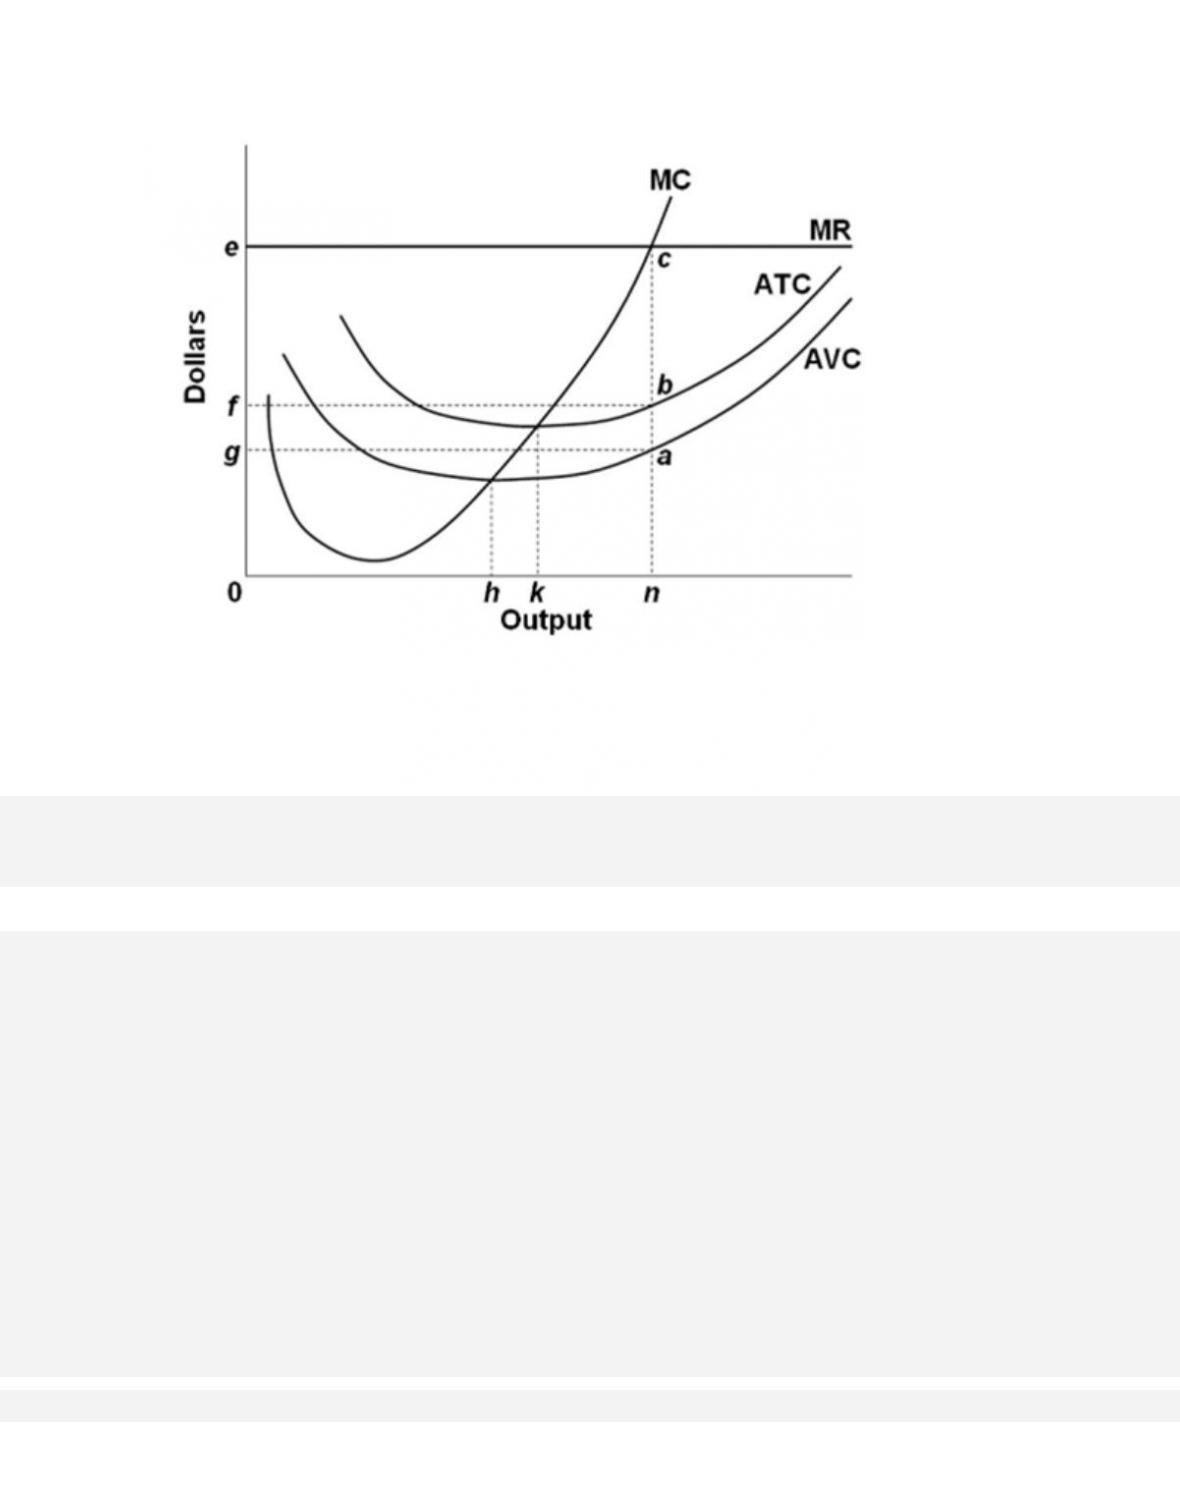
83.
In the provided diagram, at the profit-maximizing output, total profit is

84.
In the provided diagram, the short-run supply curve for this firm is the
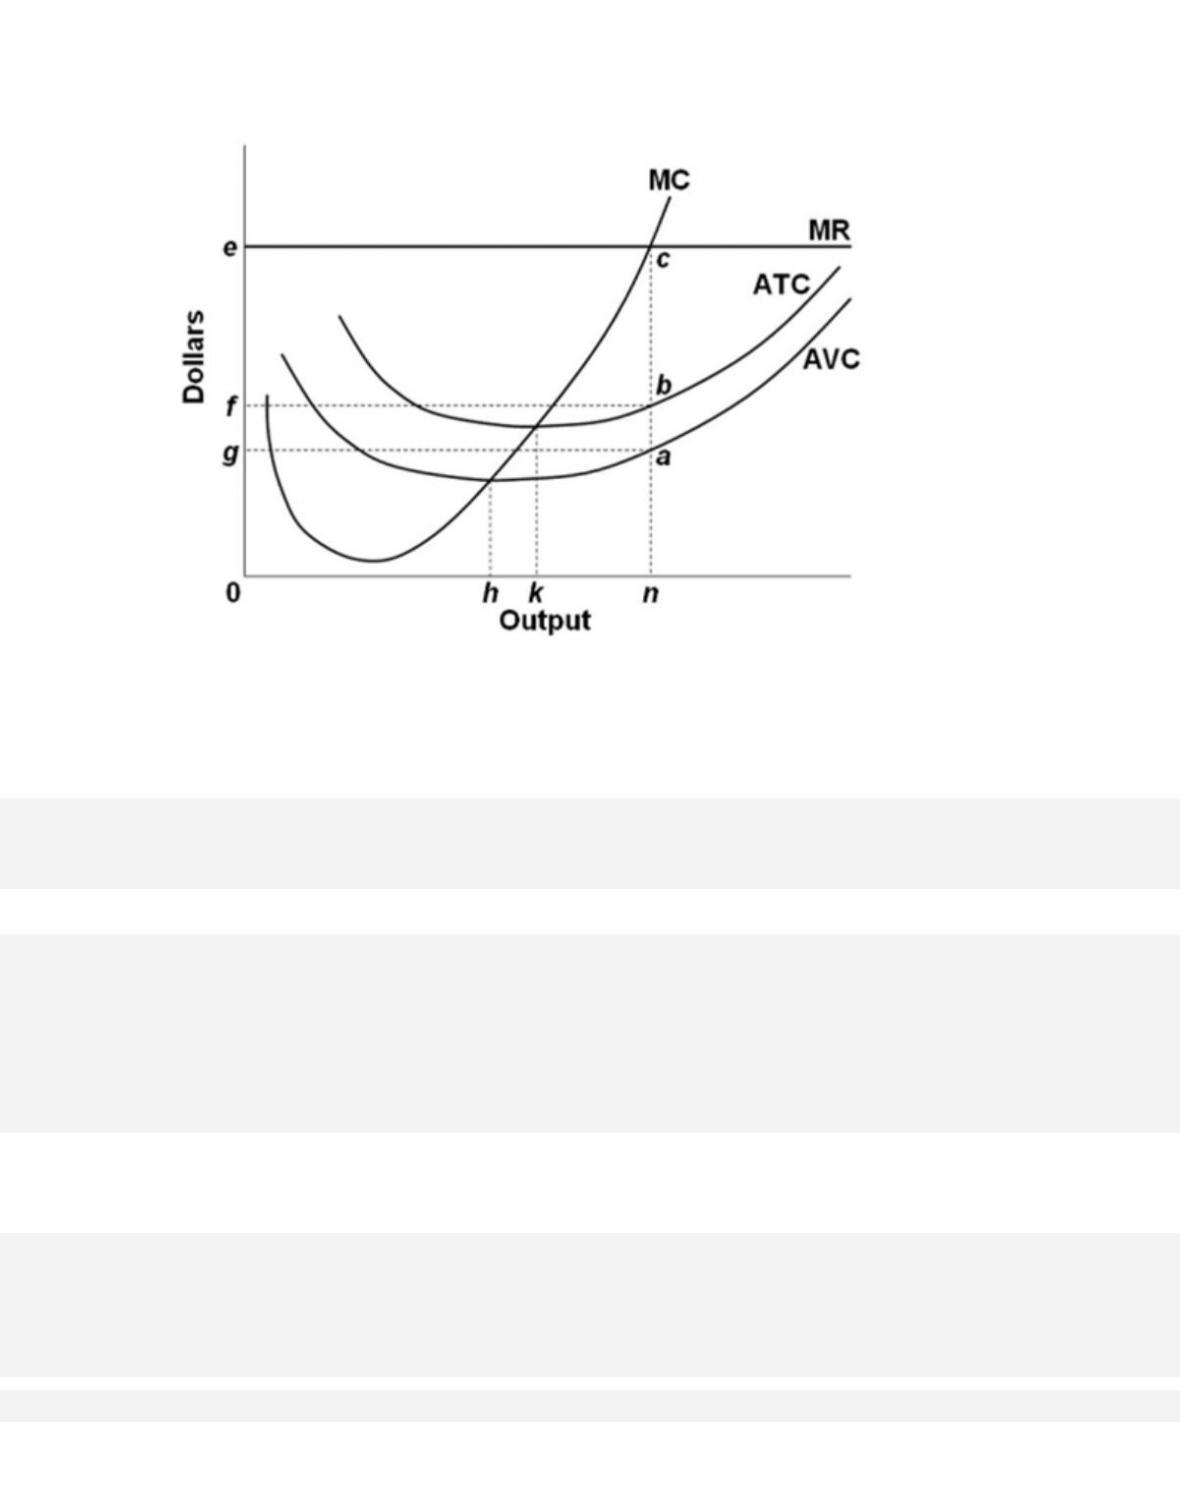
85.
According to the information in the provided diagram, this firm is selling its product in a(n)
86.
In the short run, a purely competitive seller will shut down if product price

87.
The short-run supply curve for a purely competitive industry can be found by
88.
DASH Airlines is considering the addition of a flight from Red Cloud to David City. The
total cost of the flight would be $1,100, of which $800 are
fixed costs already incurred.
Expected revenues from the flight are $600. DASH should

10–51
Copyright © 2018 McGraw-Hill Education. All rights reserved. No reproduction or distribution without the prior
written consent of McGraw-Hill Education.
T o p i c :
Profit Maximization in the Short Run: Marginal-Revenue–Marginal-Cost Approach
89.
In contrast to American firms, Japanese firms frequently make lifetime employment
commitments to their workers and agree not to lay them off when
product demand is weak.
Other things being equal, we would expect Japanese firms to
90.
Assume for a competitive firm that MC = AVC at $12, MC = ATC at $20, and MC = MR at
$16. This firm will
91.
The principle that a firm should produce up to the point where the marginal revenue from
the sale of an extra unit of output is equal to the marginal
cost of producing it is known as the

92.
If a purely competitive firm is producing at the P = MC output and realizing an economic
profit, at that output
93.
If a profit-seeking competitive firm is producing its profit-maximizing output and its total
fixed costs fall by 25 percent, the firm should

94.
At P2 in the accompanying diagram, this firm will
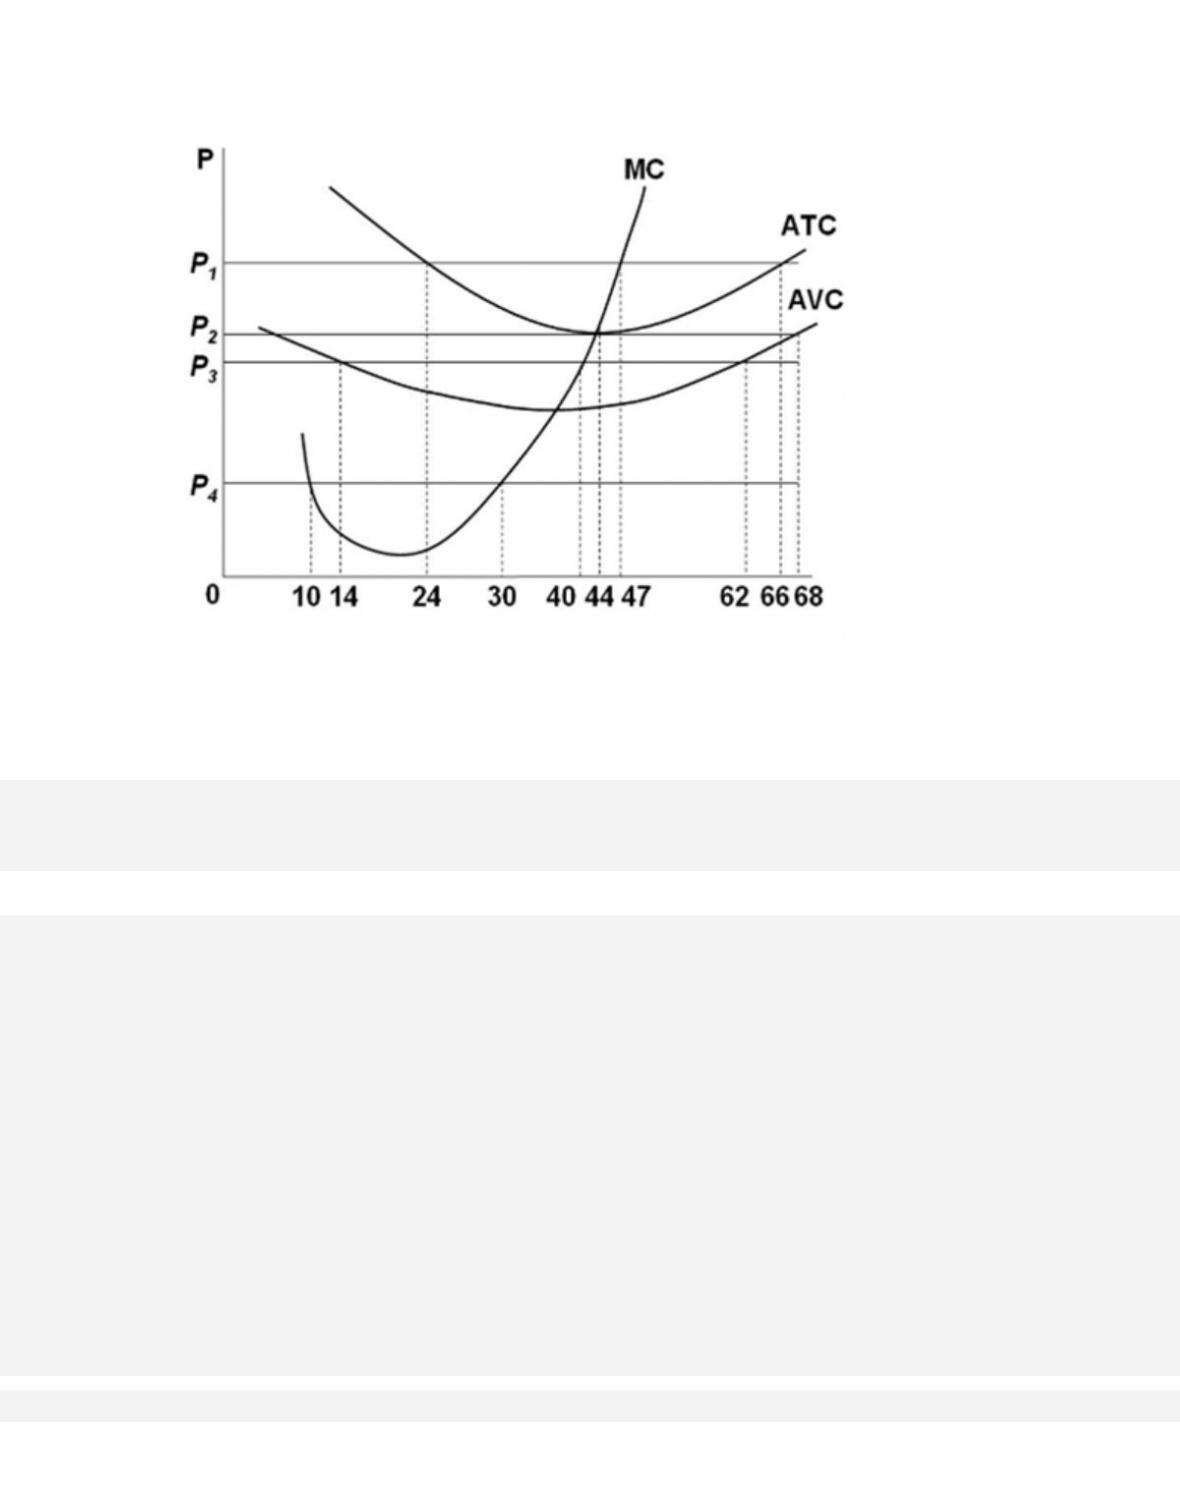
95.
At P1 in the accompanying diagram, this firm will produce
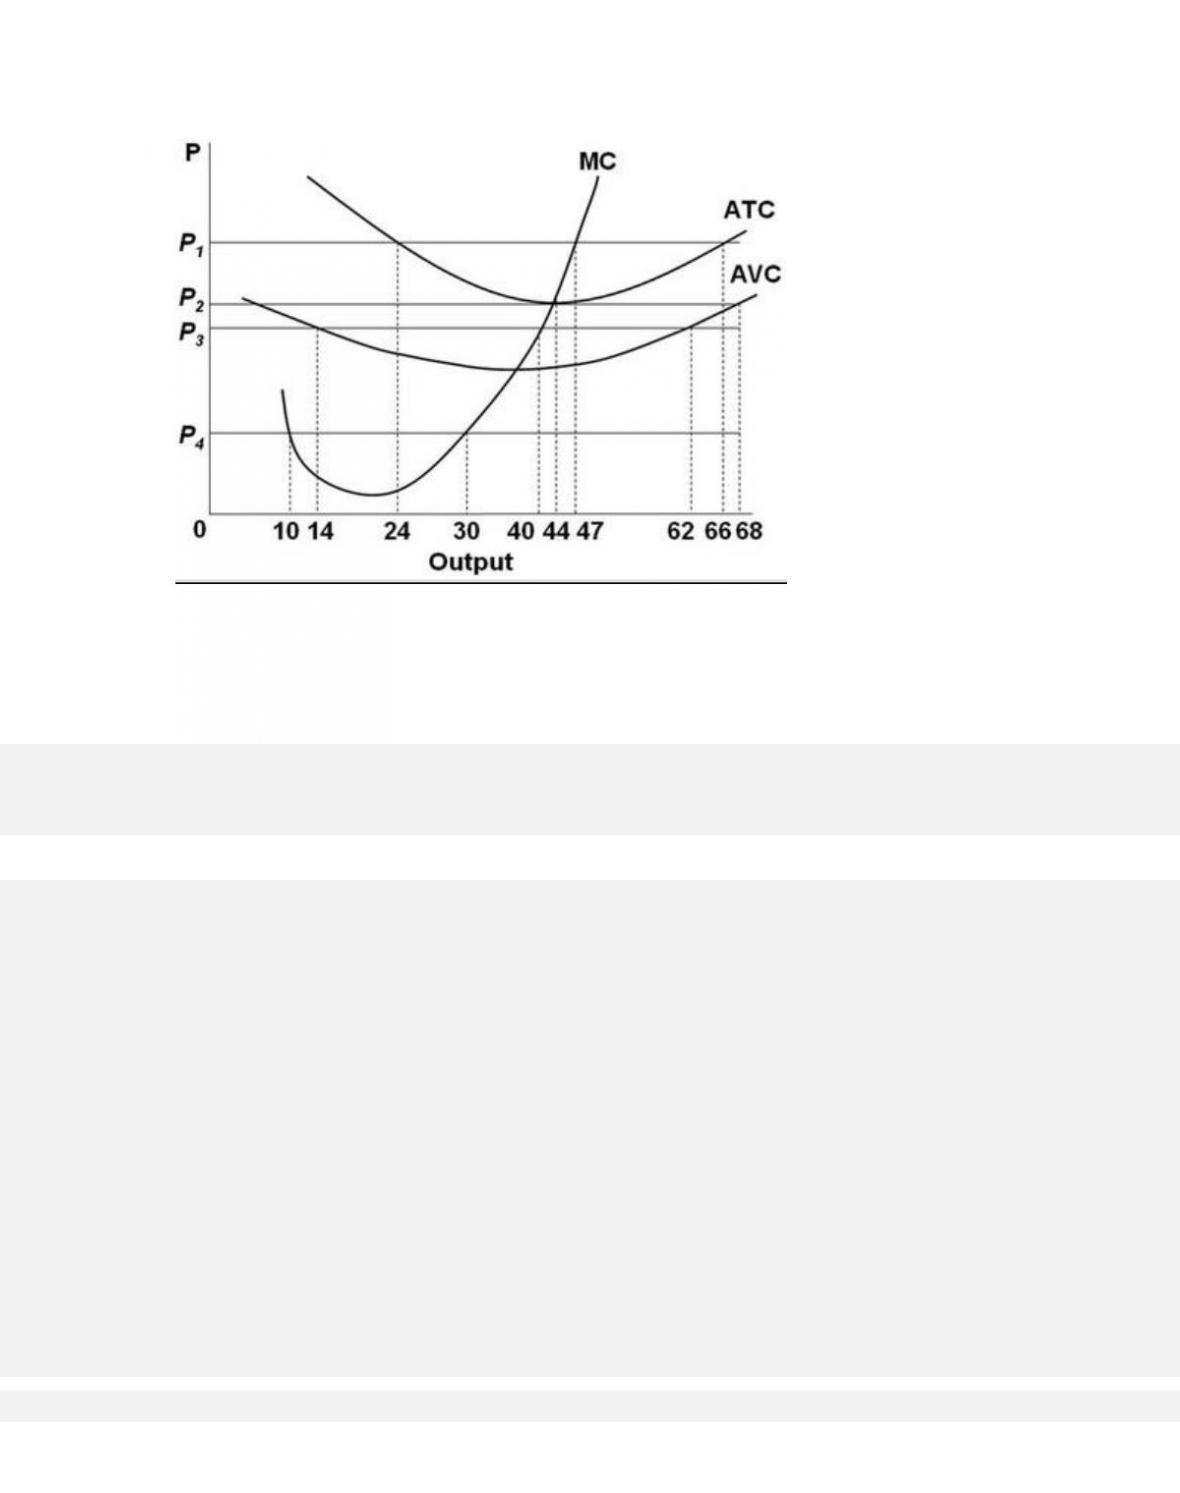
96.
At P4 in the accompanying diagram, this firm will
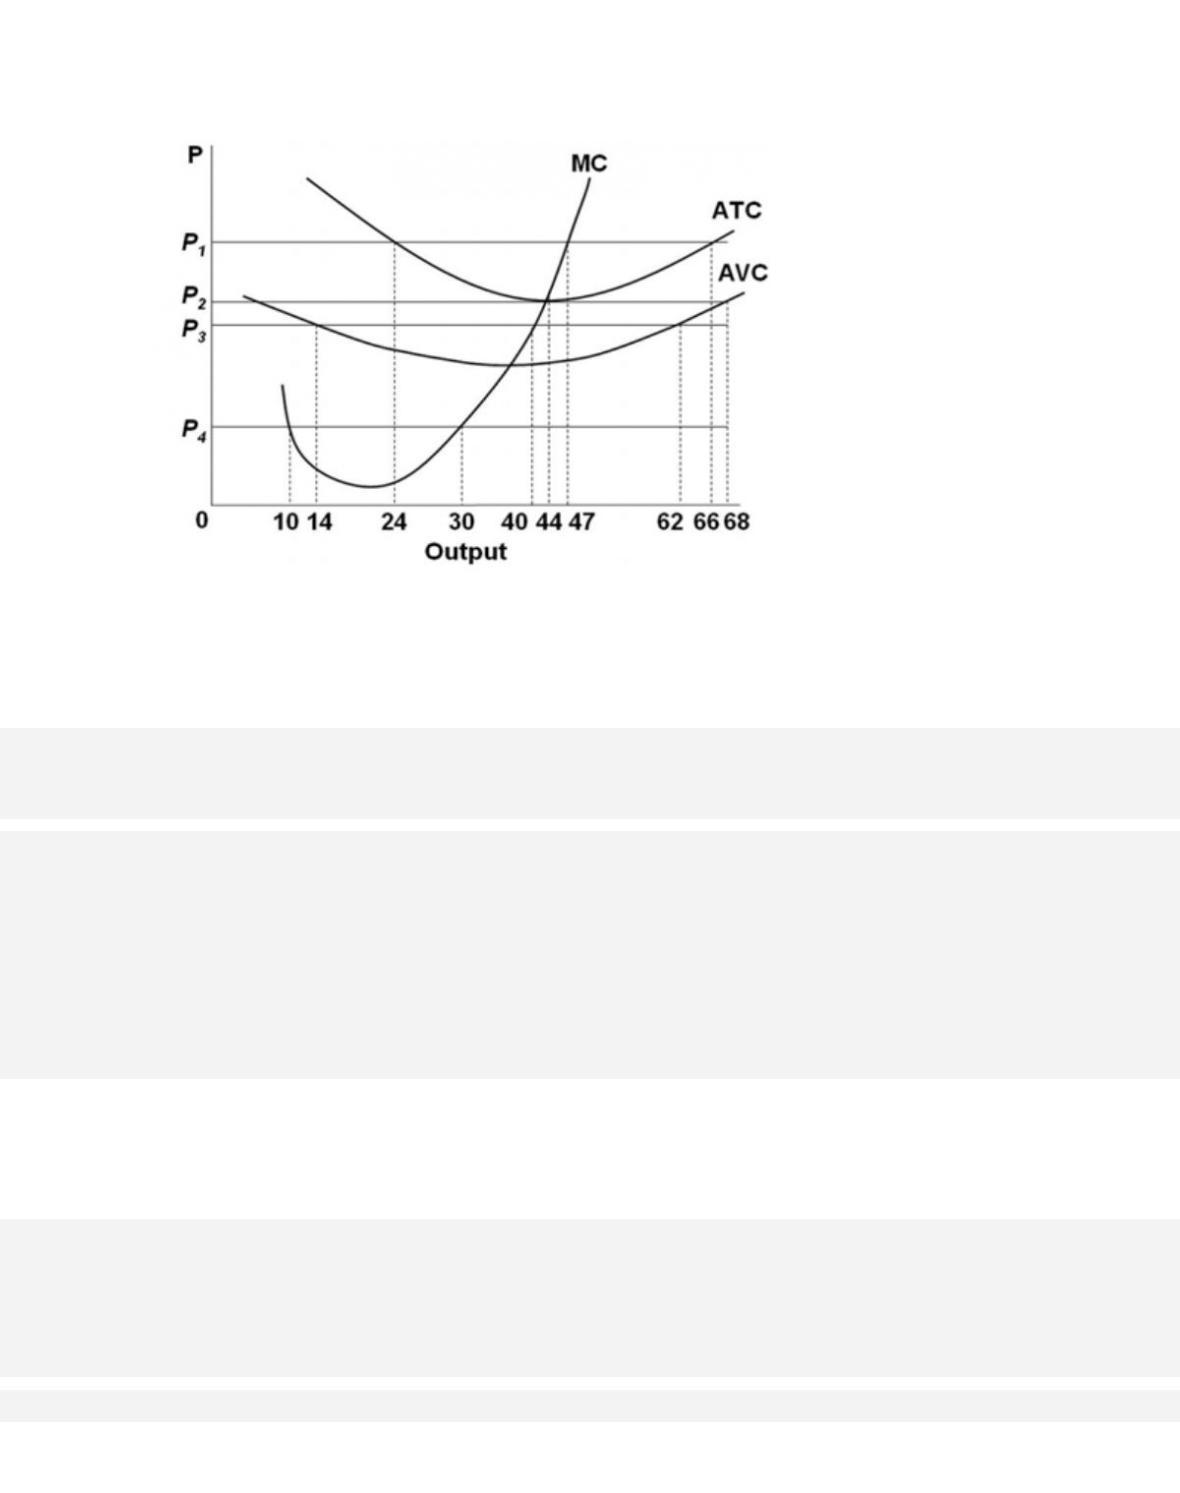
97.
At P3 in the accompanying diagram, this firm will
98.
The Ajax Manufacturing Company is selling in a purely competitive market. Its output is
100 units, which sell at $4 each. At this level of output, total
cost is $600, total fixed cost is
$100, and marginal cost is $4. The firm should
10–57
Copyright © 2018 McGraw-Hill Education. All rights reserved. No reproduction or distribution without the prior
written consent of McGraw-Hill Education.
AACSB: Knowledge Application
A c c e s s i b i l i t y :
Keyboard Navigation
Blooms: Understand
D i f f i c u l t y :
02 Medium
Learning Objective: 10–05 Explain how purely competitive firms can use the marginal-revenue–
marginal-cost approach to maximize profits or minimize losses in the short run.
Test Bank: I
T o p i c :
Profit Maximization in the Short Run: Marginal-Revenue–Marginal-Cost Approach
99.
If a purely competitive firm is maximizing economic profit,
100.
Output
Total Cost
0
$50
1
90
2
120
3
140
4
170
5
210
6
260
7
330
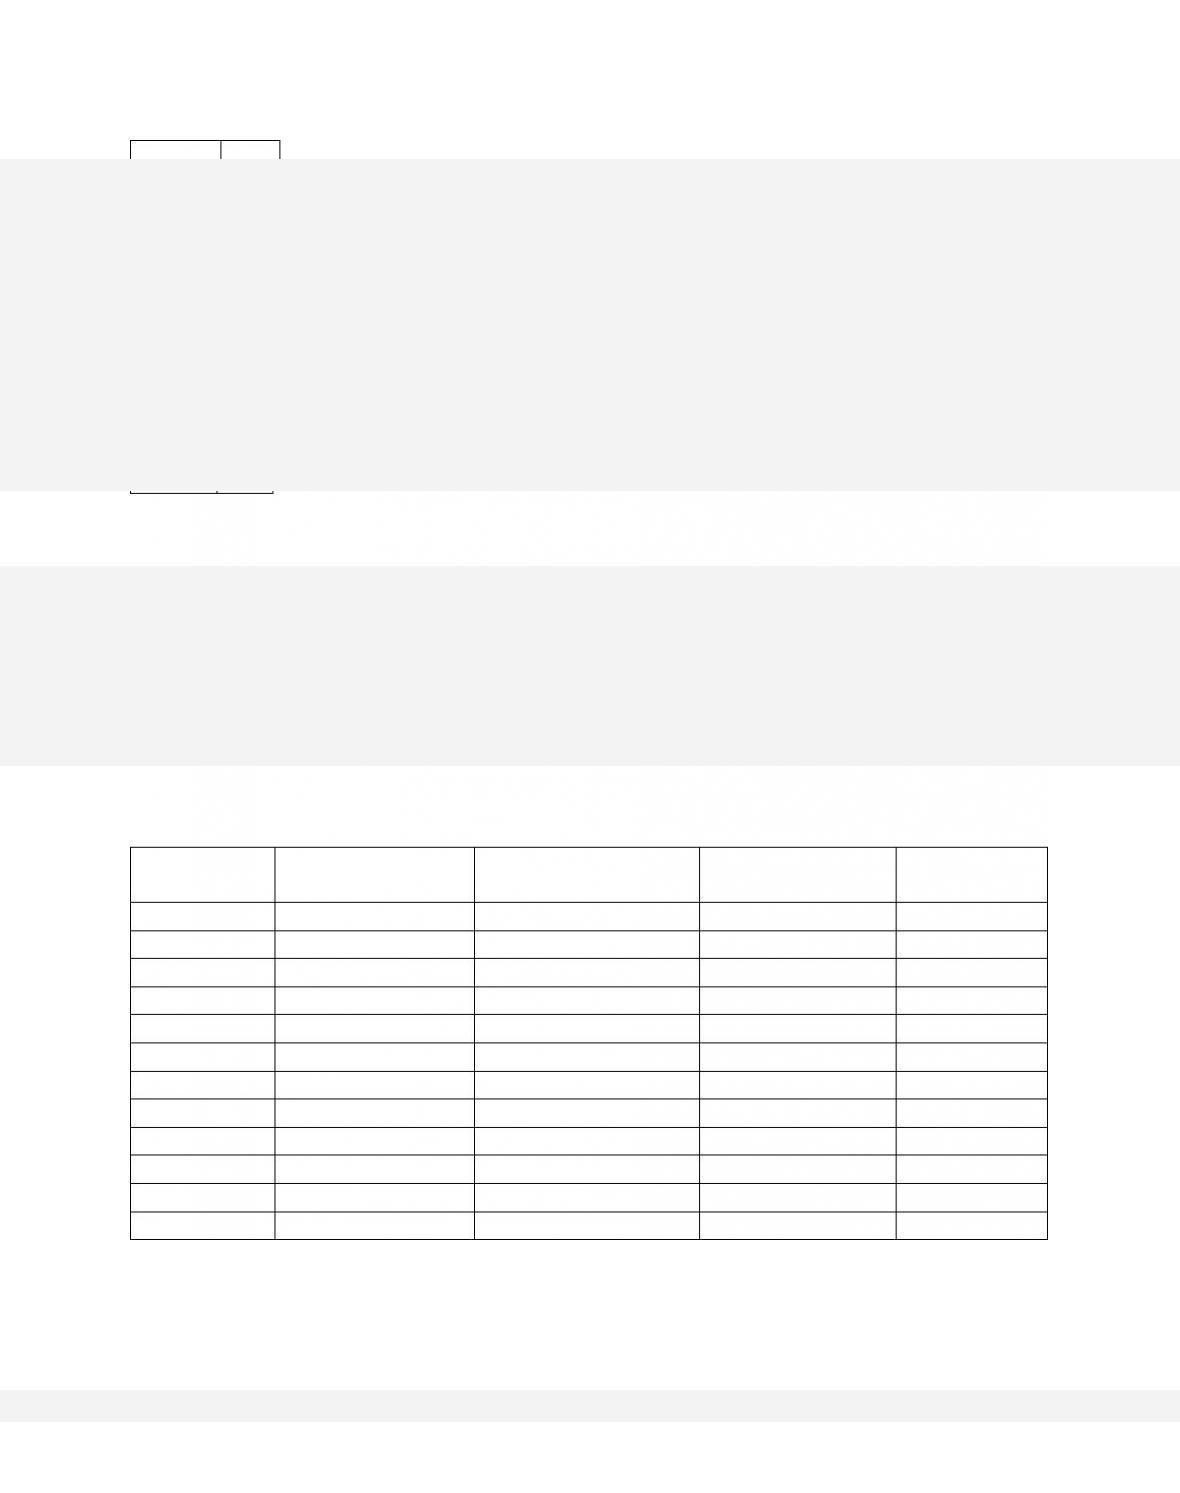
The accompanying table gives cost data for a firm that is selling in a purely competitive
market. If product price is $60, the firm will
10–58
Copyright © 2018 McGraw-Hill Education. All rights reserved. No reproduction or distribution without the prior
written consent of McGraw-Hill Education.
B.
produce 4 units and realize a $120 economic profit.
C. produce 6 units and realize a $100 economic profit.
D. produce 3 units and incur a $40 loss.
101.
Output
Total Cost
0
$50
1
90
2
120
3
140
4
170
5
210
6
260
7
330
The accompanying table gives cost data for a firm that is selling in a purely competitive
market. If product price is $45, the firm will
102.
Output
Total Cost
0
$50
1
90
2
120
3
140
4
170
5
210
6
260
7
330
The accompanying table gives cost data for a firm that is selling in a purely competitive
market. If product price is $25, the firm will
103. Assume a purely competitive firm is selling 200 units of output at $3 each. At this output,
its total fixed cost is $100 and its total variable cost is
$350. This firm
10–60
Copyright © 2018 McGraw-Hill Education. All rights reserved. No reproduction or distribution without the prior
written consent of McGraw-Hill Education.
Blooms: Understand
D i f f i c u l t y :
02 Medium
Learning Objective: 10–05 Explain how purely competitive firms can use the marginal-revenue–
marginal-cost approach to maximize profits or minimize losses in the short run.
Test Bank: I
T o p i c :
Profit Maximization in the Short Run: Marginal-Revenue–Marginal-Cost Approach
104.
Refer to the accompanying diagram. This firm will earn only a normal profit if product price is