Chapter 10 Pure Competition in the Short Run Answer Key
Multiple Choice Questions
1.
Economists would describe the U.S. automobile industry as
2.
In which of the following market structures is there clear-cut mutual interdependence with
respect to price-output policies?
3.
Which of the following industries most closely approximates pure competition?
10-2
Copyright © 2018 McGraw-Hill Education. All rights reserved. No reproduction or distribution without the prior
written consent of McGraw-Hill Education.
A c c e s s i b i l i t y :
Keyboard Navigation
Blooms: Understand
D i f f i c u lt y :
02 Medium
Learning Objective: 10–01 Give the names and summarize the main characteristics of the four
basic market models.
Test Bank: I
T o p i c :
Four Market Models
4.
Economists use the term imperfect competition to describe
5.
In which of the following industry structures is the entry of new firms the most difficult?
6.
An industry comprising 40 firms, none of which has more than 3 percent of the total market
for a differentiated product, is an example of
10-3
Copyright © 2018 McGraw-Hill Education. All rights reserved. No reproduction or distribution without the prior
written consent of McGraw-Hill Education.
B.
oligopoly.
C.
pure monopoly.
D.
pure competition.
AACSB: Knowledge Application
A c c e s s i b i l i t y :
Keyboard Navigation
Blooms: Understand
D i f f i c u lt y :
02 Medium
Learning Objective: 10–01 Give the names and summarize the main characteristics of the four
basic market models.
Test Bank: I
T o p i c :
Four Market Models
7.
An industry comprising four firms, each with about 25 percent of the total market for a
product, is an example of
8.
An industry comprising a very large number of sellers producing a standardized product is
known as
Test Bank: I
T o p i c :
Four Market Models
9.
An industry comprising a small number of firms, each of which considers the potential
reactions of its rivals in making price-output decisions, is
called
10.
Which of the following statements applies to a purely competitive producer?
11.
A purely competitive seller is
10-5
Copyright © 2018 McGraw-Hill Education. All rights reserved. No reproduction or distribution without the prior
written consent of McGraw-Hill Education.
Blooms: Remember
Difficulty:
01 Easy
Learning Objective: 10–02 List the conditions required for purely competitive markets.
Test Bank: I
T o p i c :
Pure Competition: Characteristics and Occurrence
12.
Which of the following is not a characteristic of pure competition?
13.
Which of the following is not a basic characteristic of pure competition?
14.
The demand schedule or curve confronted by the individual, purely competitive firm is
10-6
Copyright © 2018 McGraw-Hill Education. All rights reserved. No reproduction or distribution without the prior
written consent of McGraw-Hill Education.
A c c e s s i b i l i t y :
Keyboard Navigation
Blooms: Understand
D i f f i c u lt y :
02 Medium
Learning Objective: 10–03 Explain how demand is seen by a purely competitive seller.
Test Bank: I
T o p i c :
Demand as Seen by a Purely Competitive Seller
15.
Which of the following is characteristic of a purely competitive seller’s demand curve?
16. In answering the question, assume a graph in which dollars are measured on the vertical
axis and output on the horizontal axis.
For a purely competitive firm, total revenue graphs as a
17. In answering the question, assume a graph in which dollars are measured on the vertical
axis and output on the horizontal axis.
For a purely competitive firm, marginal revenue graphs
as a
10-7
Copyright © 2018 McGraw-Hill Education. All rights reserved. No reproduction or distribution without the prior
written consent of McGraw-Hill Education.
A.
straight, upsloping line.
B.
straight line, parallel to the vertical axis.
C. straight line, parallel to the horizontal axis.
D. straight, downsloping line.
AACSB: Knowledge Application
A c c e s s i b i l i t y :
Keyboard Navigation
Blooms: Understand
D i f f i c u lt y :
02 Medium
Learning Objective: 10–03 Explain how demand is seen by a purely competitive seller.
Test Bank: I
T o p i c :
Demand as Seen by a Purely Competitive Seller
18. In answering the question, assume a graph in which dollars are measured on the vertical
axis and output on the horizontal axis.
For a purely competitive firm,
19.
If a firm in a purely competitive industry is confronted with an equilibrium price of $5, its
marginal revenue
10-8
Copyright © 2018 McGraw-Hill Education. All rights reserved. No reproduction or distribution without the prior
written consent of McGraw-Hill Education.
T o p i c :
Demand as Seen by a Purely Competitive Seller
20.
Price is constant to the individual firm selling in a purely competitive market because
21.
For a purely competitive seller, price equals
22.
For a purely competitive firm, total revenue
10-9
Copyright © 2018 McGraw-Hill Education. All rights reserved. No reproduction or distribution without the prior
written consent of McGraw-Hill Education.
Test Bank: I
T o p i c :
Demand as Seen by a Purely Competitive Seller
23.
The marginal revenue curve of a purely competitive firm
24.
The demand curve in a purely competitive industry is , while the demand curve to a single
firm in that industry is .
25.
A perfectly elastic demand curve implies that the firm
10–10
Copyright © 2018 McGraw-Hill Education. All rights reserved. No reproduction or distribution without the prior
written consent of McGraw-Hill Education.
D i f f i c u lt y :
02 Medium
Learning Objective: 10–03 Explain how demand is seen by a purely competitive seller.
Test Bank: I
T o p i c :
Demand as Seen by a Purely Competitive Seller
26.
The fact that a purely competitive firm‘s total revenue curve is linear and upsloping to the
right implies that
27.
Which of the following statements is correct?
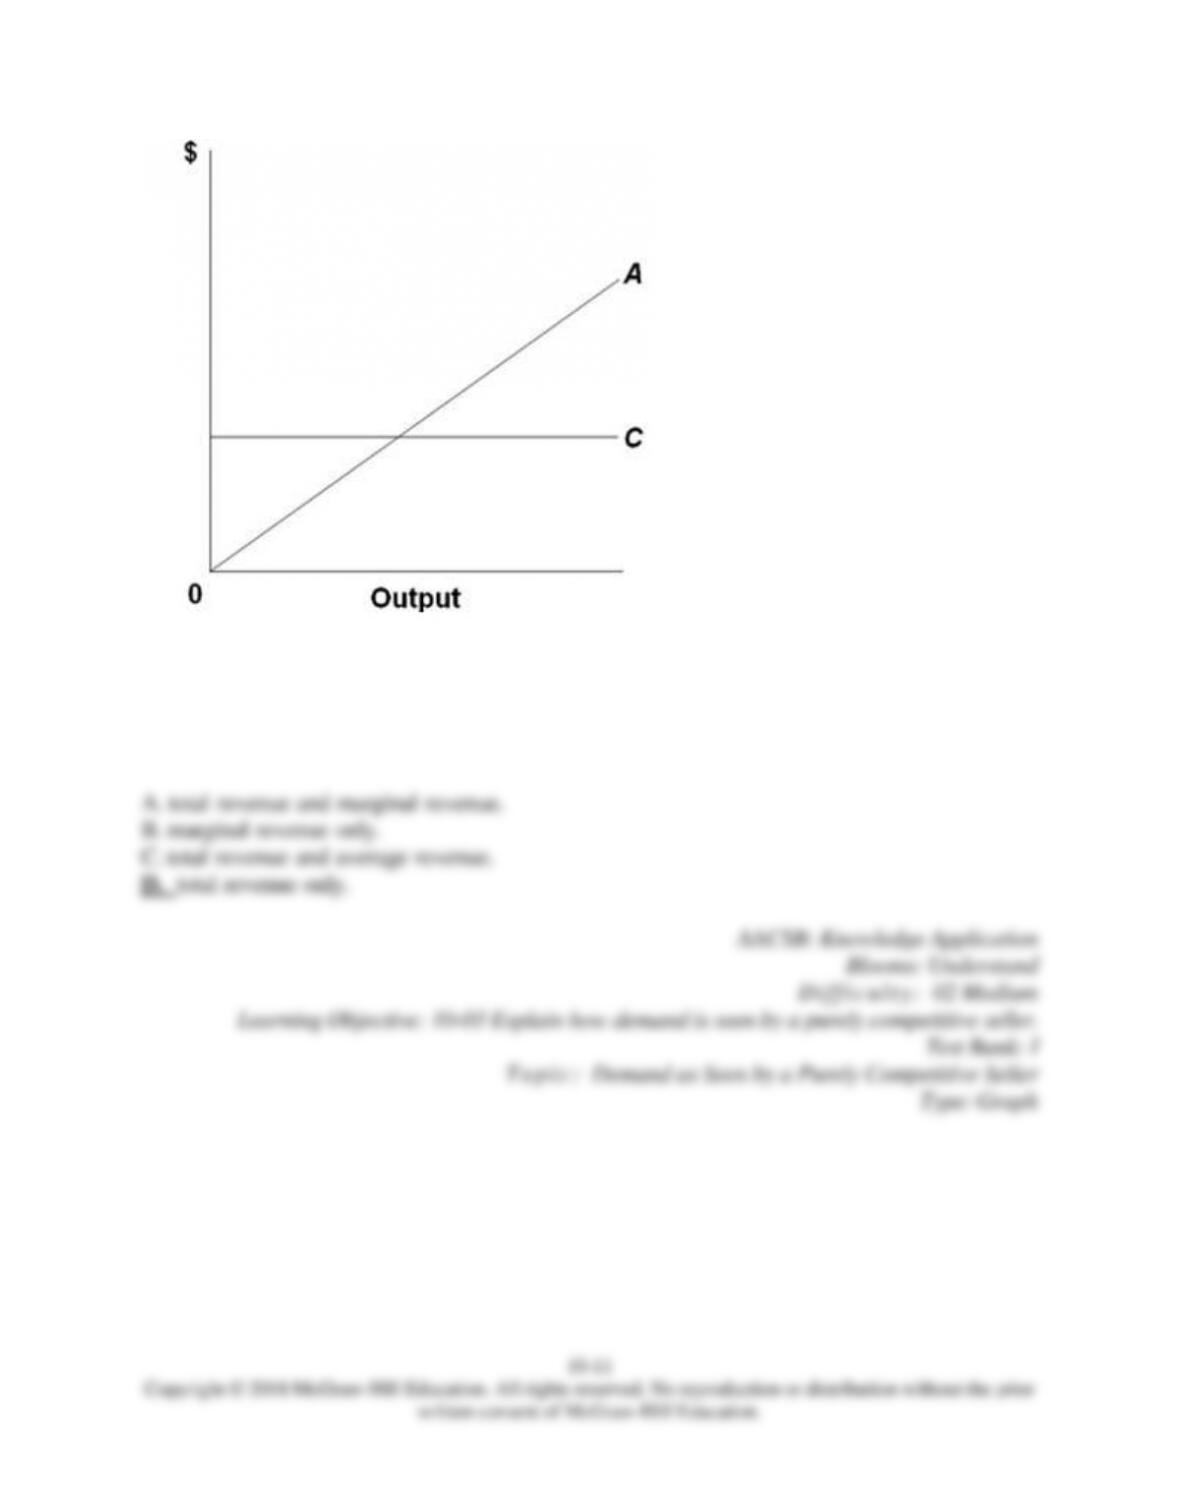
28.
Refer to the diagram, which pertains to a purely competitive firm. Curve A represents
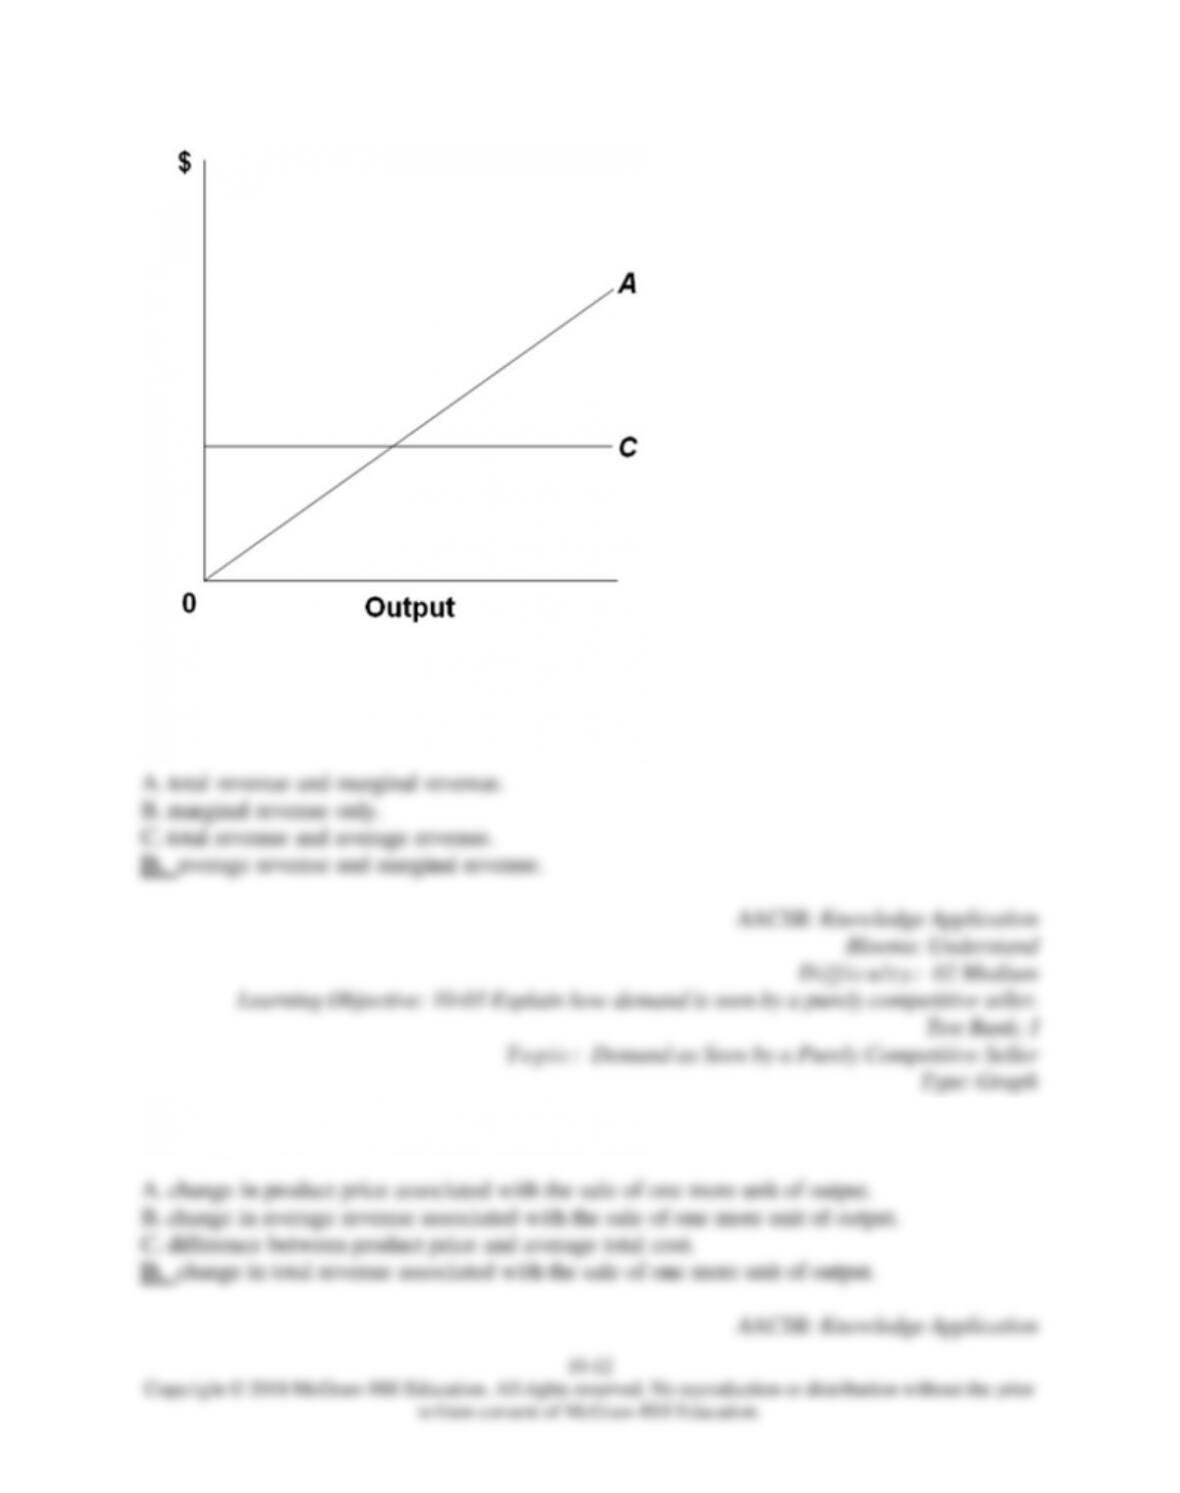
29.
Refer to the diagram, which pertains to a purely competitive firm. Curve C represents
30.
Marginal revenue is the
10–13
Copyright © 2018 McGraw-Hill Education. All rights reserved. No reproduction or distribution without the prior
written consent of McGraw-Hill Education.
A c c e s s i b i l i t y :
Keyboard Navigation
Blooms: Understand
D i f f i c u lt y :
02 Medium
Learning Objective: 10–03 Explain how demand is seen by a purely competitive seller.
Test Bank: I
T o p i c :
Demand as Seen by a Purely Competitive Seller
31.
Firms seek to maximize
32.
A competitive firm in the short run can determine the profit-maximizing (or loss-
minimizing) output by equating
33.
In the short run, a purely competitive firm that seeks to maximize profit will produce
10–14
Copyright © 2018 McGraw-Hill Education. All rights reserved. No reproduction or distribution without the prior
written consent of McGraw-Hill Education.
C.
that output at which economic profits are zero.
D.
at any point where the total revenue and total cost curves intersect.
AACSB: Knowledge Application
A c c e s s i b i l i t y :
Keyboard Navigation
Blooms: Understand
D i f f i c u lt y :
02 Medium
Learning Objective: 10–04 Convey how purely competitive firms can use the total-revenue–
total-cost approach to maximize profits or minimize losses in the short run.
Test Bank: I
T o p i c :
Profit Maximization in the Short Run: Total-Revenue–Total-Cost Approach
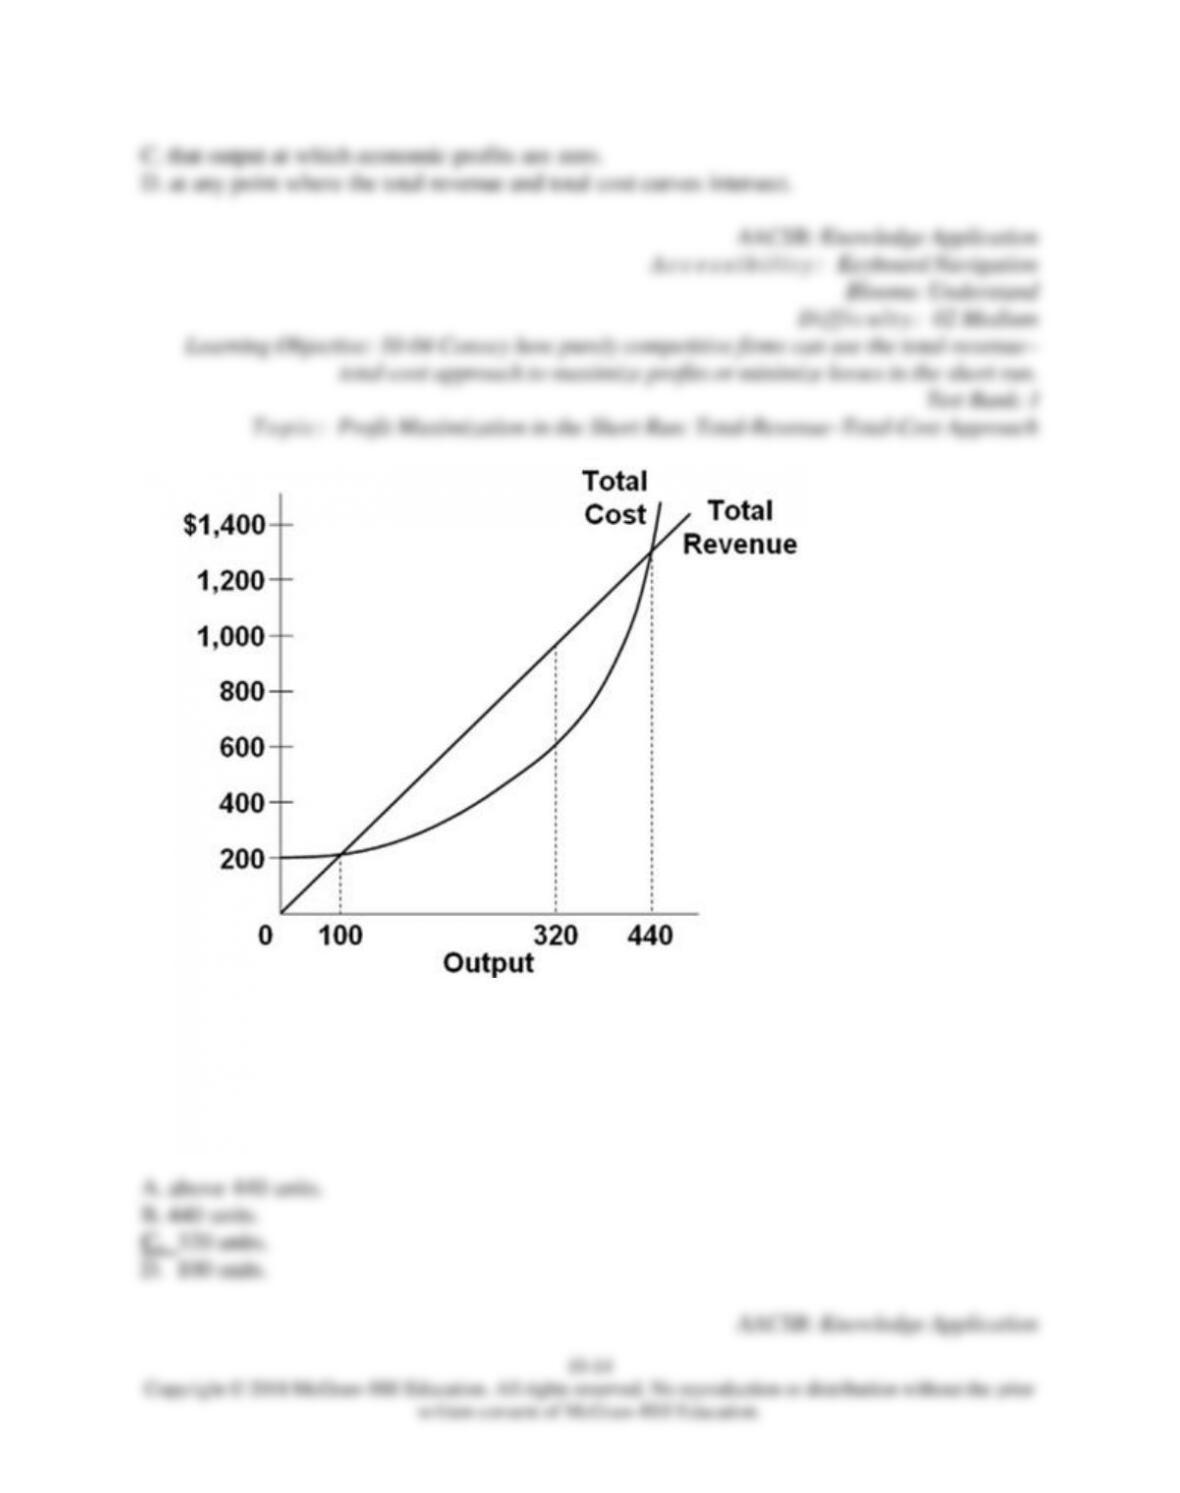
34.
Refer to the short-run data in the accompanying graph. The profit-maximizing output for this
firm is
10–15
Copyright © 2018 McGraw-Hill Education. All rights reserved. No reproduction or distribution without the prior
written consent of McGraw-Hill Education.
Blooms: Understand
D i f f i c u lt y :
02 Medium
Learning Objective: 10–04 Convey how purely competitive firms can use the total-revenue–
total-cost approach to maximize profits or minimize losses in the short run.
Test Bank: I
T o p i c :
Profit Maximization in the Short Run: Total-Revenue–Total-Cost Approach
Type: Graph
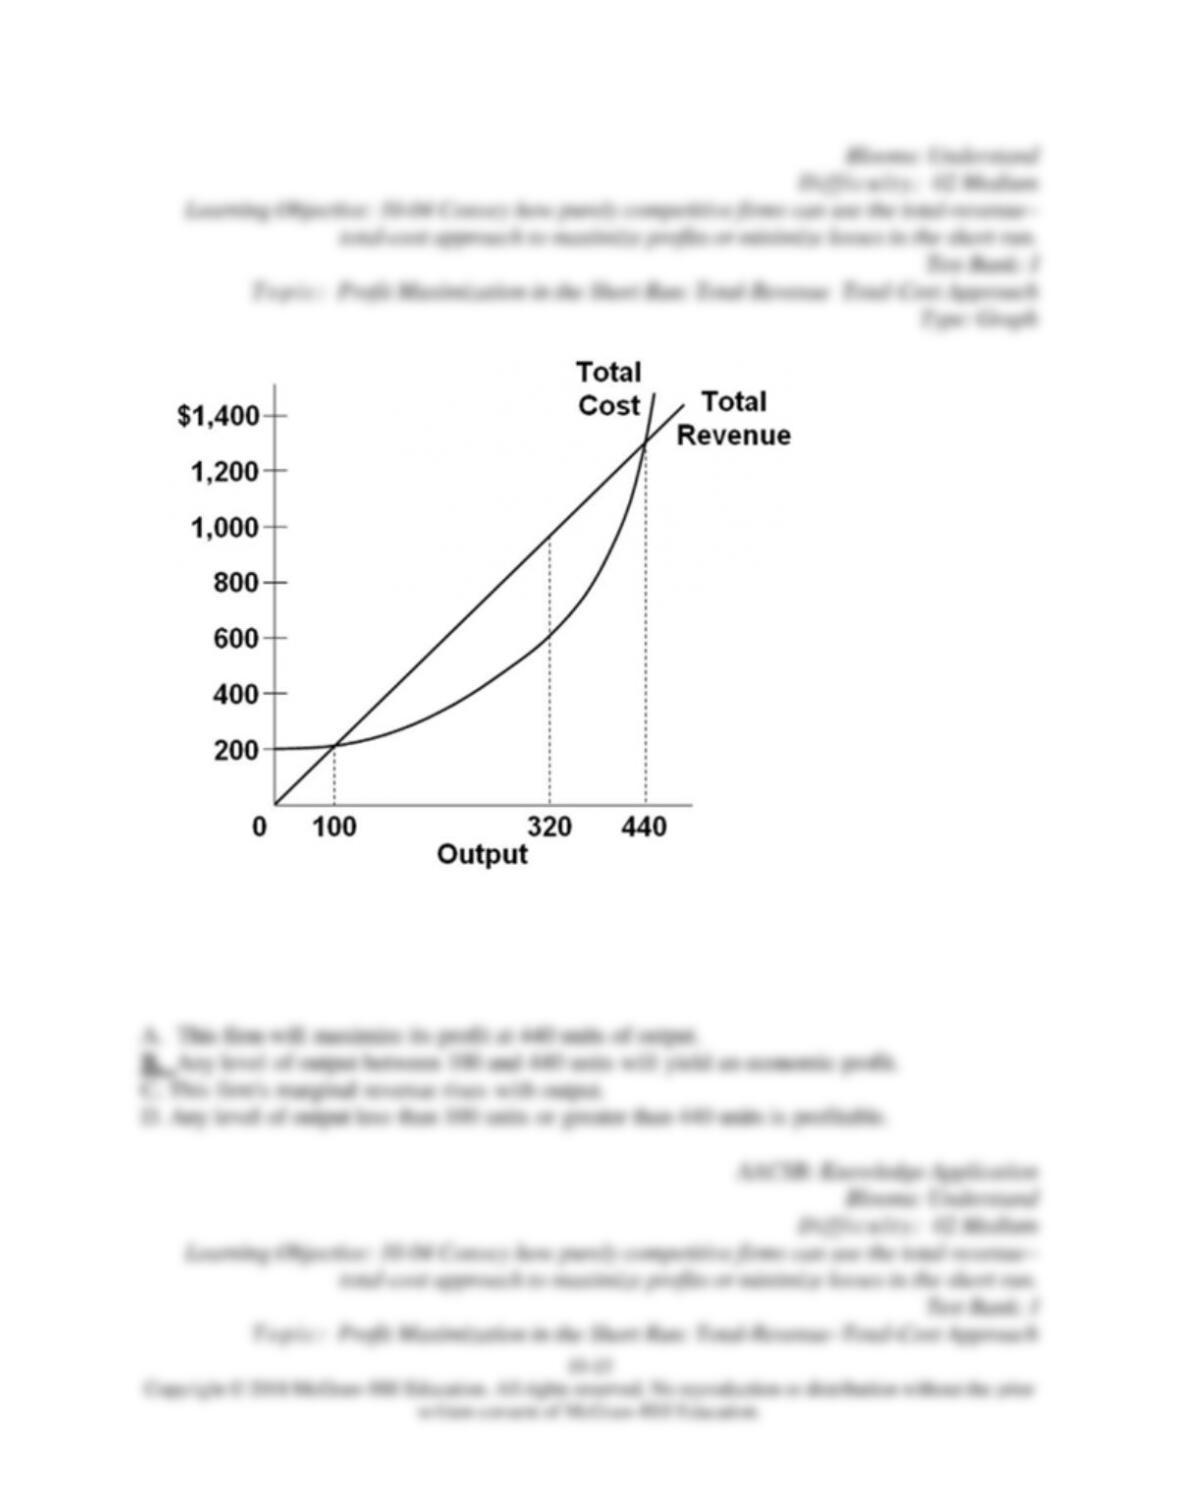
35.
Refer to the short-run data in the accompanying graph. Which of the following is correct?
Type: Graph
36. A competitive firm will maximize profits at that output at which
37.
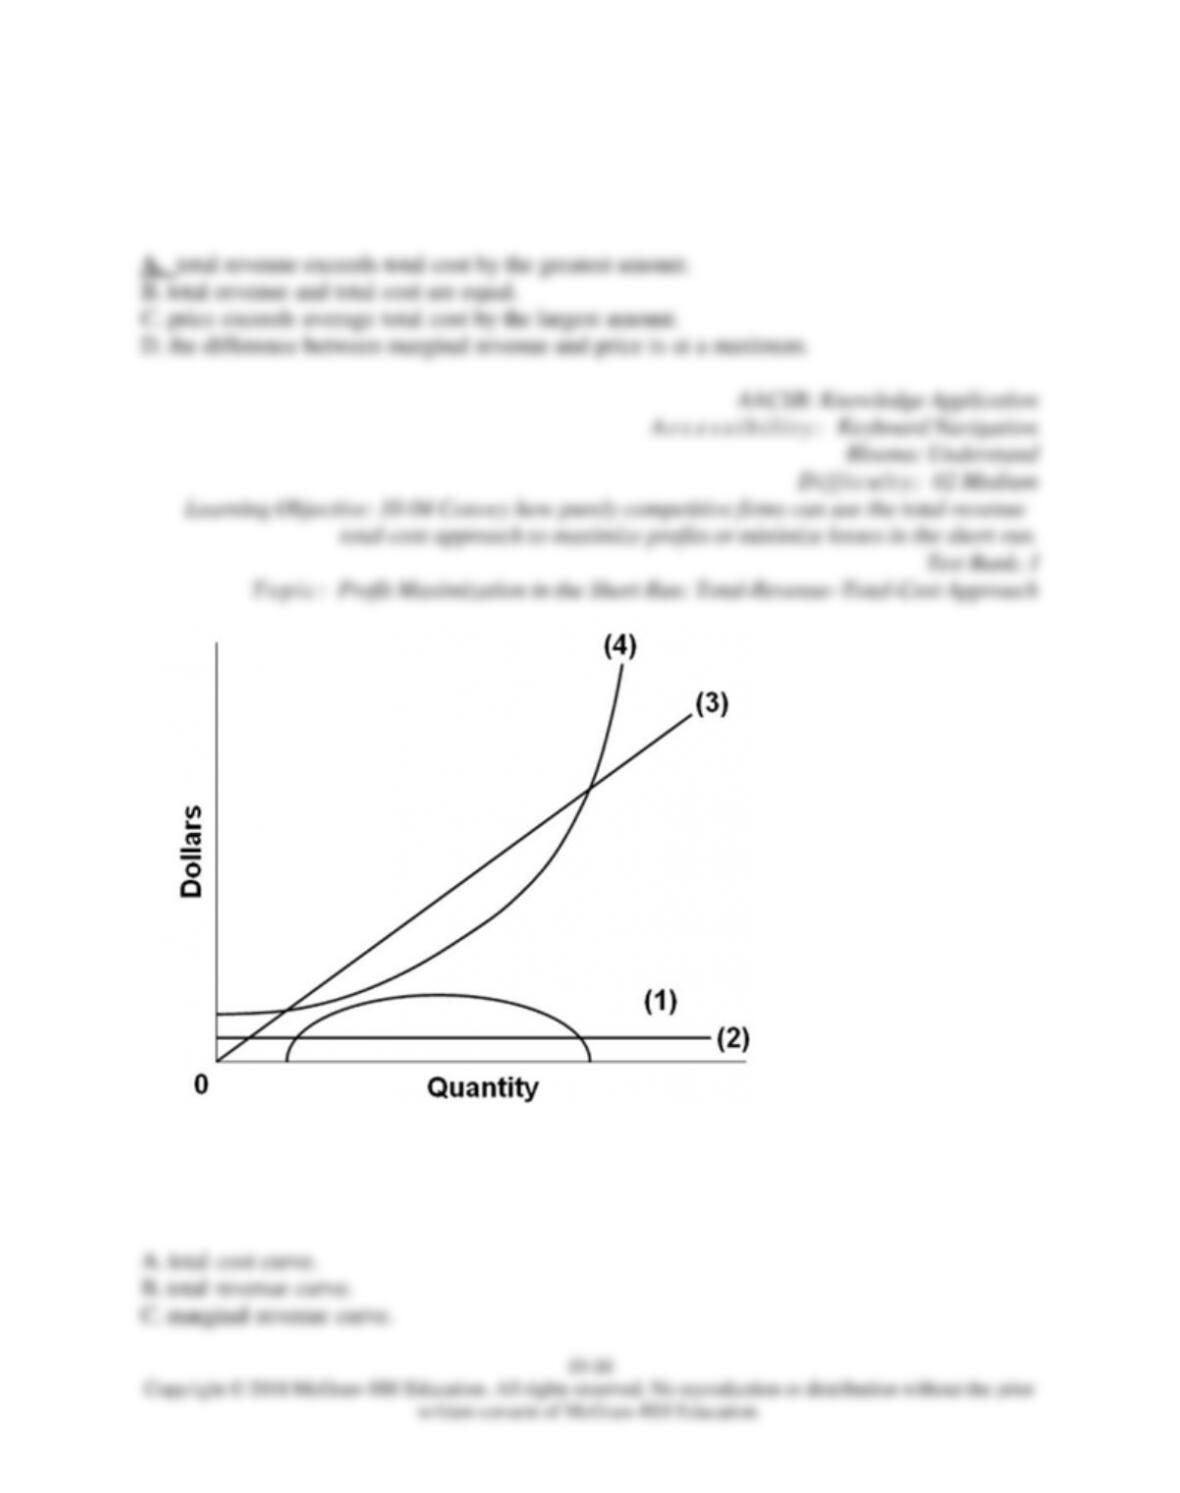
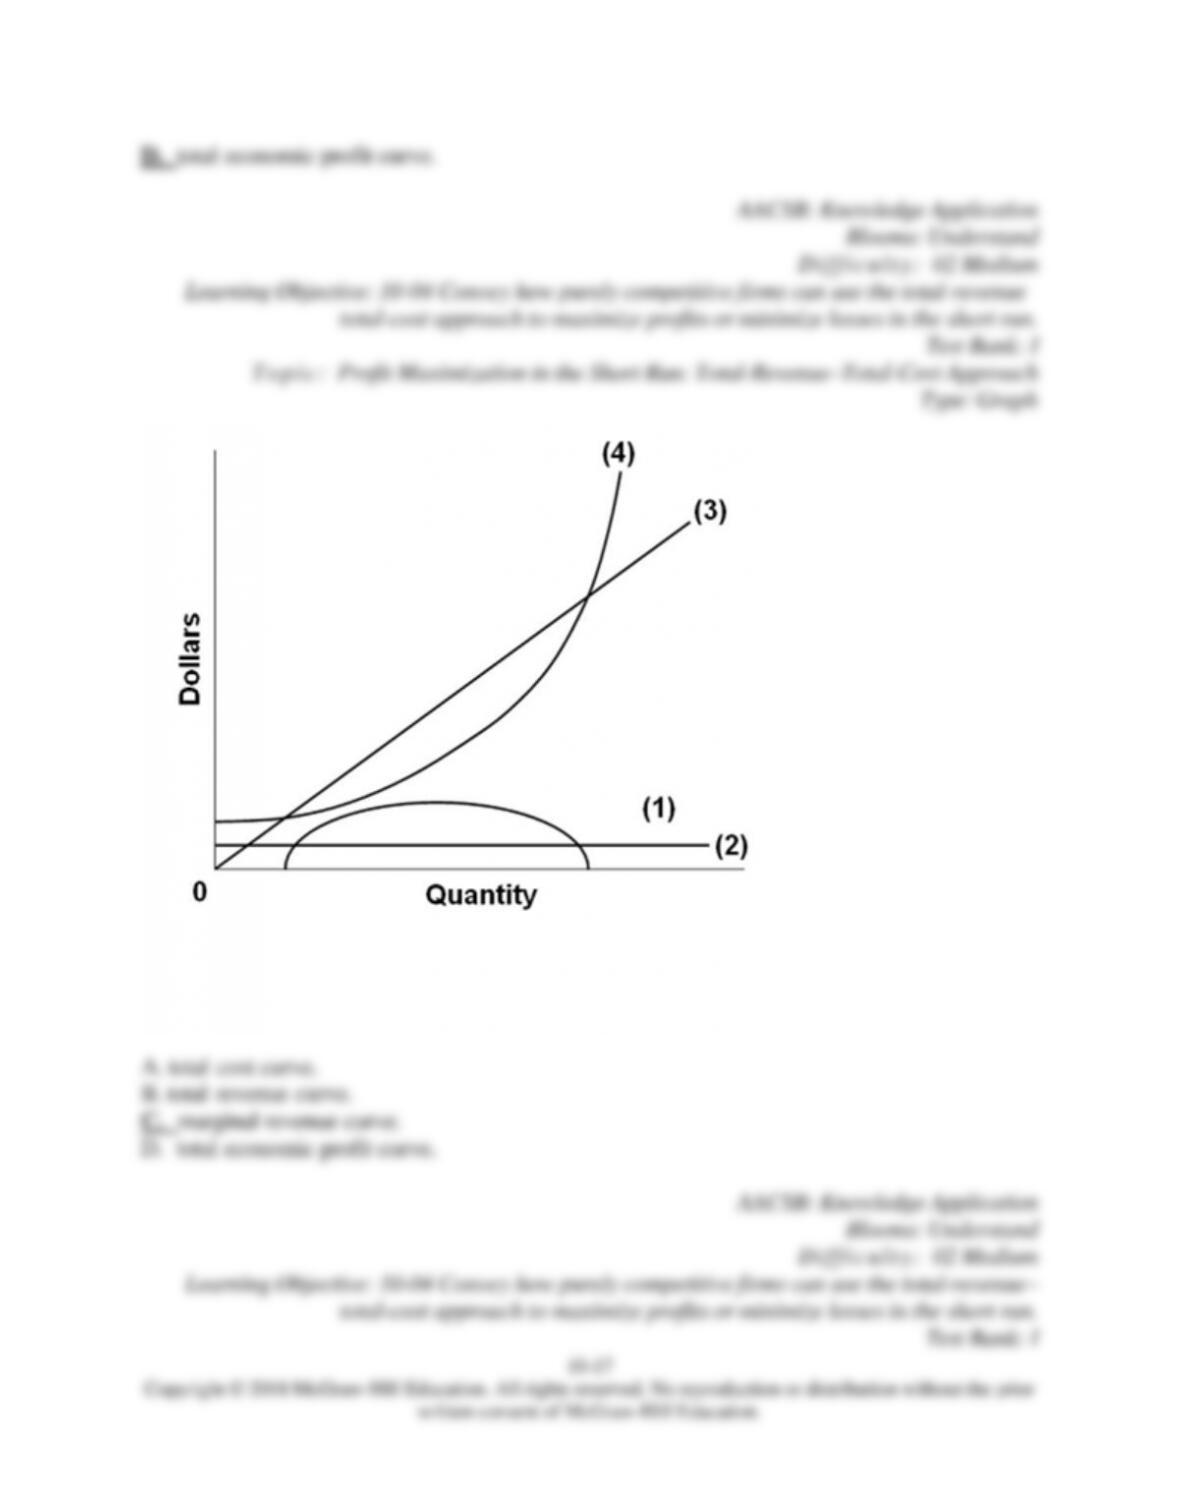
Curve (1) in the diagram is a purely competitive firm’s
10–17
Copyright © 2018 McGraw-Hill Education. All rights reserved. No reproduction or distribution without the prior
written consent of McGraw-Hill Education.
D. total economic profit curve.
AACSB: Knowledge Application
Blooms: Understand
D i f f i c u lt y :
02 Medium
Learning Objective: 10–04 Convey how purely competitive firms can use the total-revenue–
total-cost approach to maximize profits or minimize losses in the short run.
Test Bank: I
T o p i c :
Profit Maximization in the Short Run: Total-Revenue–Total-Cost Approach
Type: Graph
38.
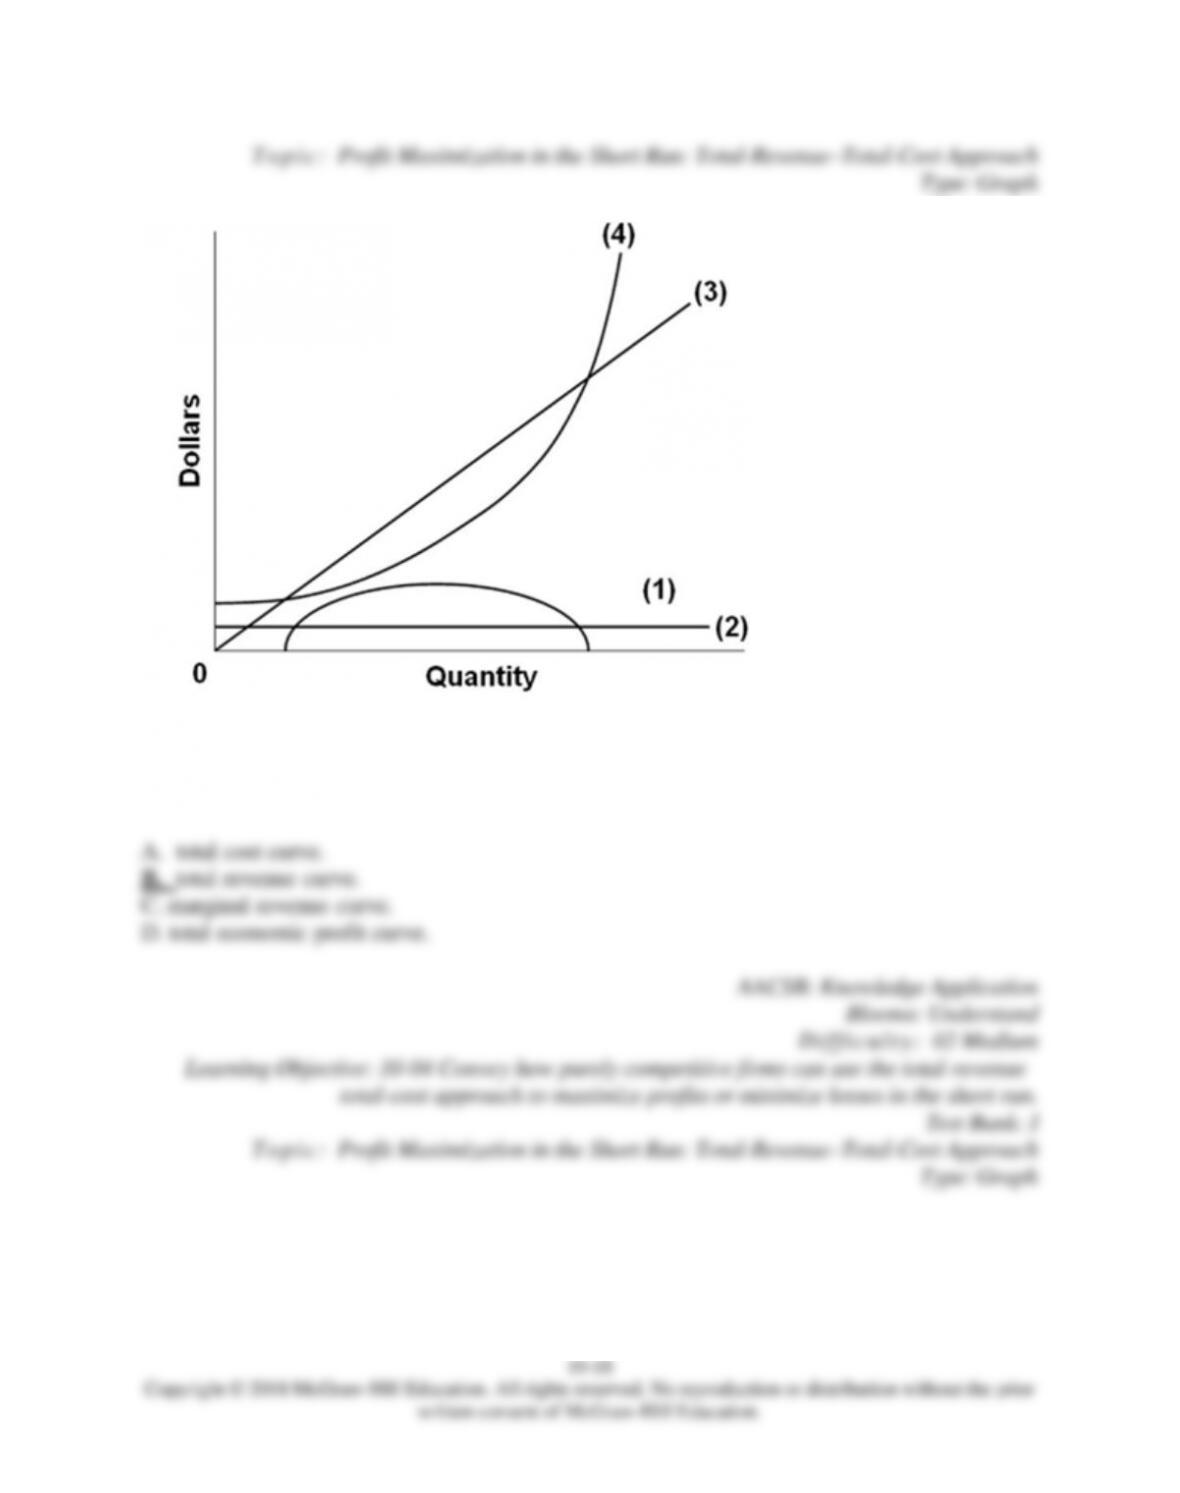
Curve (2) in the diagram is a purely competitive firm’s
10–18
Copyright © 2018 McGraw-Hill Education. All rights reserved. No reproduction or distribution without the prior
written consent of McGraw-Hill Education.
T o p i c :
Profit Maximization in the Short Run: Total-Revenue–Total-Cost Approach
Type: Graph
39.
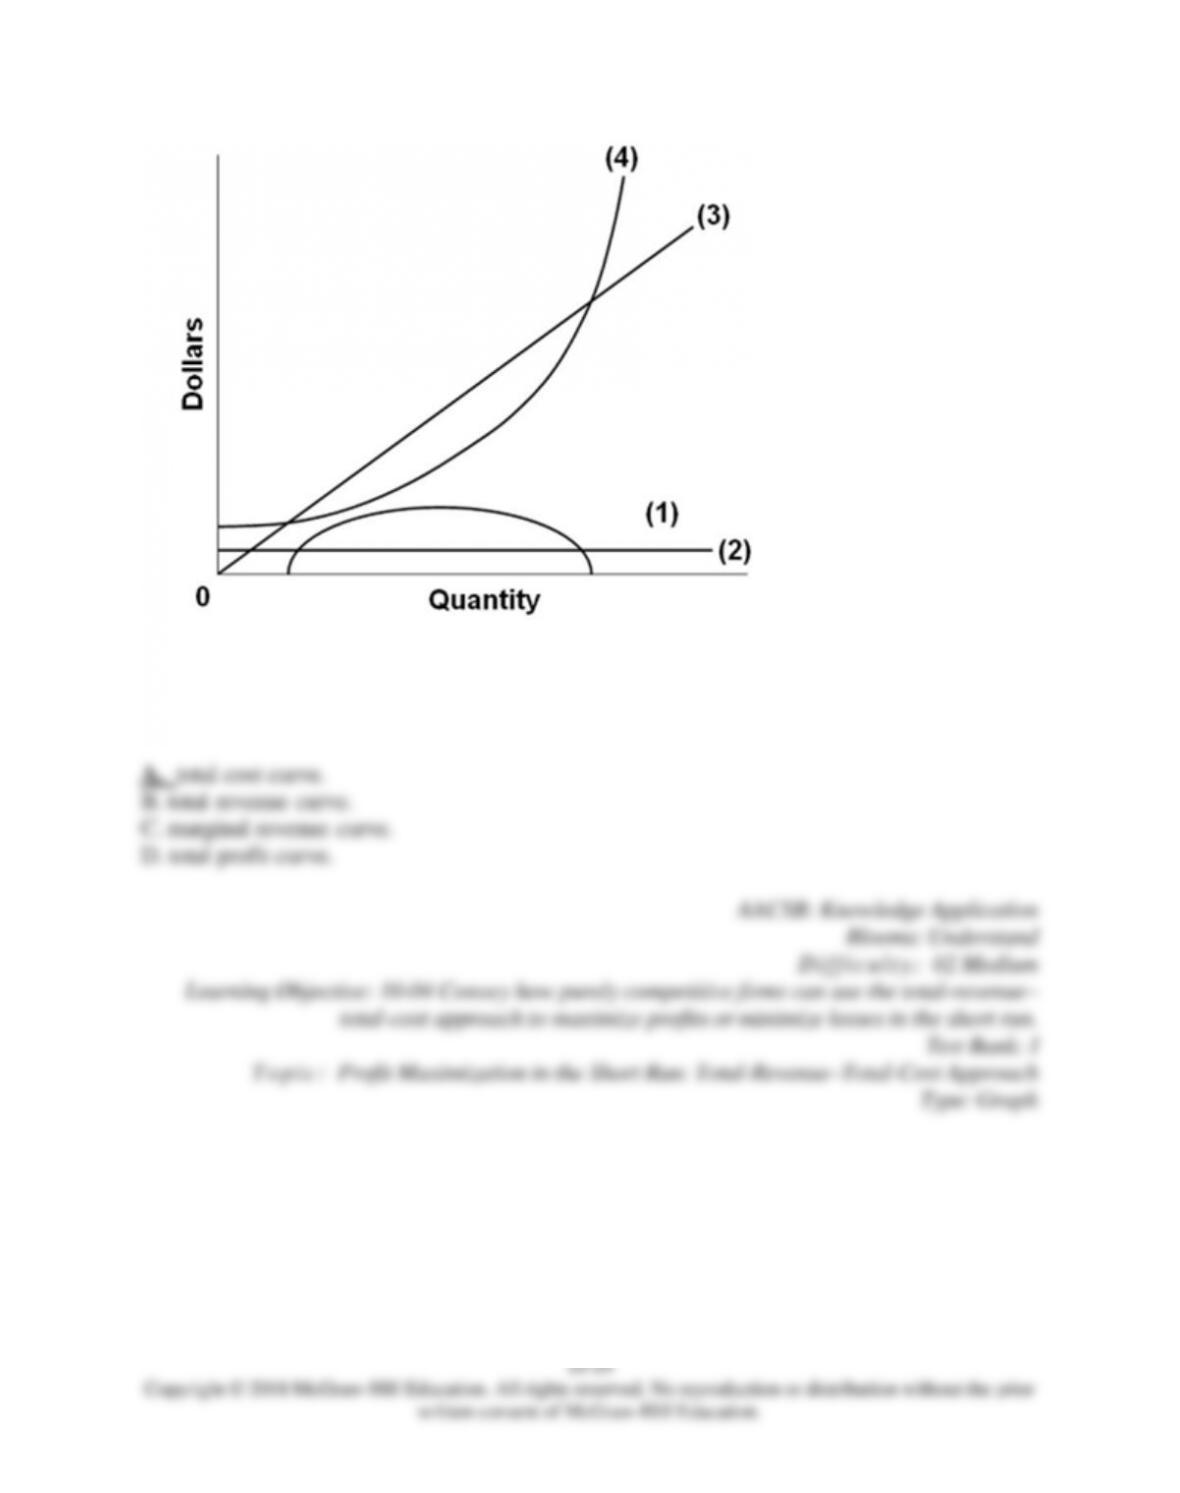
Curve (3) in the diagram is a purely competitive firm’s
40.
Curve (4) in the diagram is a purely competitive firm’s
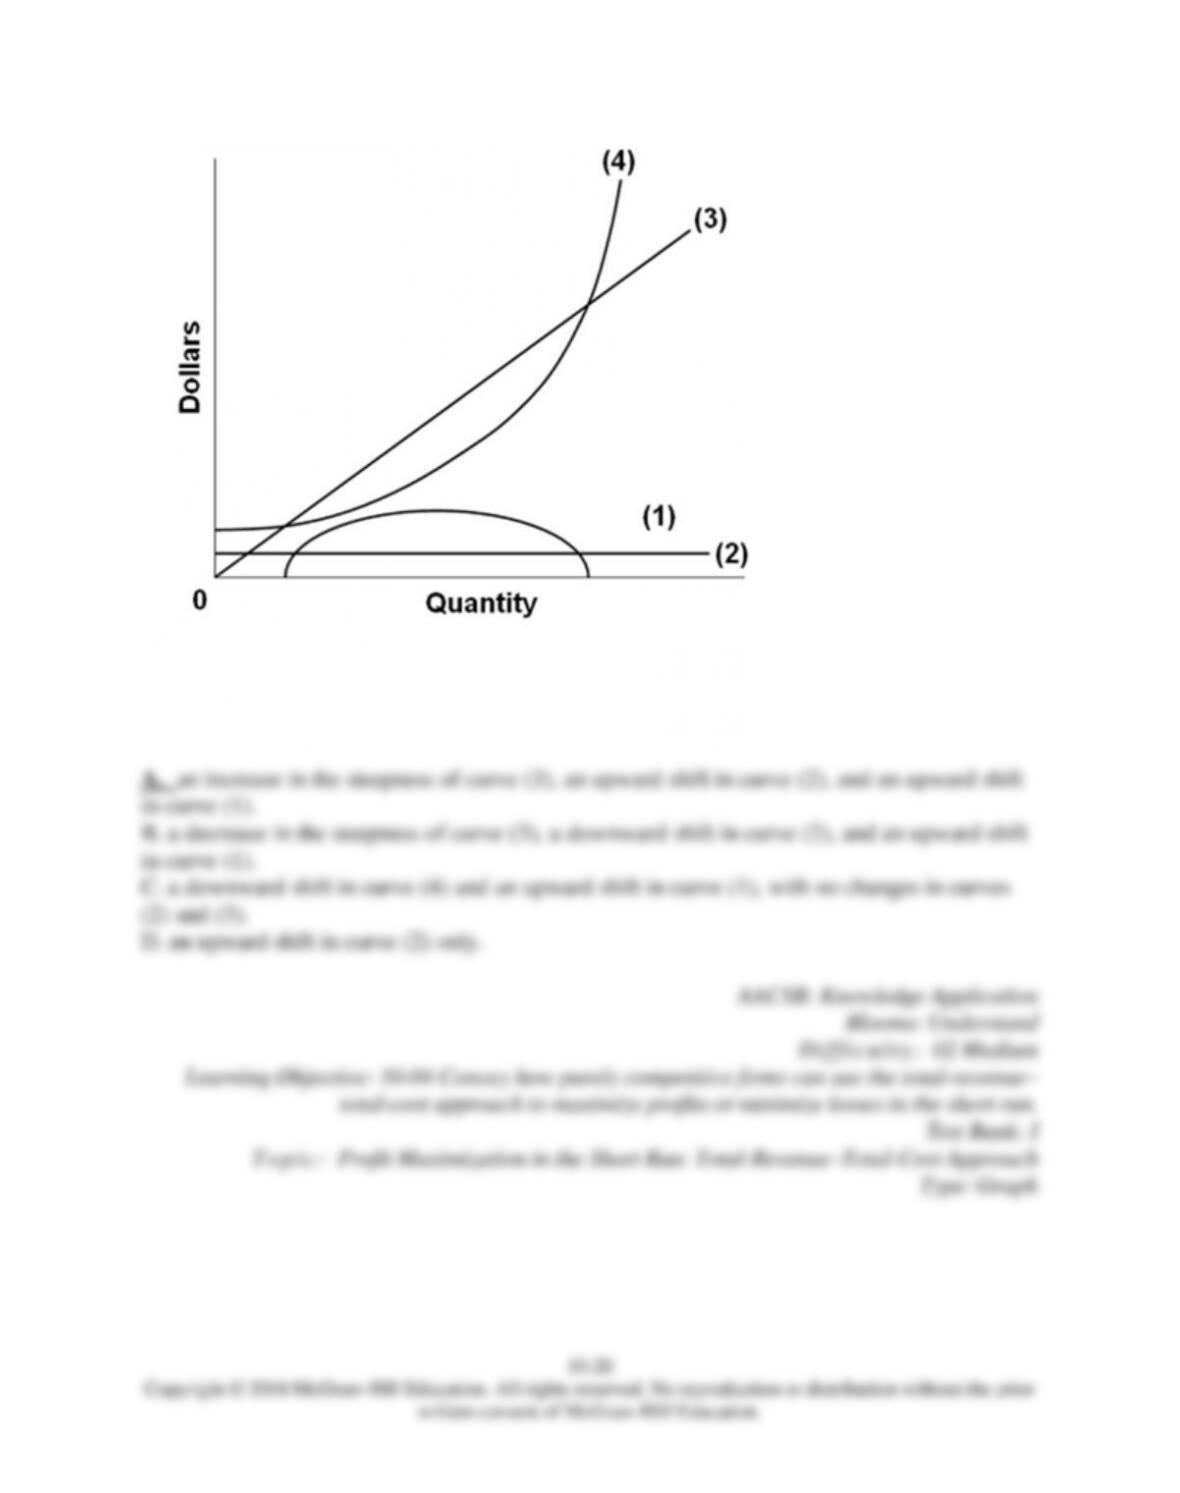
41.
Refer to the diagram. Other things equal, an increase of product price would be shown as