9-141
Copyright © 2018 McGraw-Hill Education. All rights reserved. No reproduction or distribution without the prior
written consent of McGraw-Hill Education.
B. $14.60.
C. $63.
D. $73.
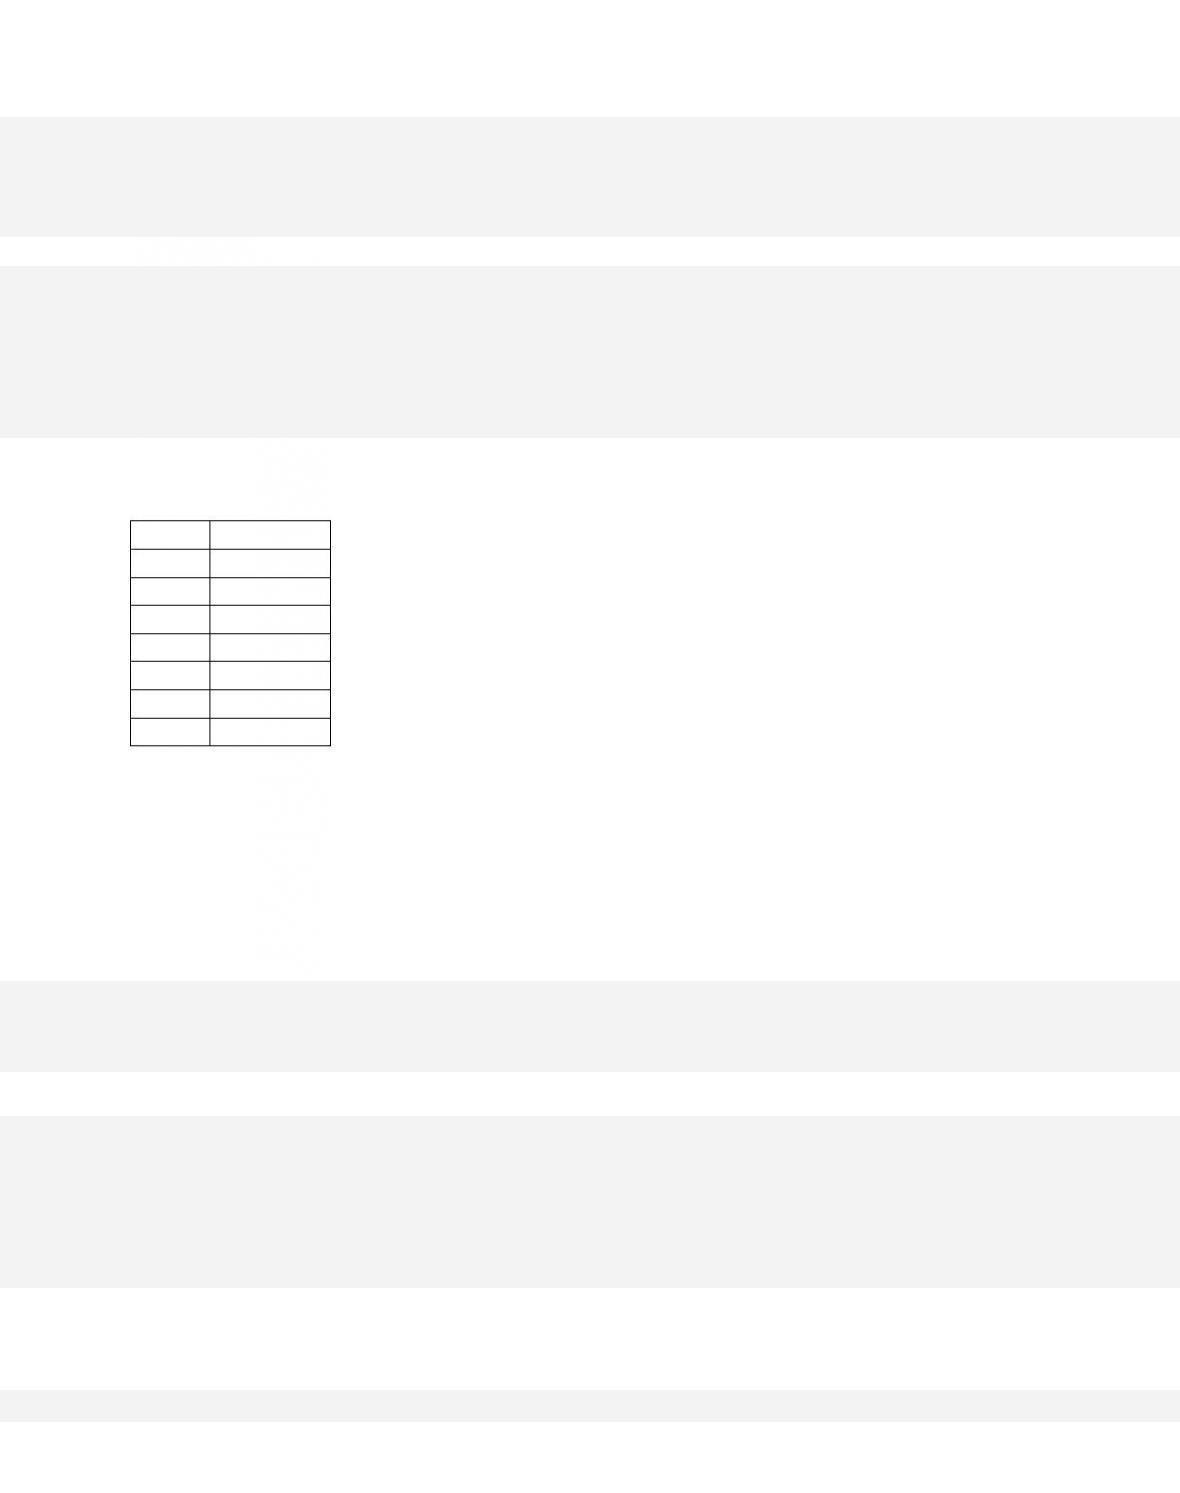
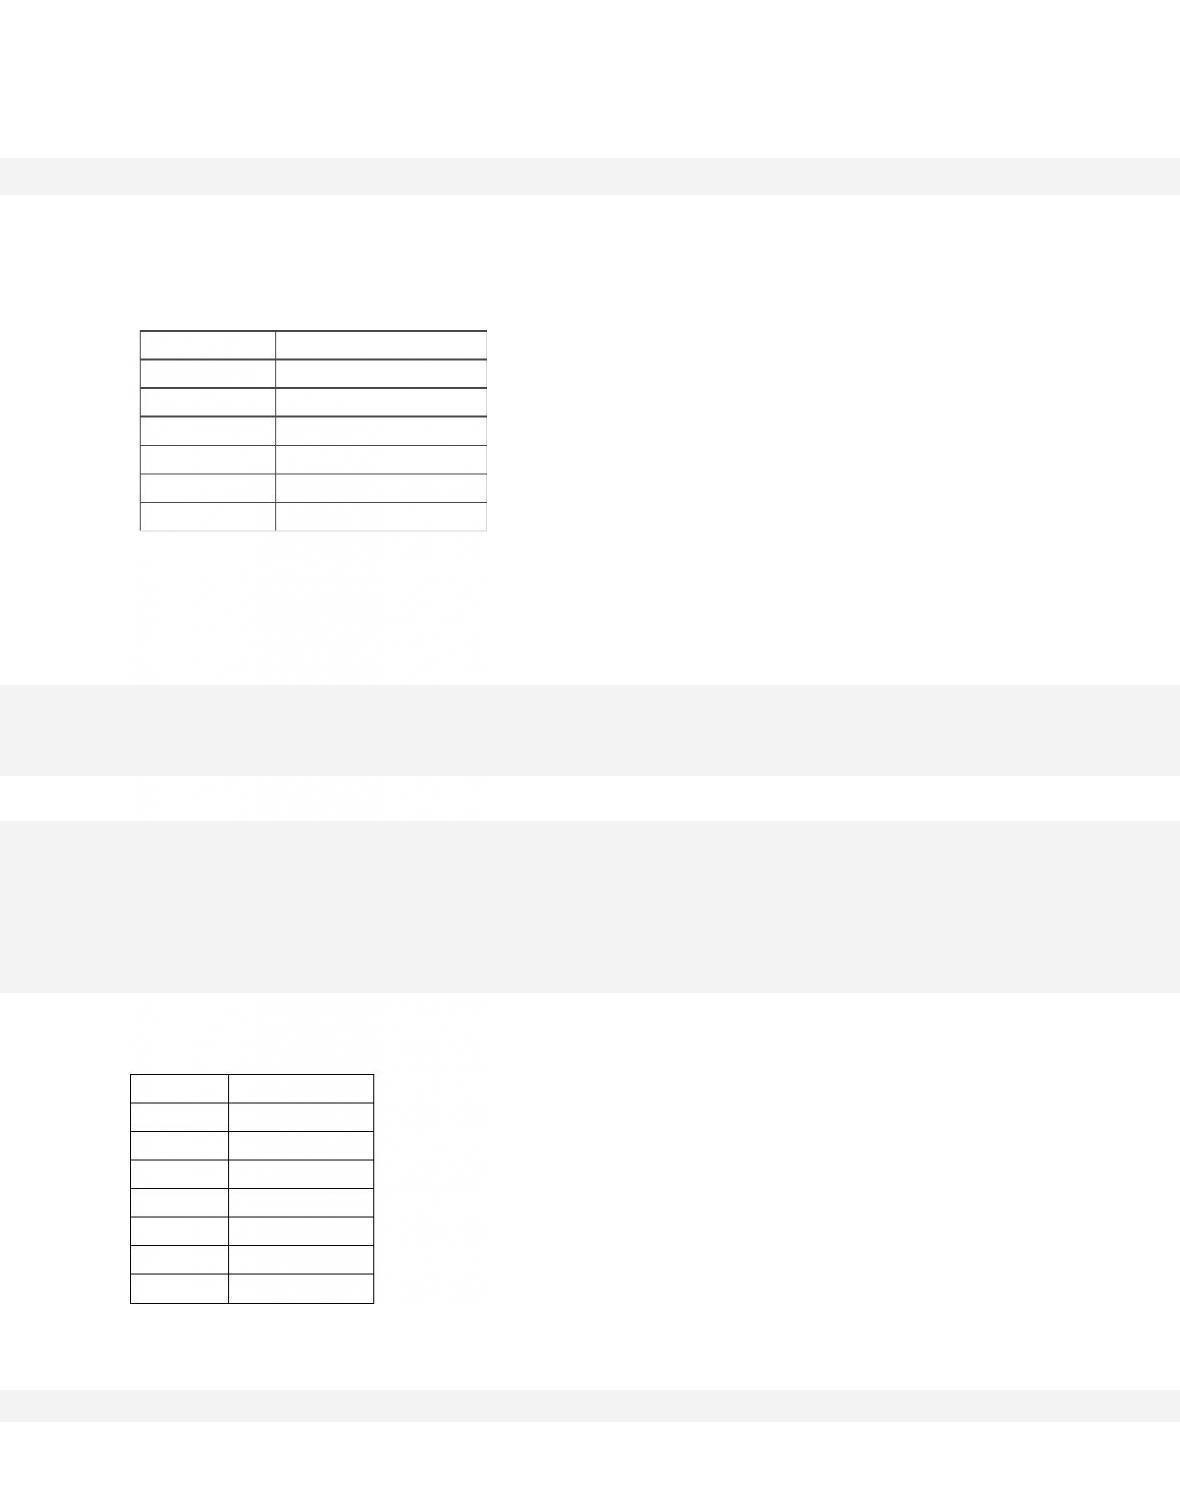
259.
Ouput
Total Cost
0
$10
1
20
2
28
3
38
4
53
5
73
6
98
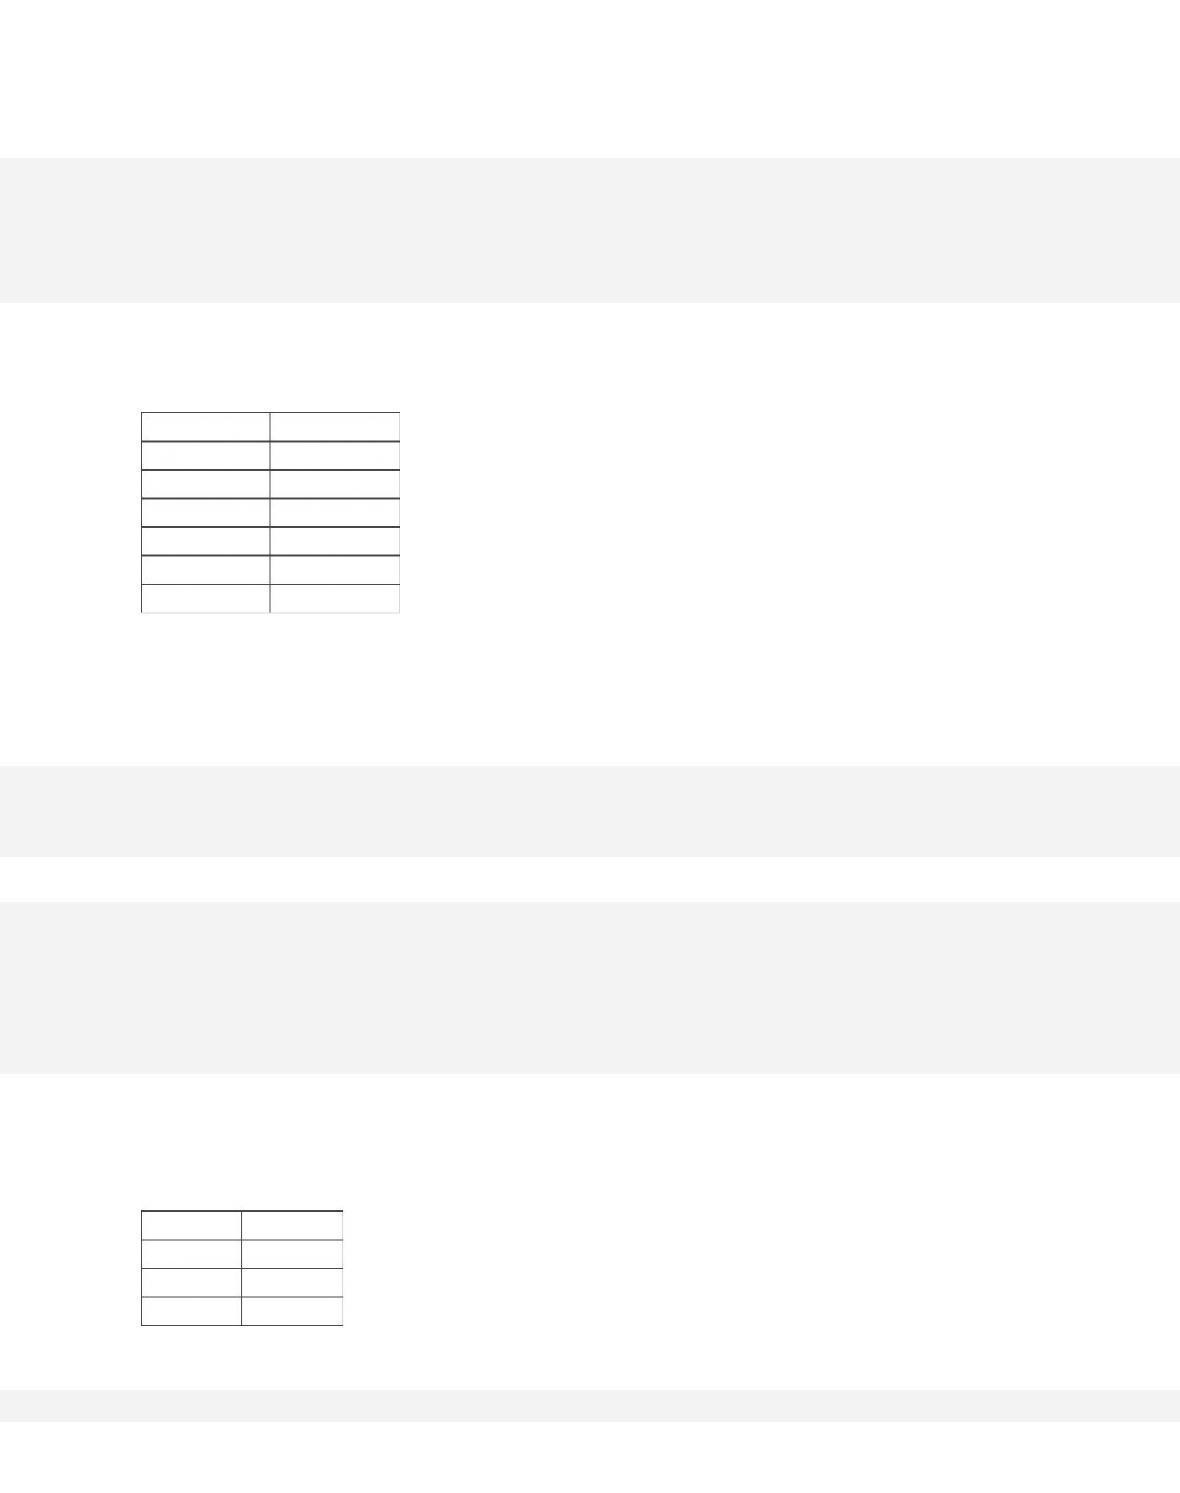
Refer to the provided table. The average variable cost of producing 3 units of output is
260.
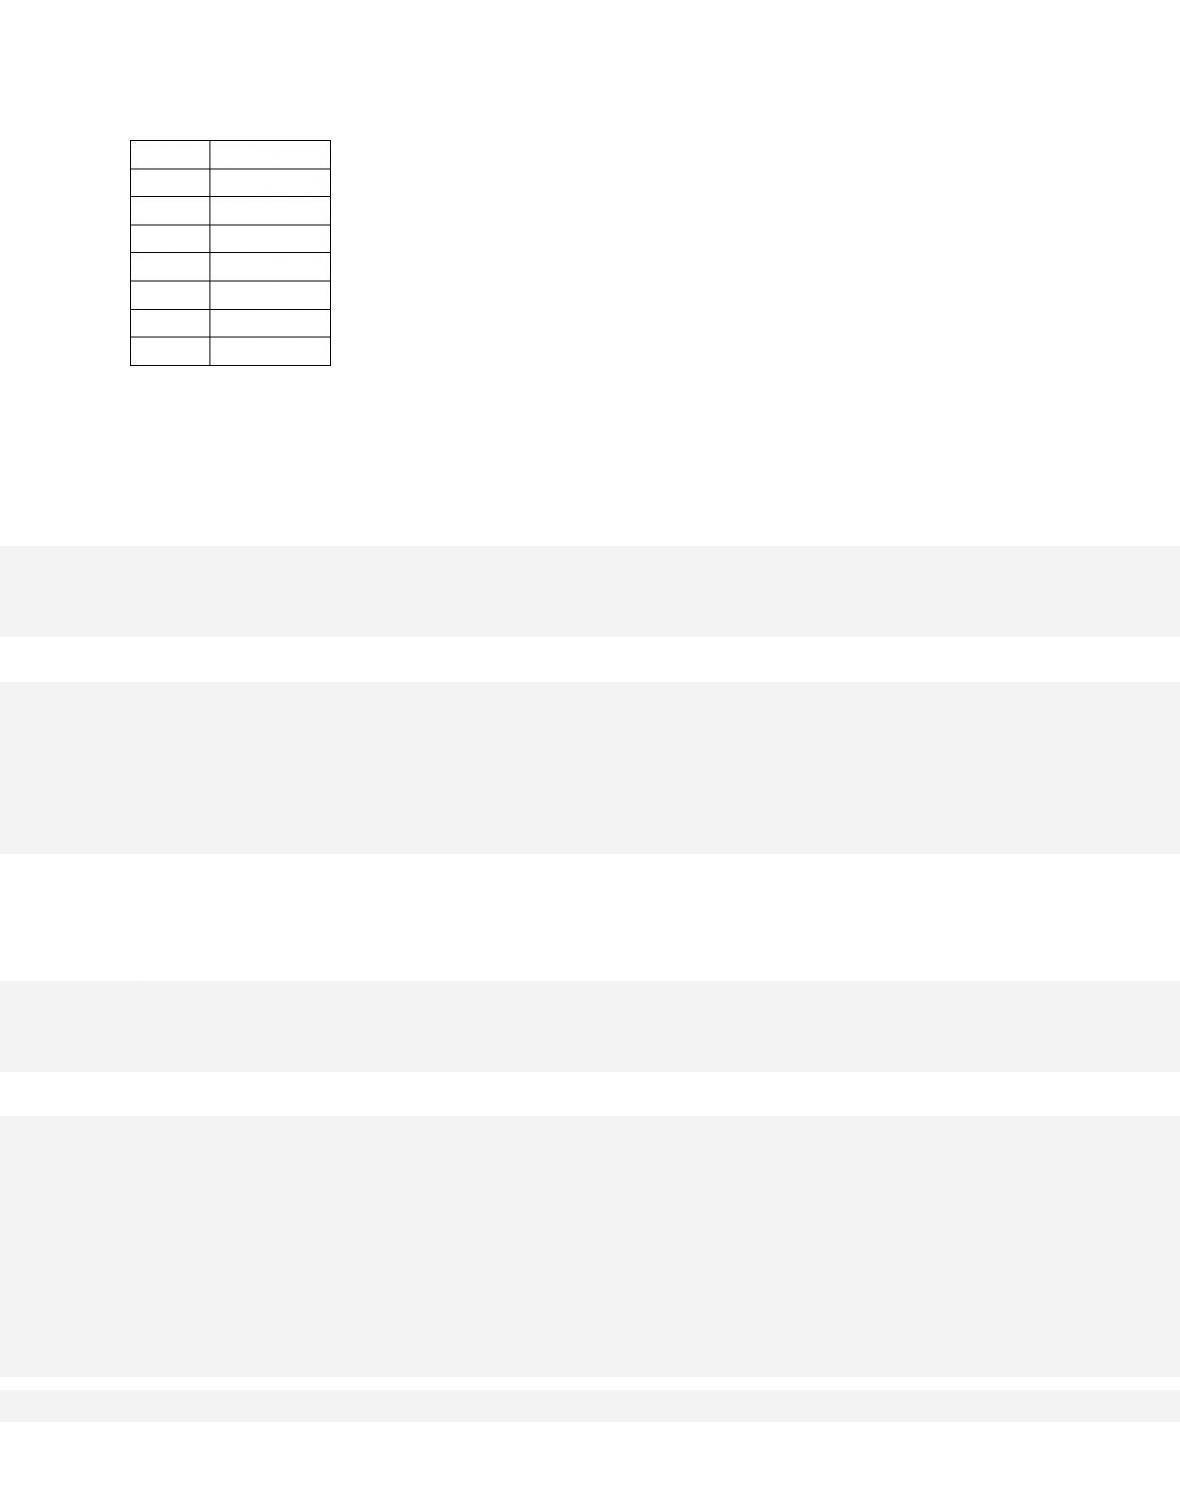
Ouput
Total Cost
0
$10
1
20
2
28
3
38
4
53
5
73
6
98
Refer to the provided table. The marginal cost of producing the sixth unit of output is
261. If total fixed cost is $200, total variable cost is $600, and total product is 4 units, then
average total cost must be

262. If a firm produces 10 units of output, total costs are $1,030, and average fixed costs
are $10, then total variable costs are
263. When producing 8 units of output, average fixed cost is $12.50 and average variable
cost is $81.25. Total cost at this output level is
264.
If average variable cost is $74 and total fixed cost is $100 at 5 units of output, then average
total cost at this output level is

9-144
Copyright © 2018 McGraw-Hill Education. All rights reserved. No reproduction or distribution without the prior
written consent of McGraw-Hill Education.
Blooms: Understand
Diffic ul ty: 02 Medium
Learning Objective: 09–03 Describe the distinctions between fixed and variable costs and
among total, average, and marginal costs.
Test Bank: II
Topi c: Short-Run Production Costs
265.
With fixed costs of $400, a firm has average total costs of $3 and average variable costs of
$2.50. Its output quantity must be
266. At an output of 1,000 units per year, a firm‘s variable costs are $5,000 and its average
fixed costs are $3. Its total costs per year are
267.
At an output level of 50 units per day, a firm has average total costs of $60 and average
variable costs of $35. Its total fixed costs are

9-145
Copyright © 2018 McGraw-Hill Education. All rights reserved. No reproduction or distribution without the prior
written consent of McGraw-Hill Education.
A. $925.
B.
$1,250.
C. $1,750.
D. $3,000.
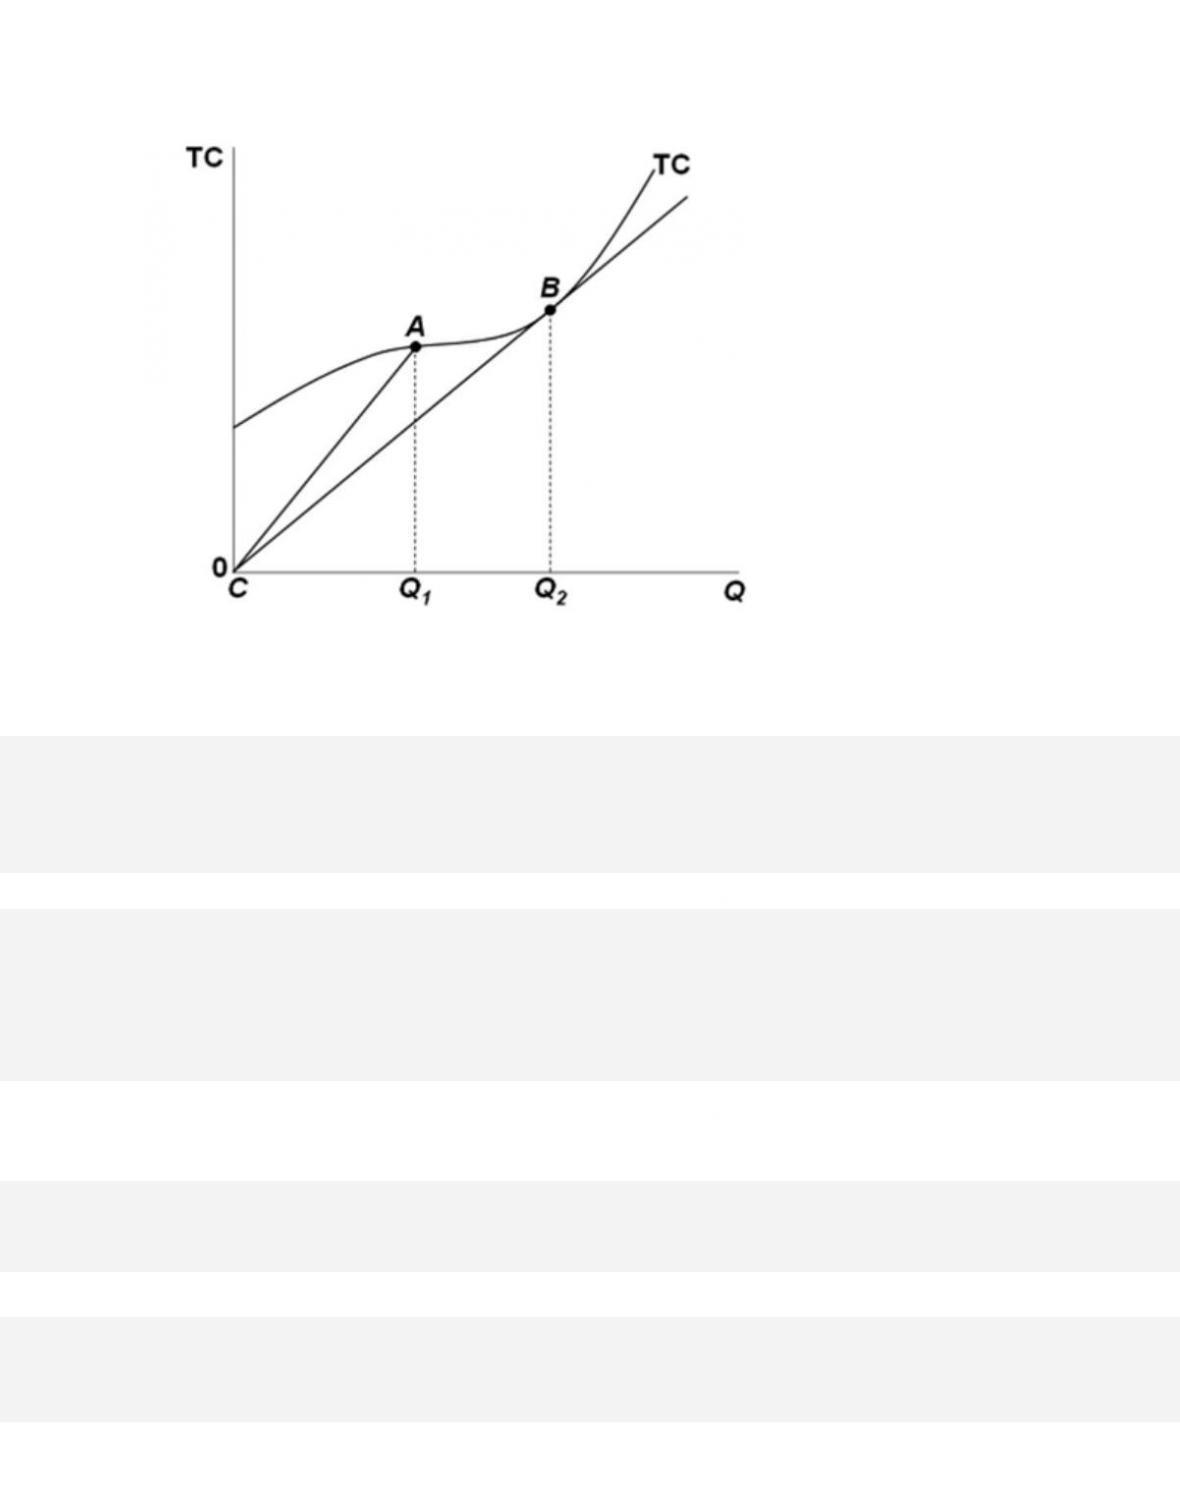
268. The vertical distance between the TC curve and TVC curve is equal to
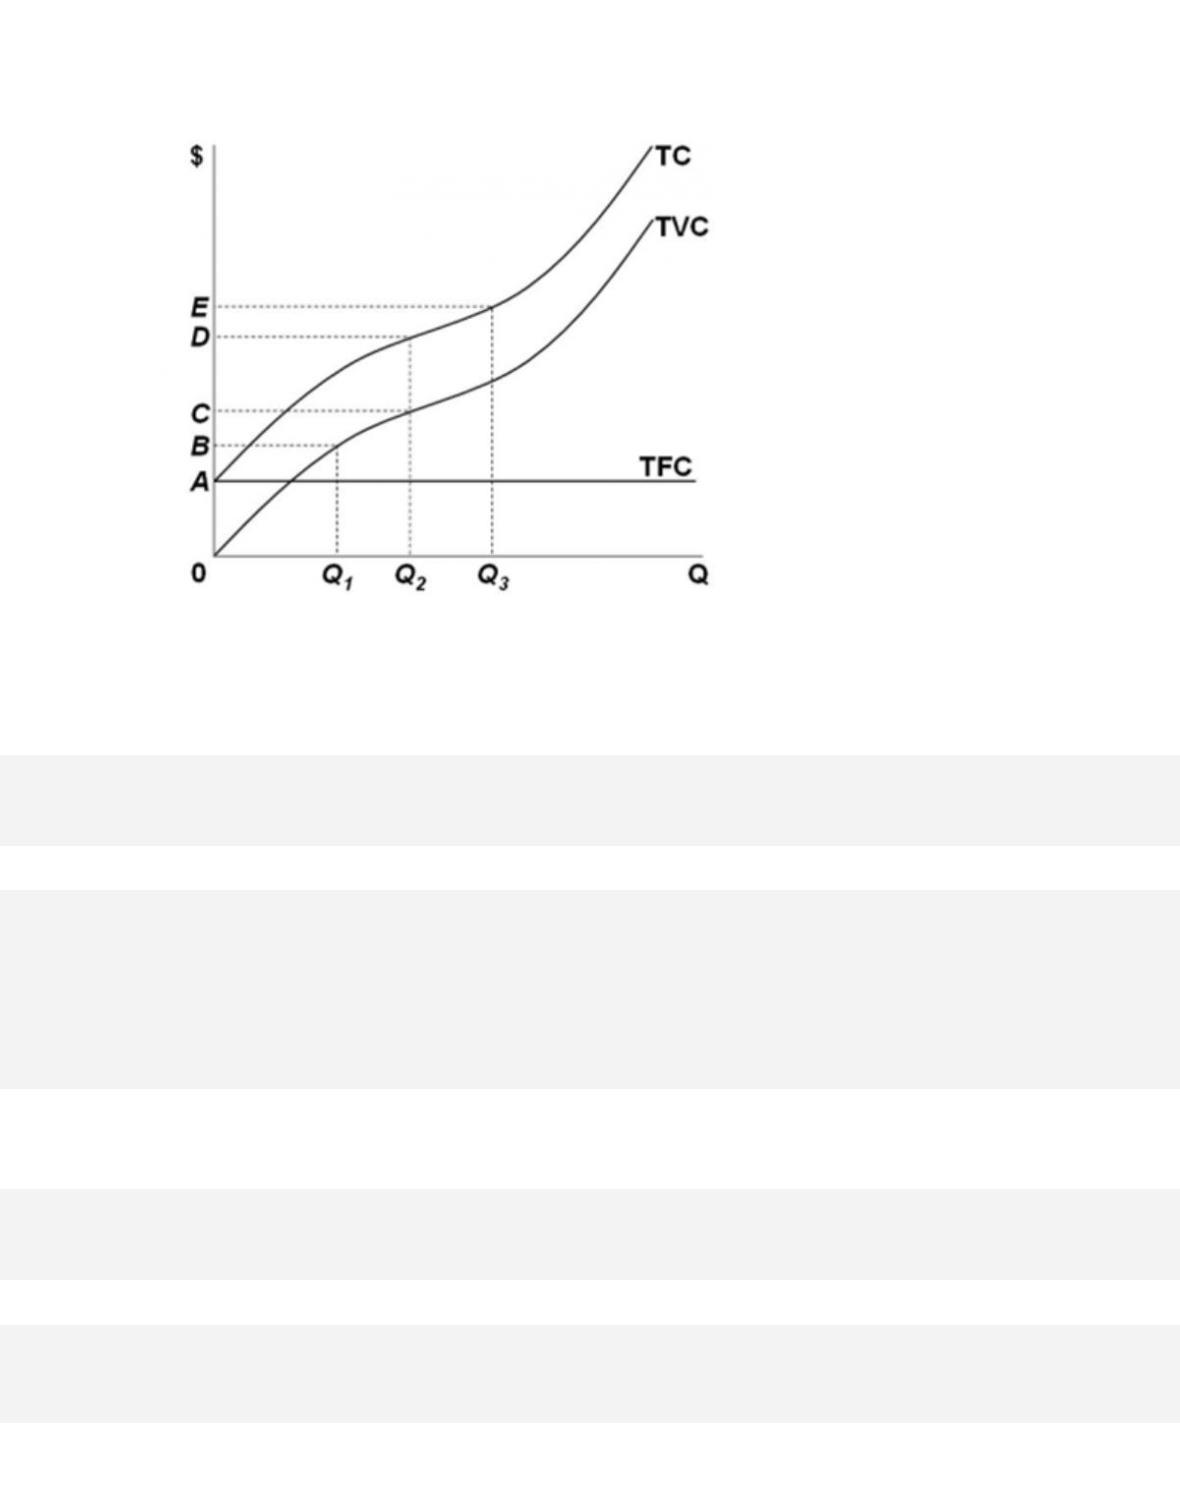
269.
Refer to the provided graph of cost curves. Total fixed cost at output level Q2 is measured by
270.
At any level of output.

9-147
Copyright © 2018 McGraw-Hill Education. All rights reserved. No reproduction or distribution without the prior
written consent of McGraw-Hill Education.
A c c e s s i b i l i t y : Keyboard Navigation
Blooms: Understand
Diffic ul ty: 02 Medium
Learning Objective: 09–03 Describe the distinctions between fixed and variable costs and
among total, average, and marginal costs.
Test Bank: II
Topi c: Short-Run Production Costs
271.
Marginal cost can be defined as the
272.
The reason the marginal cost curve eventually increases as output increases for the typical
firm is because of
273.
When marginal cost is increasing,

9-148
Copyright © 2018 McGraw-Hill Education. All rights reserved. No reproduction or distribution without the prior
written consent of McGraw-Hill Education.
C.
average total cost must be decreasing.
D. average fixed cost might be increasing or decreasing.
274.
As output increases, average fixed costs
275.
The law of diminishing returns explains why
276.
The range over which average variable cost is increasing is the same as the range over
which
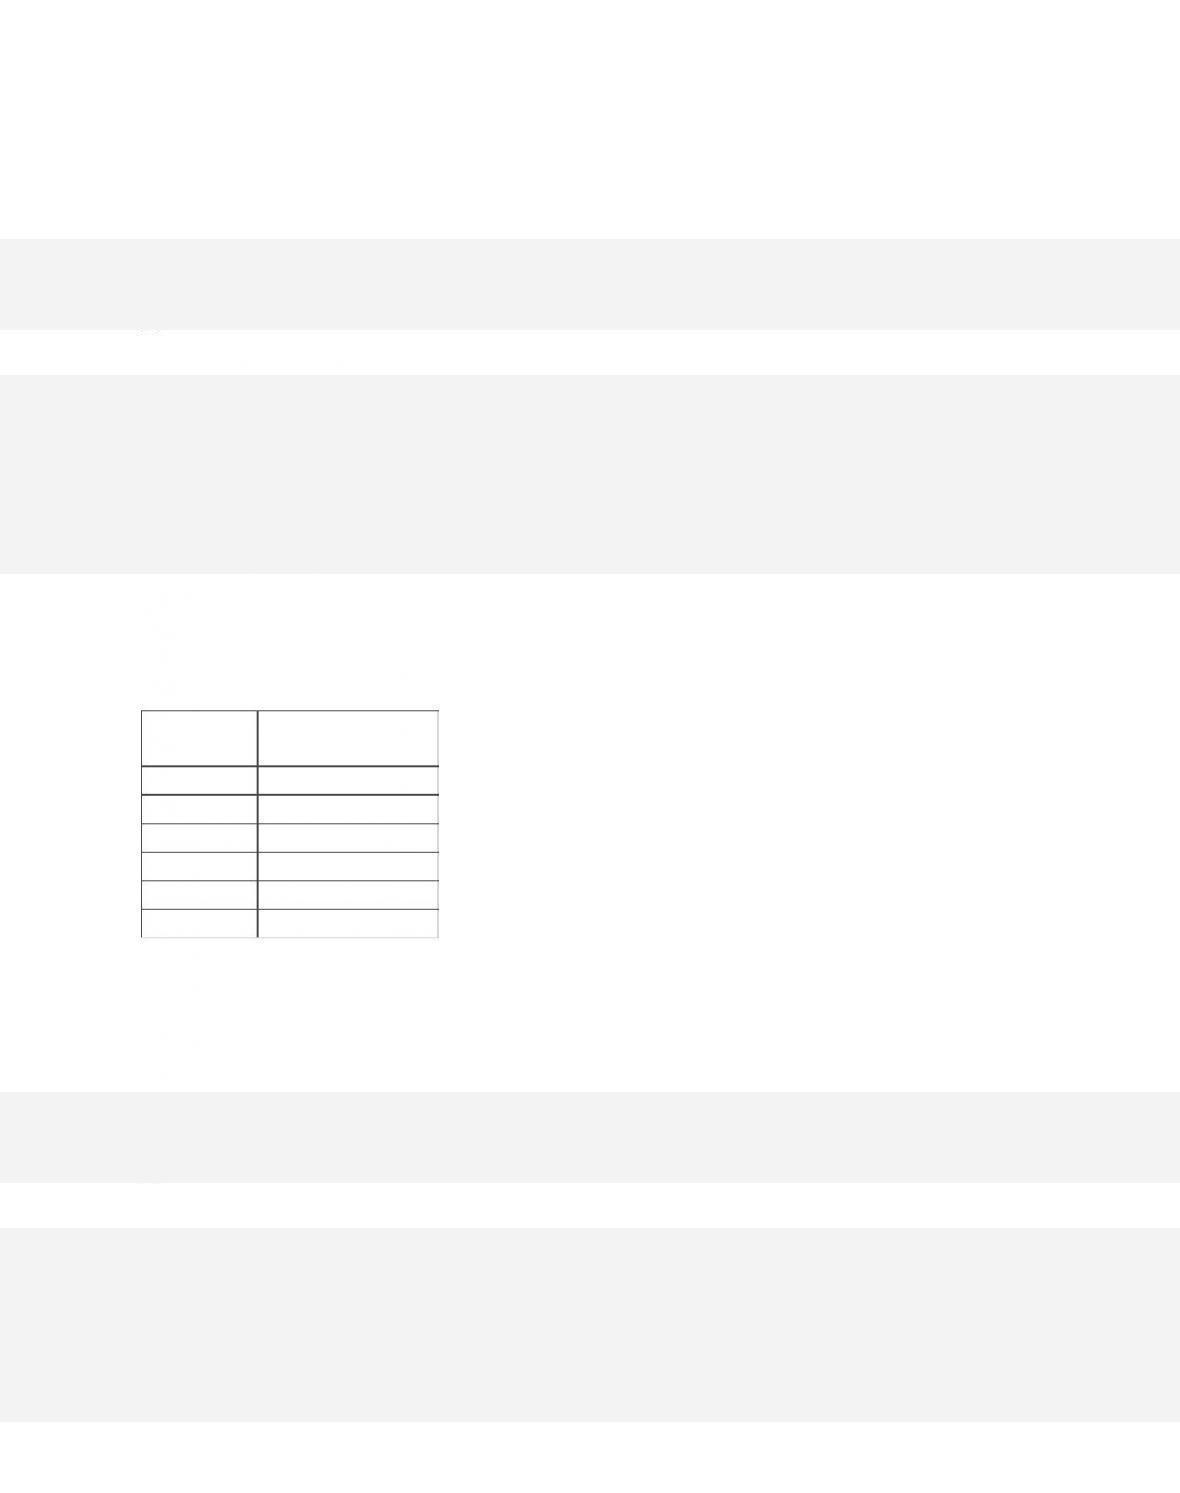
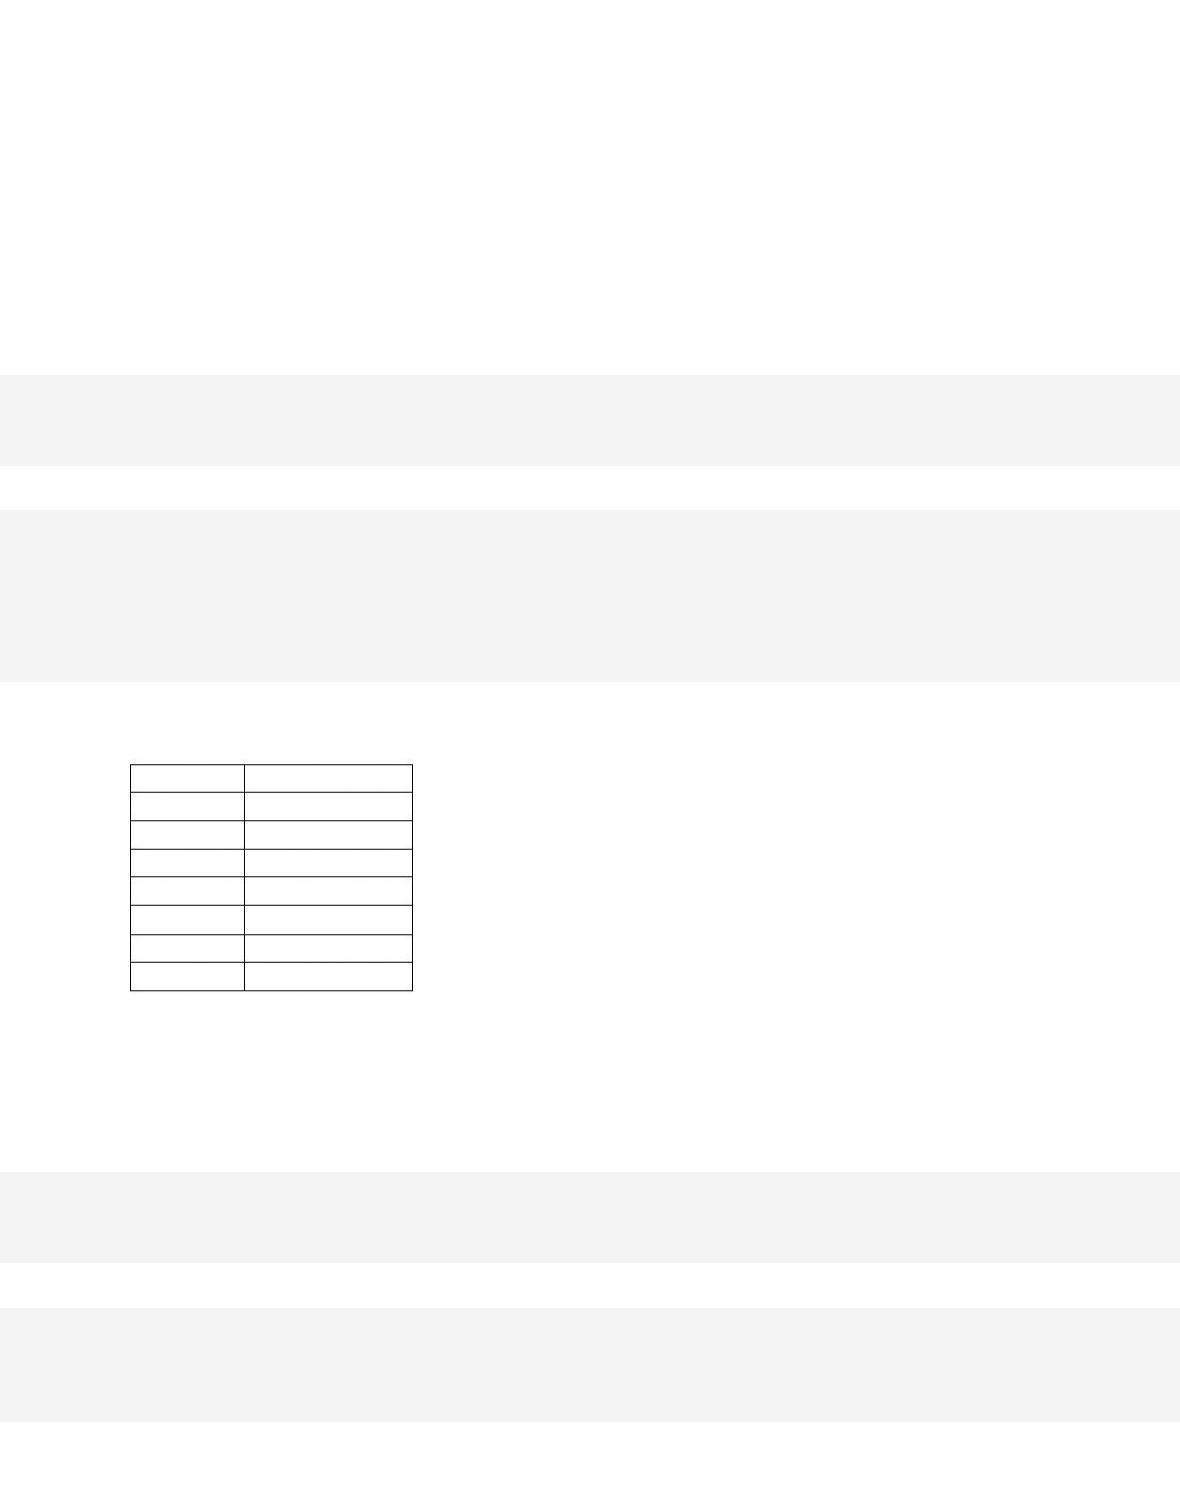
277.
The fixed cost of the firm is $500. The firm’s total variable cost is indicated in the
table.
output
Total Variable
Cost
1
$ 400
2
720
3
1,000
4
1,400
5
2,000
6
3,600
The average variable cost of the firm when 5 units of output are produced is
9-150
Copyright © 2018 McGraw-Hill Education. All rights reserved. No reproduction or distribution without the prior
written consent of McGraw-Hill Education.
Test Bank: II
Topi c: Short-Run Production Costs
278.
The fixed cost of the firm is $500. The firm’s total variable cost is indicated in the
table.
output
Total Variable Cost
1
$ 400
2
720
3
1,000
4
1,400
5
2,000
6
3,600
The average total cost of the firm when 3 units of output are being produced is
279.
output
Total Cost
0
$ 400
1
900
2
1,300
3
1,600
4
2,000
5
2,500
6
3,100
Refer to the cost data provided. How much is the firm’s total fixed costs?
280.
output
Total Cost
0
$ 400
1
900
2
1,300
3
1,600
4
2,000
5
2,500
6
3,100
Refer to the cost table provided. Diminishing marginal returns begins to set in with the
production of which unit of output?

9-152
Copyright © 2018 McGraw-Hill Education. All rights reserved. No reproduction or distribution without the prior
written consent of McGraw-Hill Education.
Diffic ul ty: 02 Medium
Learning Objective: 09–03 Describe the distinctions between fixed and variable costs and
among total, average, and marginal costs.
Test Bank: II
Topi c: Short-Run Production Costs
281.
If the short-run average variable cost of production for a firm is decreasing, then it follows
that
282.
Assume a firm is operating at minimum average total cost in the short run. If there is a
decrease in output, it follows that
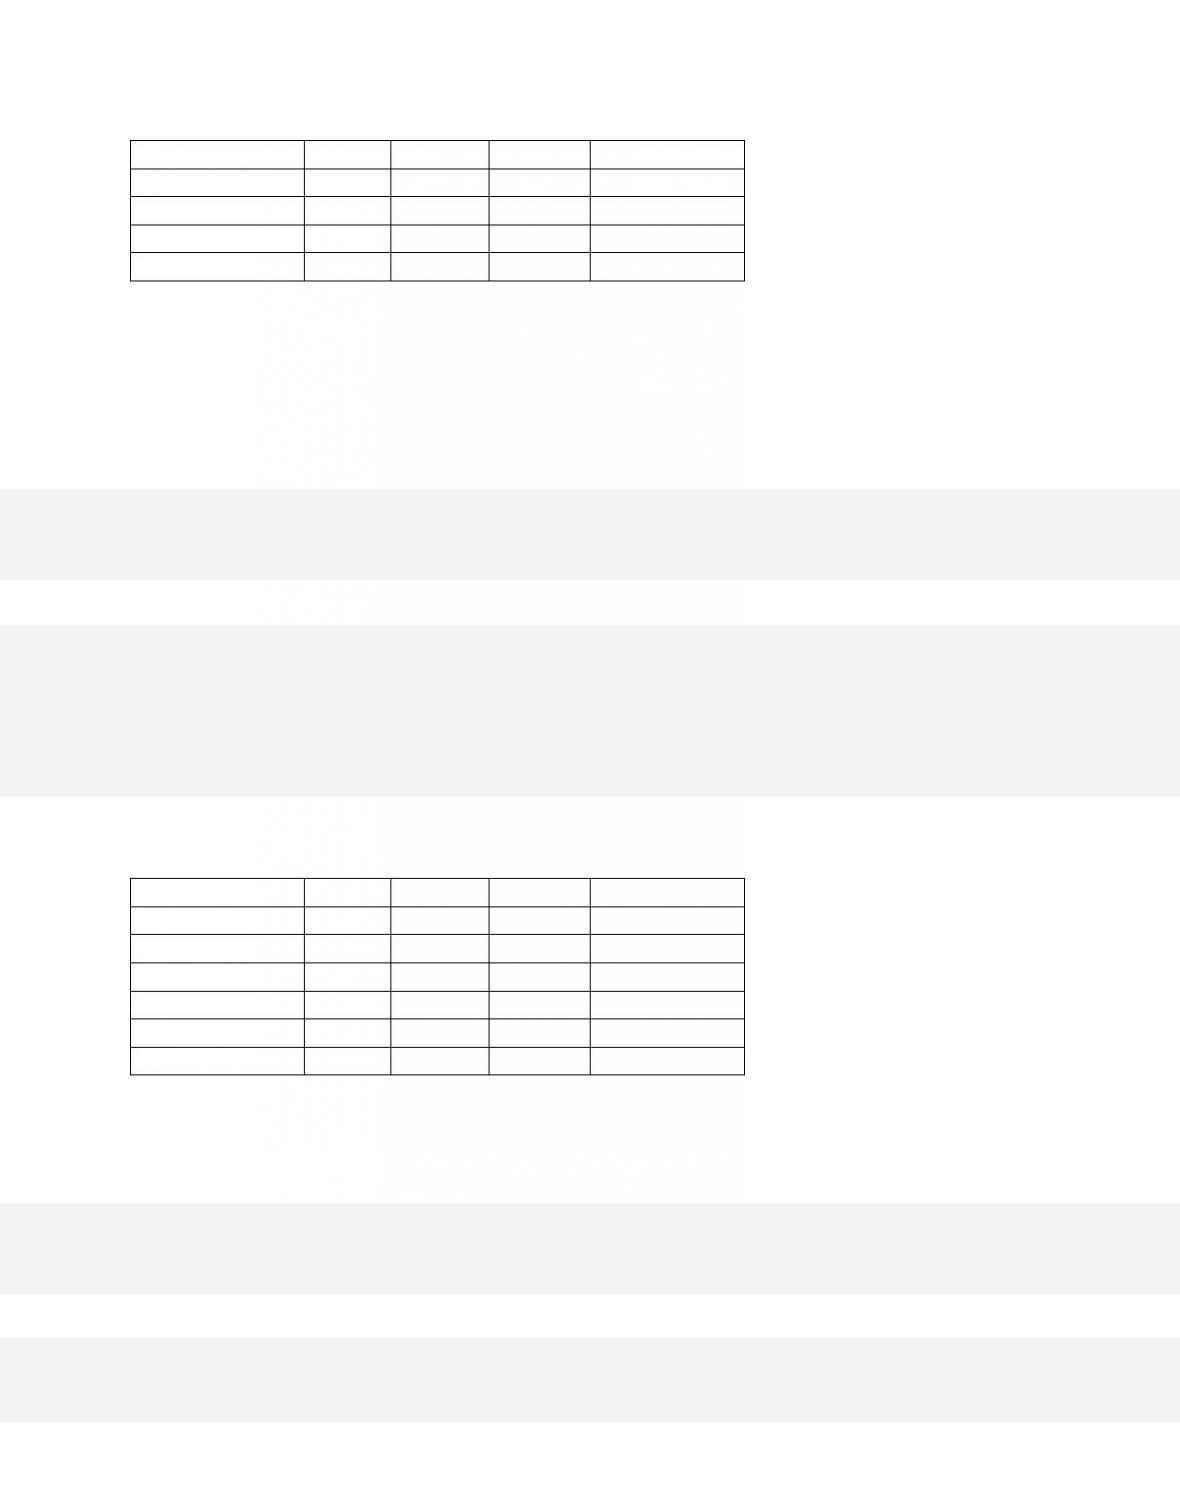
283.
Input (Workers)
Output
TFC ($)
TVC ($)
Total Cost ($)
0
0
50
0
1
8
50
40
90
2
20
50
80
3
28
50
120
170
4
35
50
210
5
41
50
200
250
Refer to the provided table. The average total cost of producing 20 units of output is
284.
Input (Workers)
Output
TFC ($)
TVC ($)
Total Cost ($)
0
0
50
0
1
8
50
40
90
2
20
50
80
3
28
50
120
170
4
35
50
210
5
41
50
200
250
Refer to the provided table. The average variable cost of producing 35 units of output is
9-154
Copyright © 2018 McGraw-Hill Education. All rights reserved. No reproduction or distribution without the prior
written consent of McGraw-Hill Education.
Blooms: Understand
Diffic ul ty: 02 Medium
Learning Objective: 09–03 Describe the distinctions between fixed and variable costs and
among total, average, and marginal costs.
Test Bank: II
Topi c: Short-Run Production Costs
285.
Input (Workers)
Output
TFC ($)
TVC ($)
Total Cost ($)
0
0
50
0
1
8
50
40
90
2
20
50
80
3
28
50
120
170
4
35
50
210
5
41
50
200
250
Refer to the provided table. When output increases from 28 to 35 units, the marginal cost of
the product is
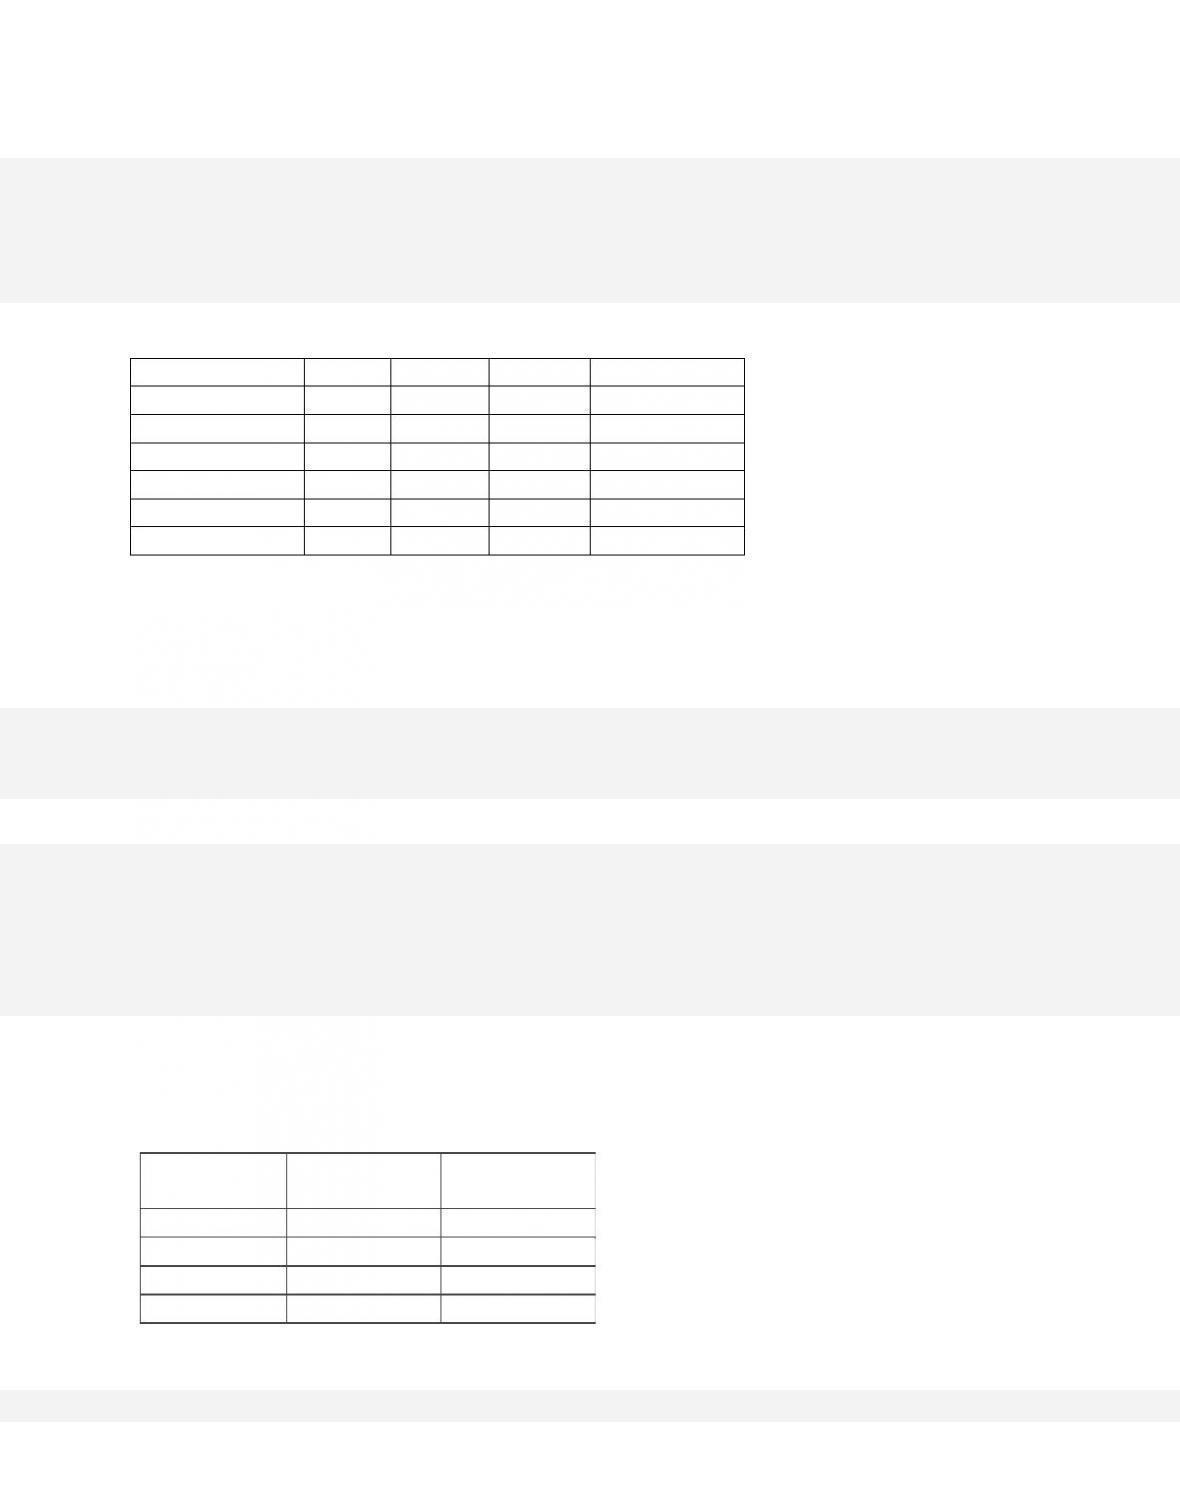
286.
The following table shows the relationship between output and costs for two firms in
the short run.
Output
Total Cost
Firm A
Total Cost
Firm B
0
$
500
$
800
1
1,000
1,200
2
1,600
1,500
3
2,300
1,800
4
2,900
2,200
5
3,800
2,700
Which of the following is correct?
287.
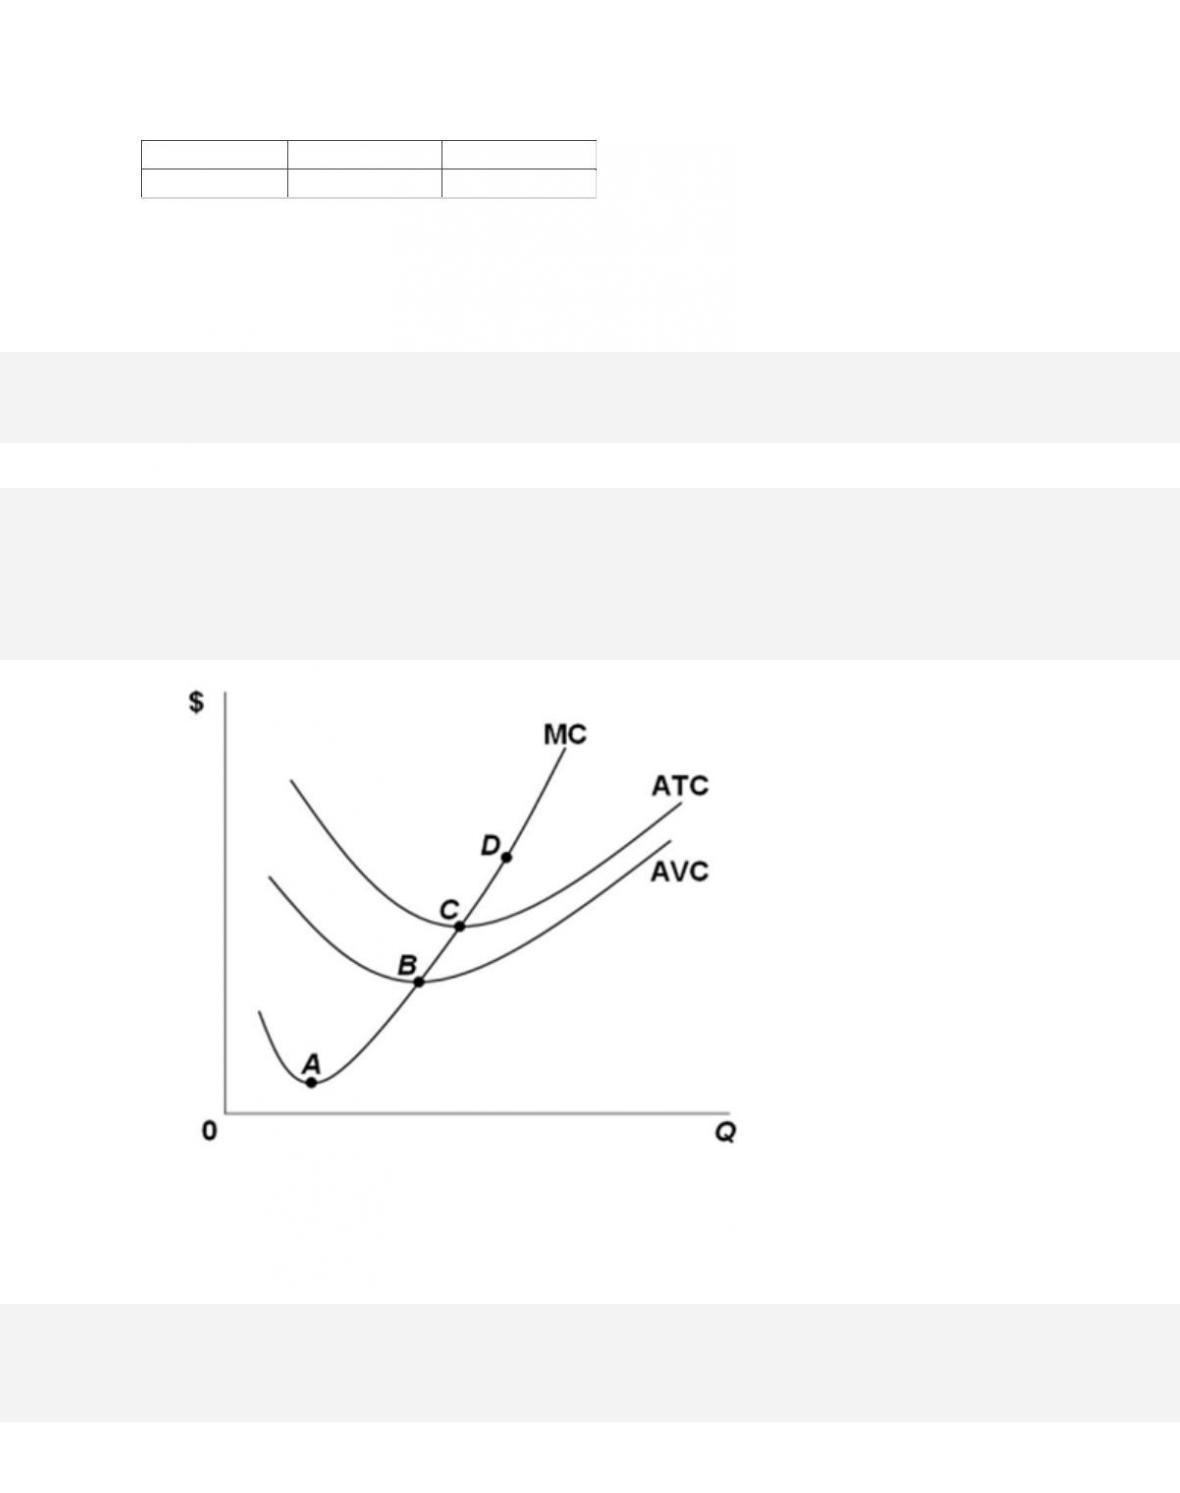
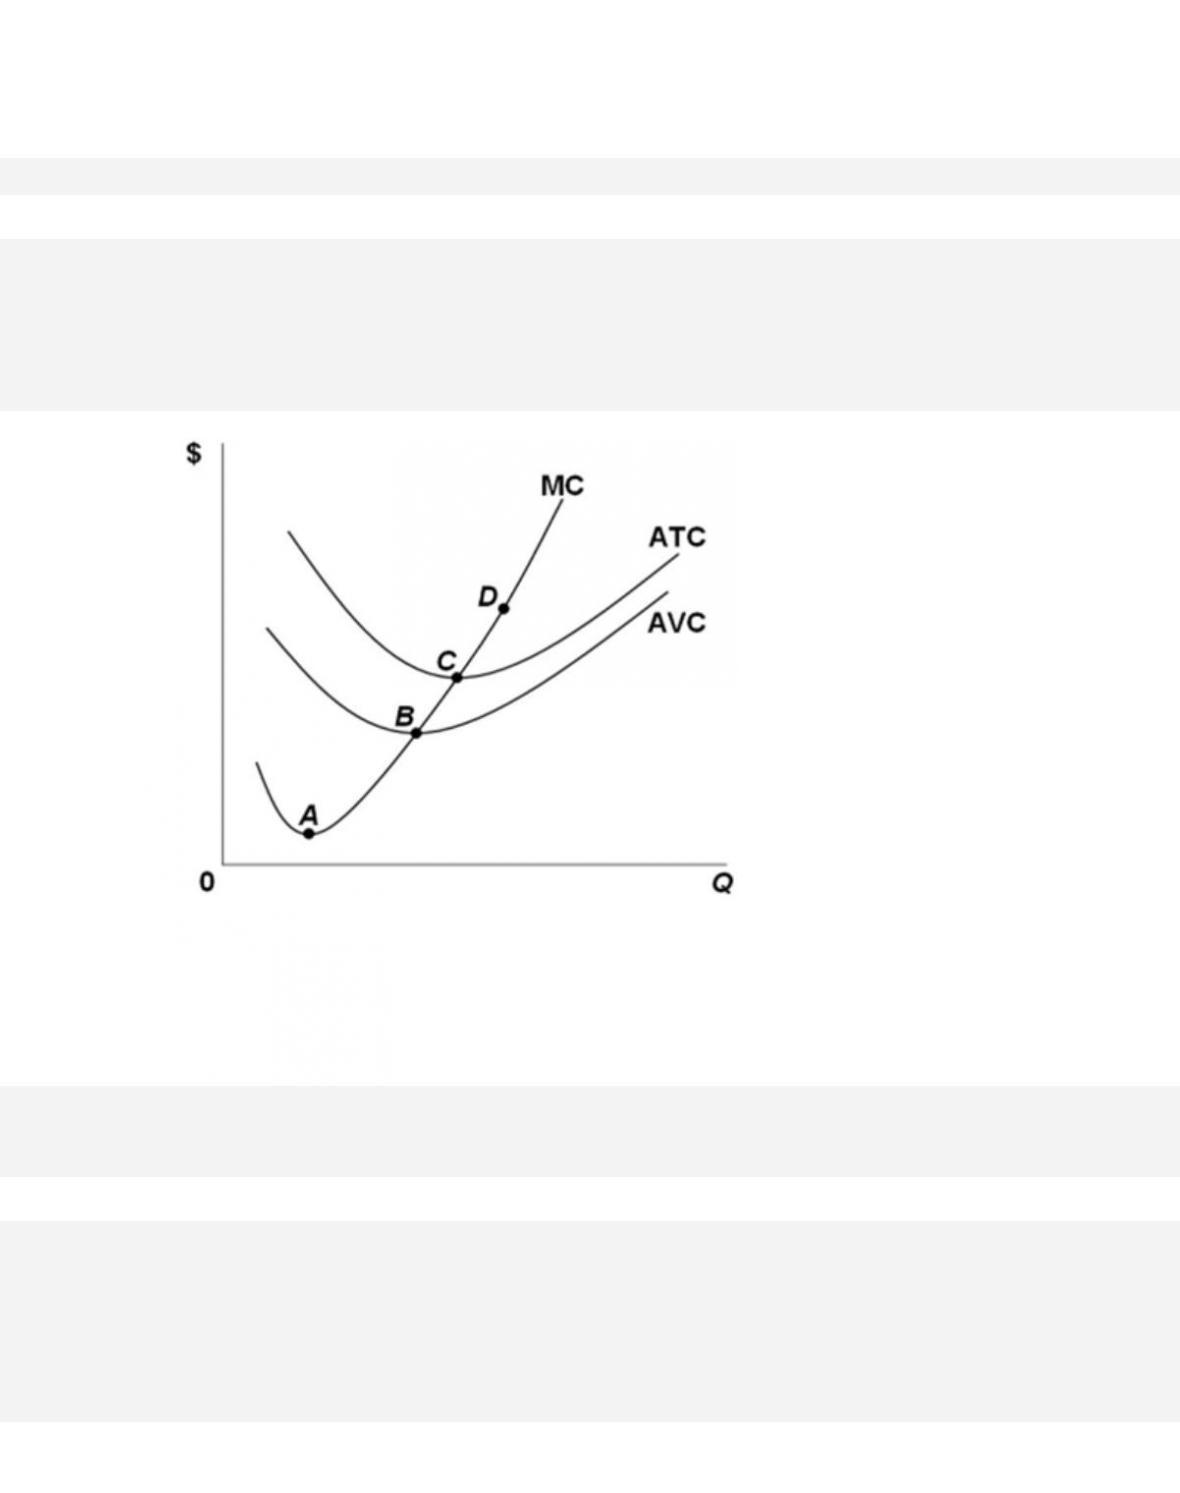
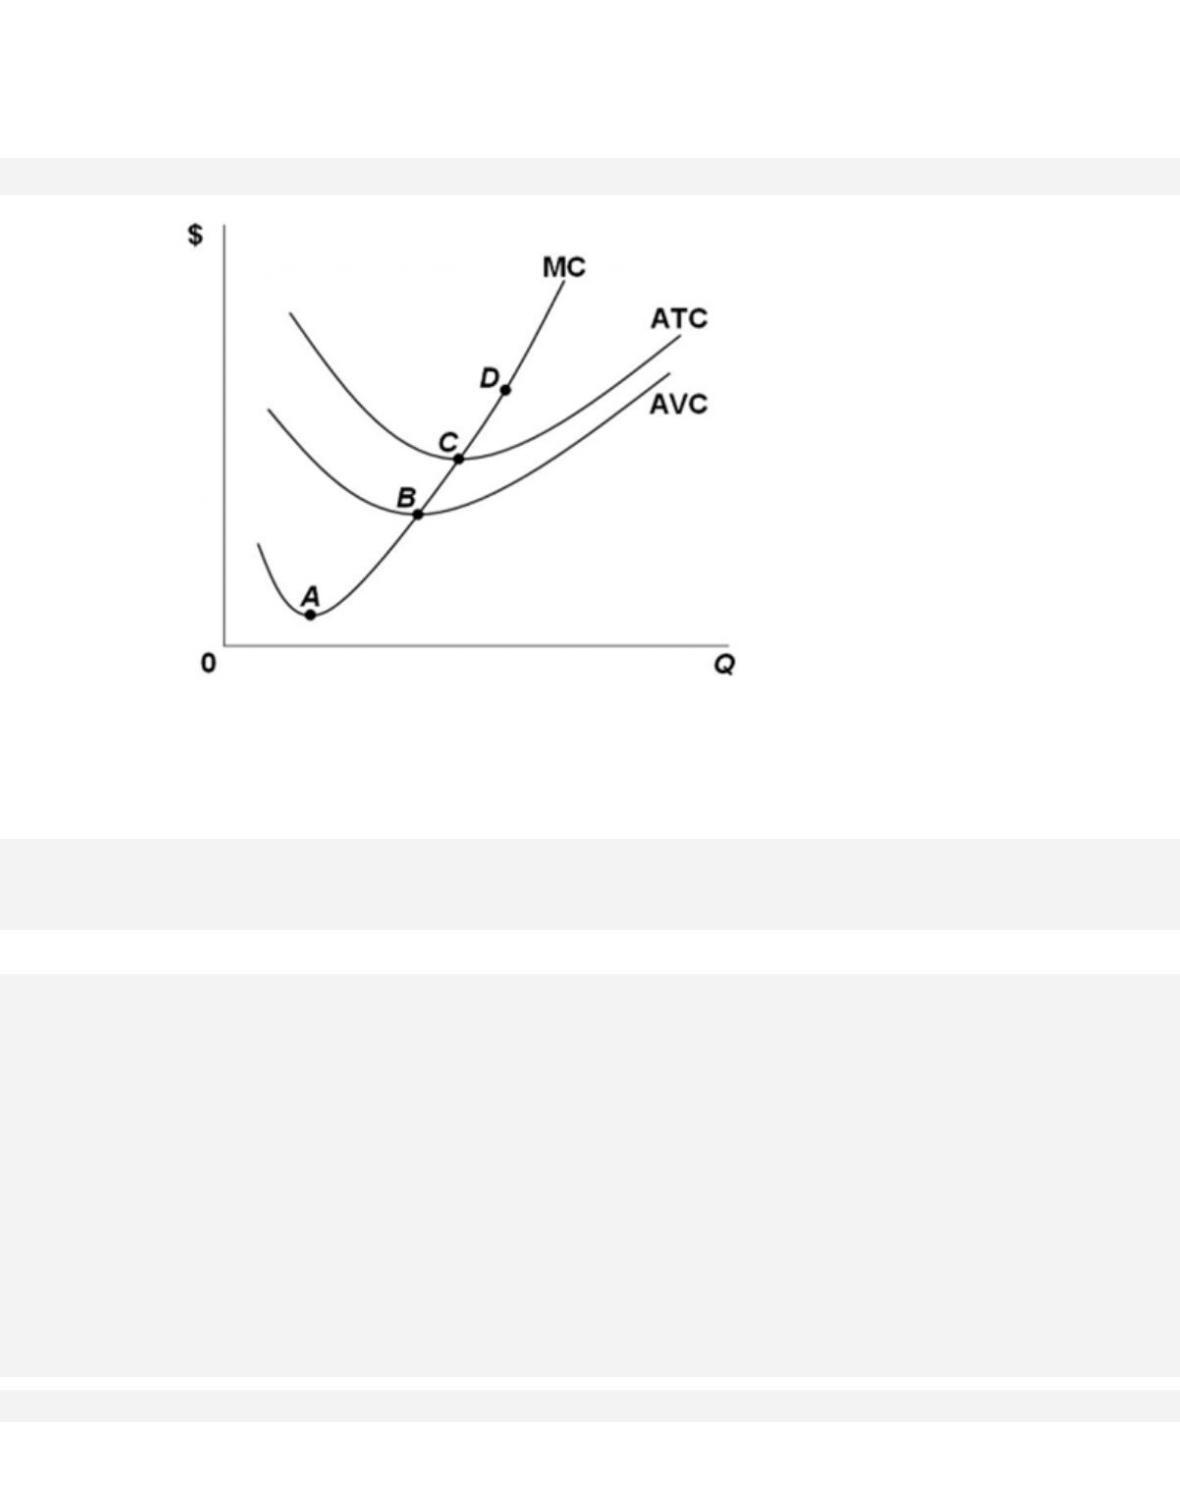
Refer to the provided graph. At which point is marginal product (MP) at its maximum?
9-156
Copyright © 2018 McGraw-Hill Education. All rights reserved. No reproduction or distribution without the prior
written consent of McGraw-Hill Education.
C.
point C
D. point D
288.
Refer to the provided graph. At which point does marginal product (MP) equal average product
(AP) at a specific level of output?
9-157
Copyright © 2018 McGraw-Hill Education. All rights reserved. No reproduction or distribution without the prior
written consent of McGraw-Hill Education.
Test Bank: II
Topi c: Short-Run Production Costs
289.
Refer to the provided graph. At which point is average product (AP) at its maximum?
290.
Based on the diagram provided, which of the following statements is true?
291. If marginal cost is below average variable cost,
9-159
Copyright © 2018 McGraw-Hill Education. All rights reserved. No reproduction or distribution without the prior
written consent of McGraw-Hill Education.
Blooms: Understand
Diffic ul ty: 02 Medium
Learning Objective: 09–03 Describe the distinctions between fixed and variable costs and
among total, average, and marginal costs.
Test Bank: II
Topi c: Short-Run Production Costs
292.
The following cost data are for a firm in the short run.
Output
Total Cost
0
$400
1
500
2
550
3
600
4
650
5
700
What is the firm’s average variable cost at an output of 5 units?
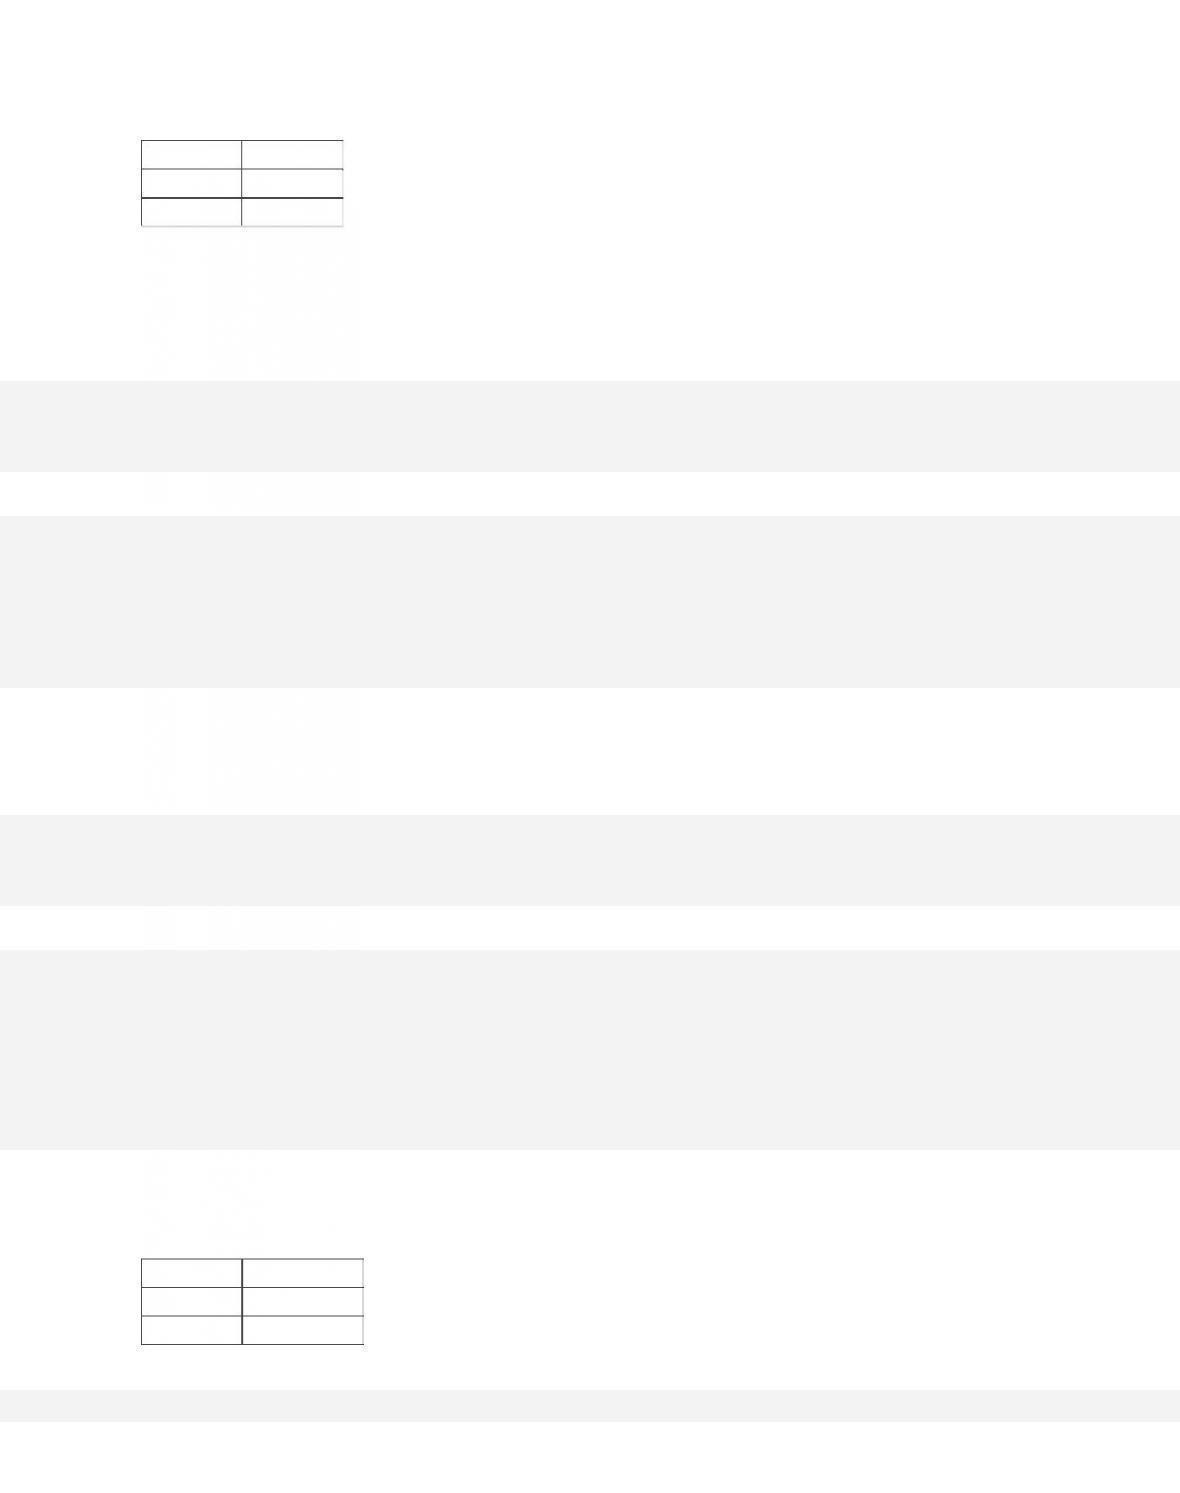
293. The following data show the relationship between total costs and output in the short
run.
Output
Total Cost
0
$5
1
8
2
12
9-160
3
15
4
20
5
27
The firm’s marginal costs are equal to average total cost somewhere between units
294.
If the short-run average variable costs of production for a firm are rising, then this indicates
that
295.
The table shows the relationship between total cost and output for a firm.
Output
Total Cost
0
$ 400
1
600