9-81
Copyright © 2018 McGraw-Hill Education. All rights reserved. No reproduction or distribution without the prior
written consent of McGraw-Hill Education.
among total, average, and marginal costs.
Test Bank: I
Topic: Short-Run Production Costs
Type: Graph
143.
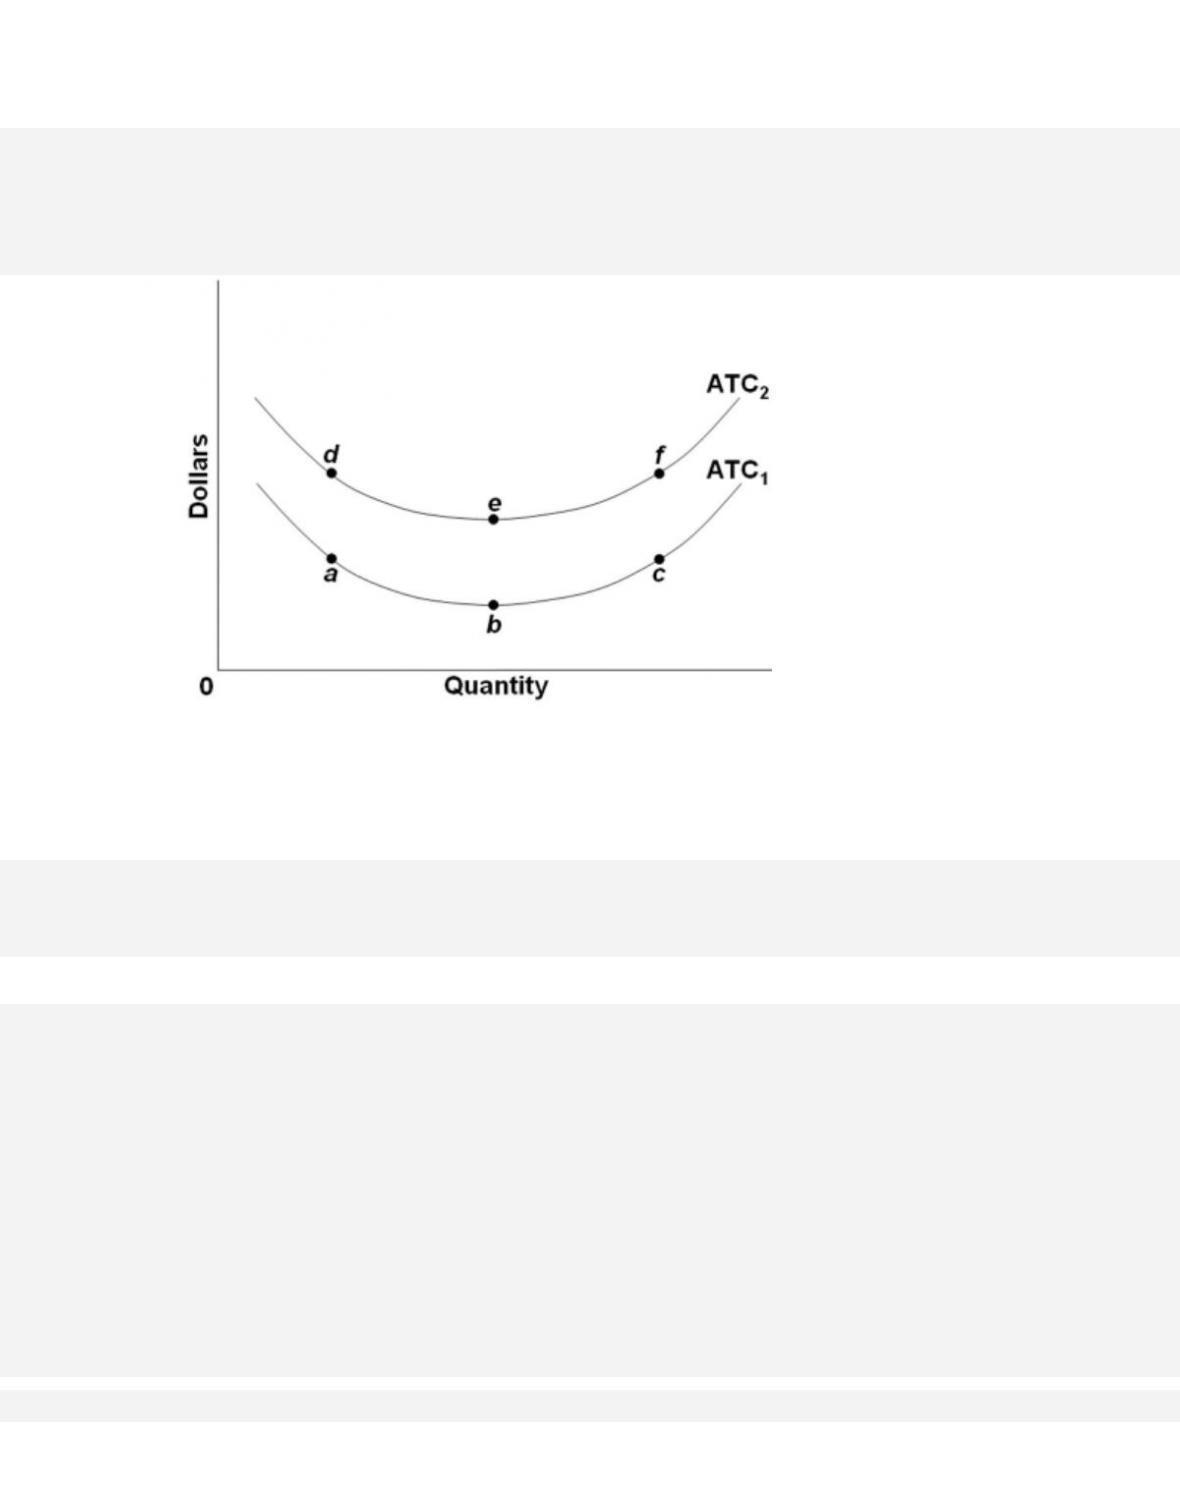
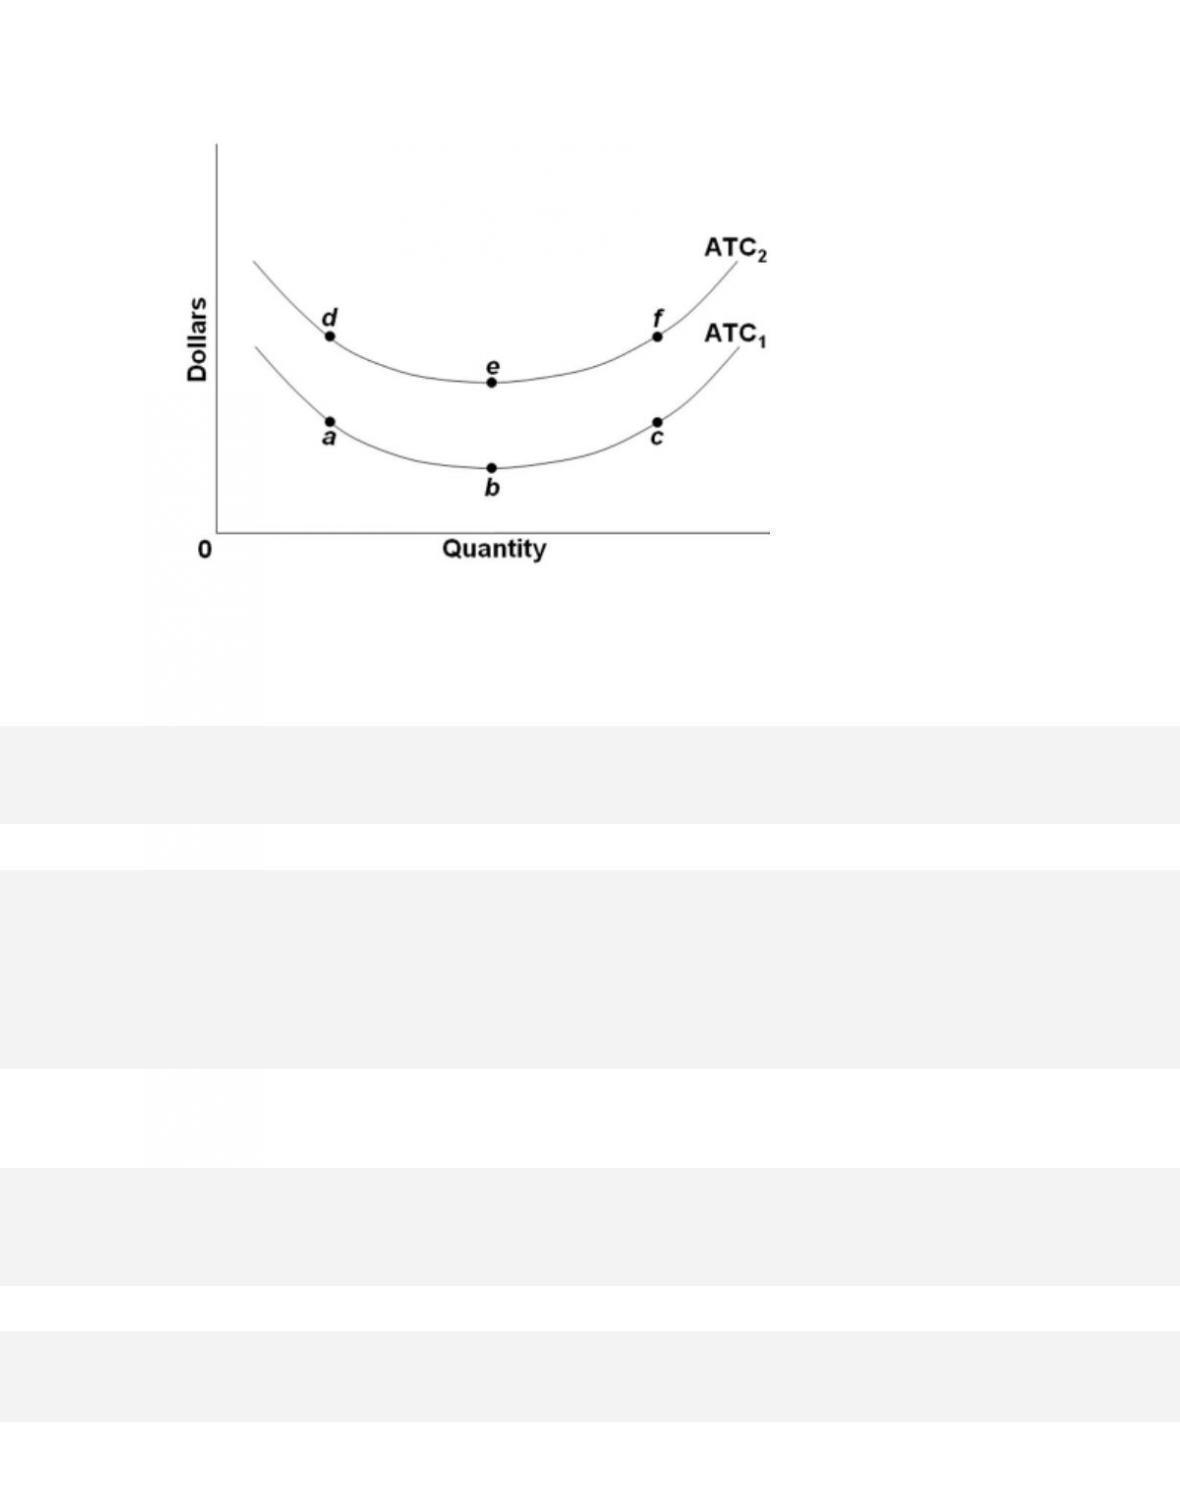
Refer to the graph. Diminishing marginal returns are reflected in
144.
Refer to the graph. A decrease in fixed costs is shown by
145.
Economies and diseconomies of scale explain
9-83
Copyright © 2018 McGraw-Hill Education. All rights reserved. No reproduction or distribution without the prior
written consent of McGraw-Hill Education.
A c c e s s i b i l i t y : Keyboard Navigation
Blooms: Apply
Difficulty: 03 Hard
Learning Objective: 09–04 Use economies of scale to link a firms size and its average costs in
the long run.
Test Bank: I
Topic: Long-Run Production Costs
146.
In the long run,
147.
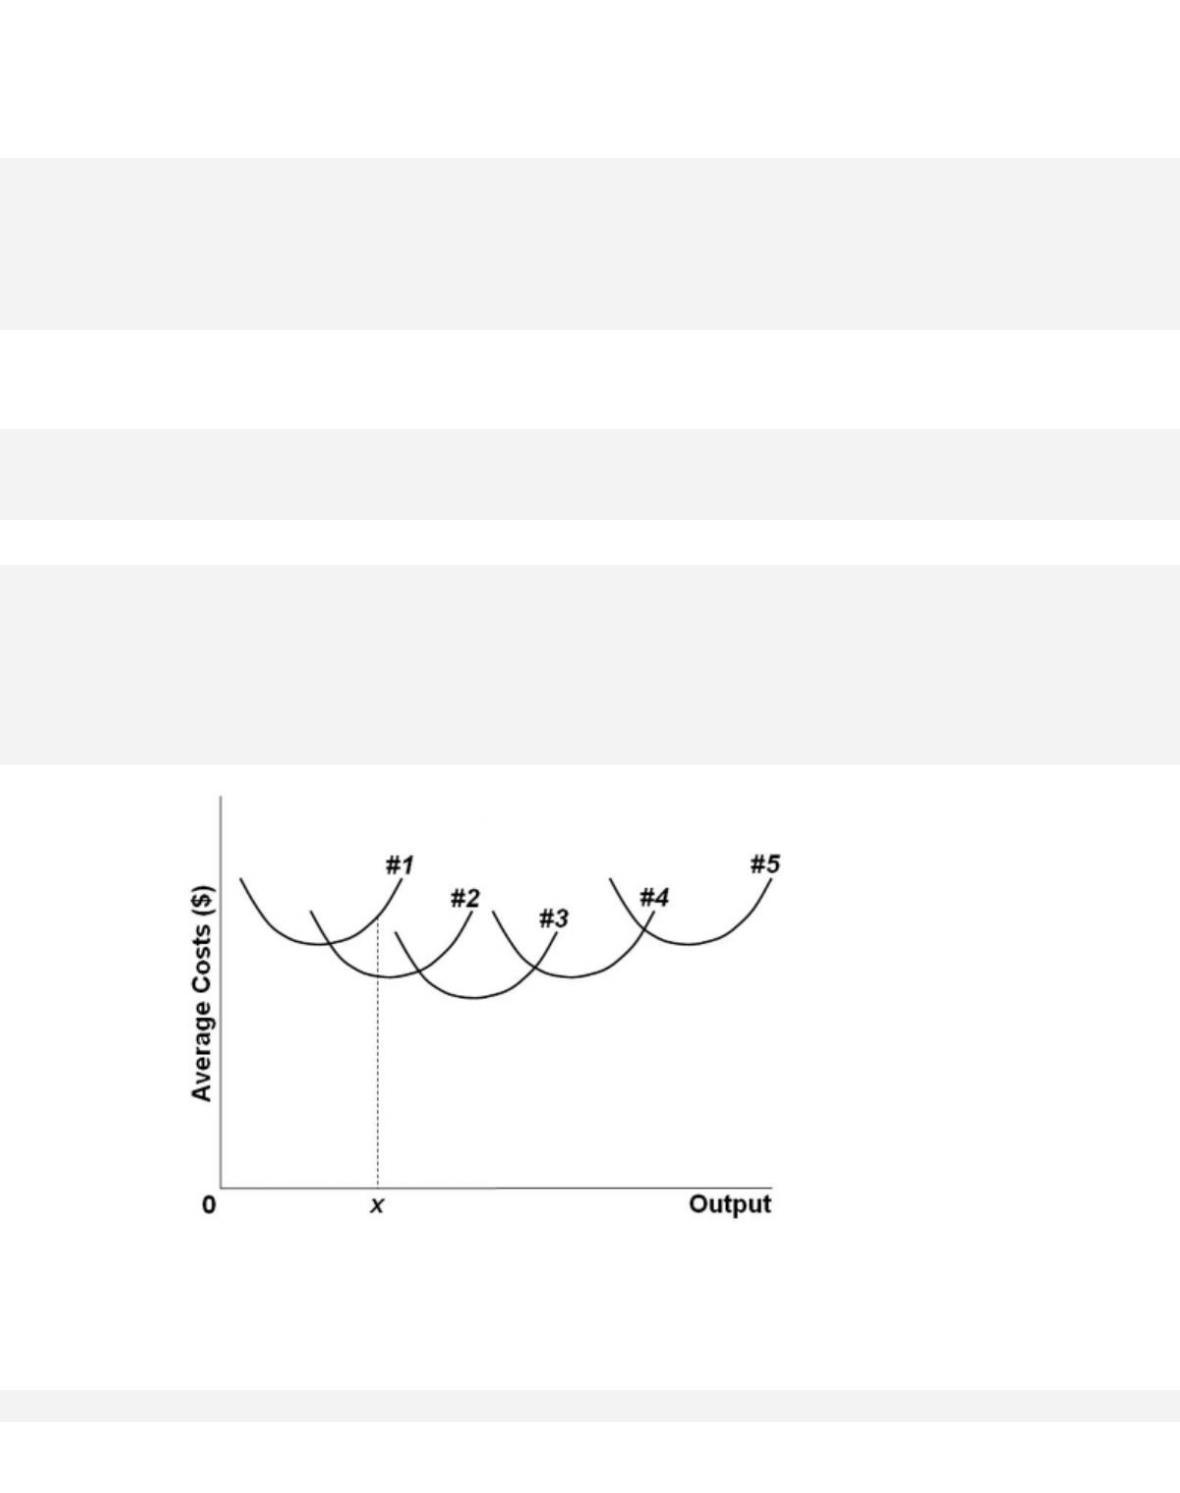
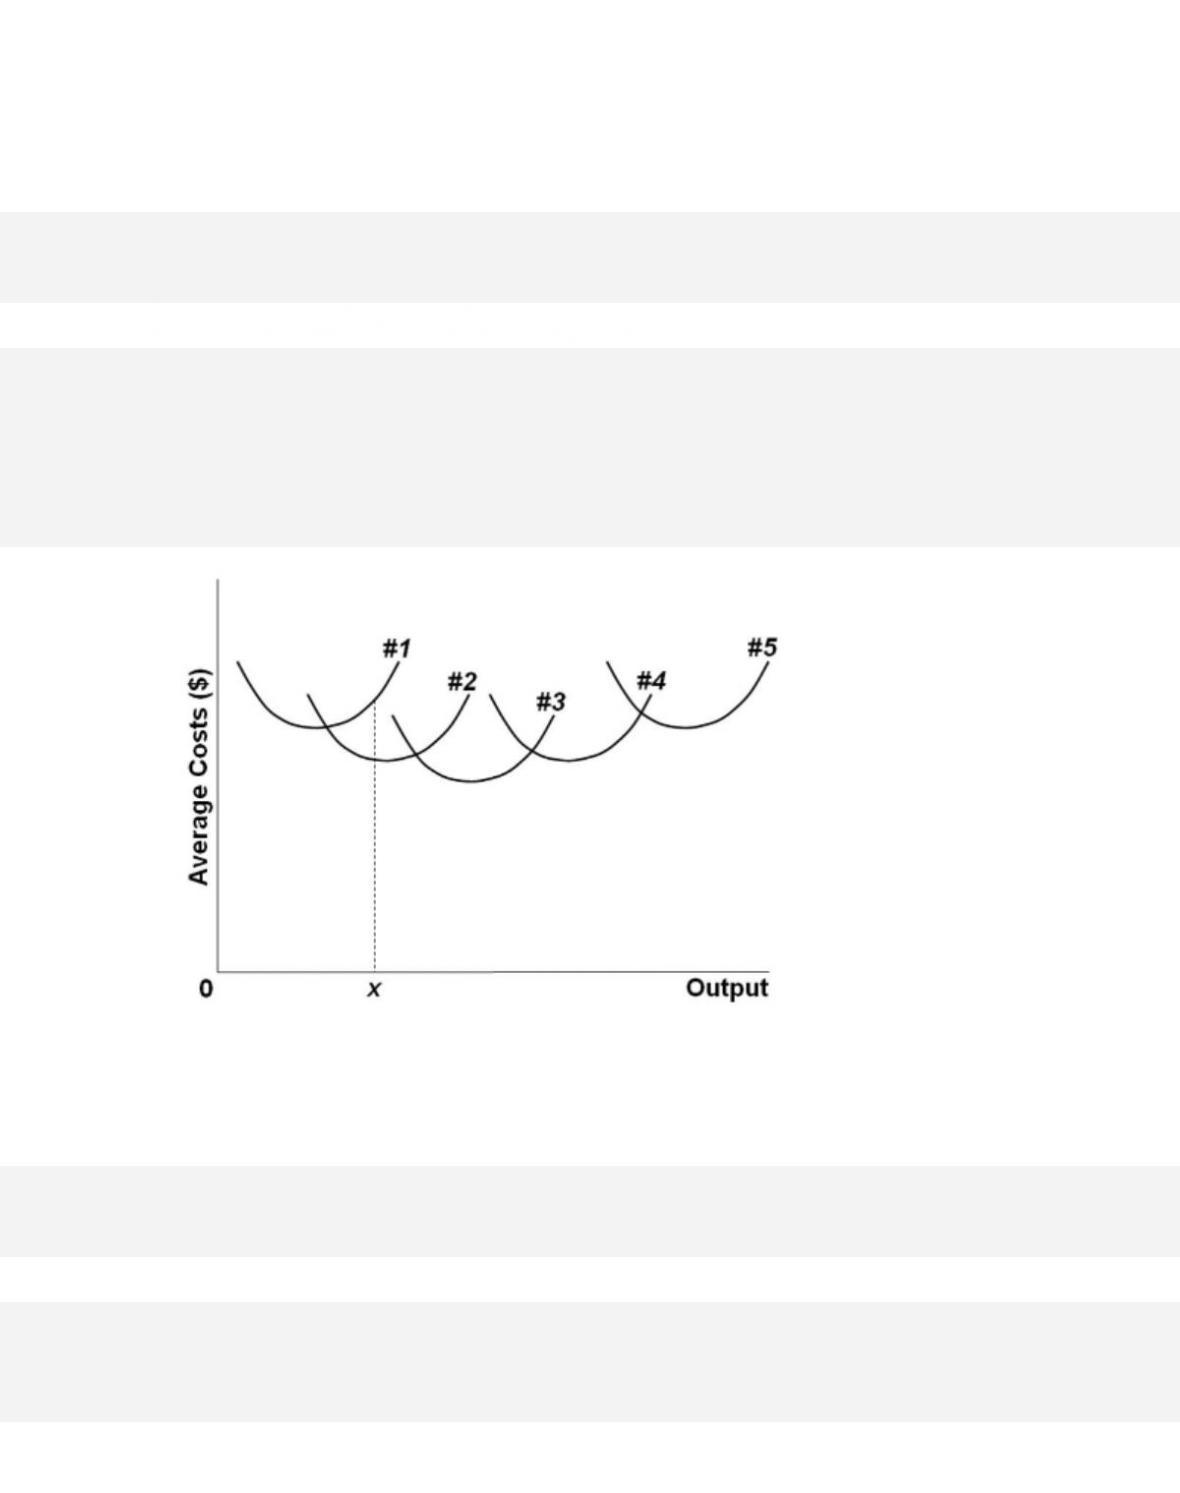
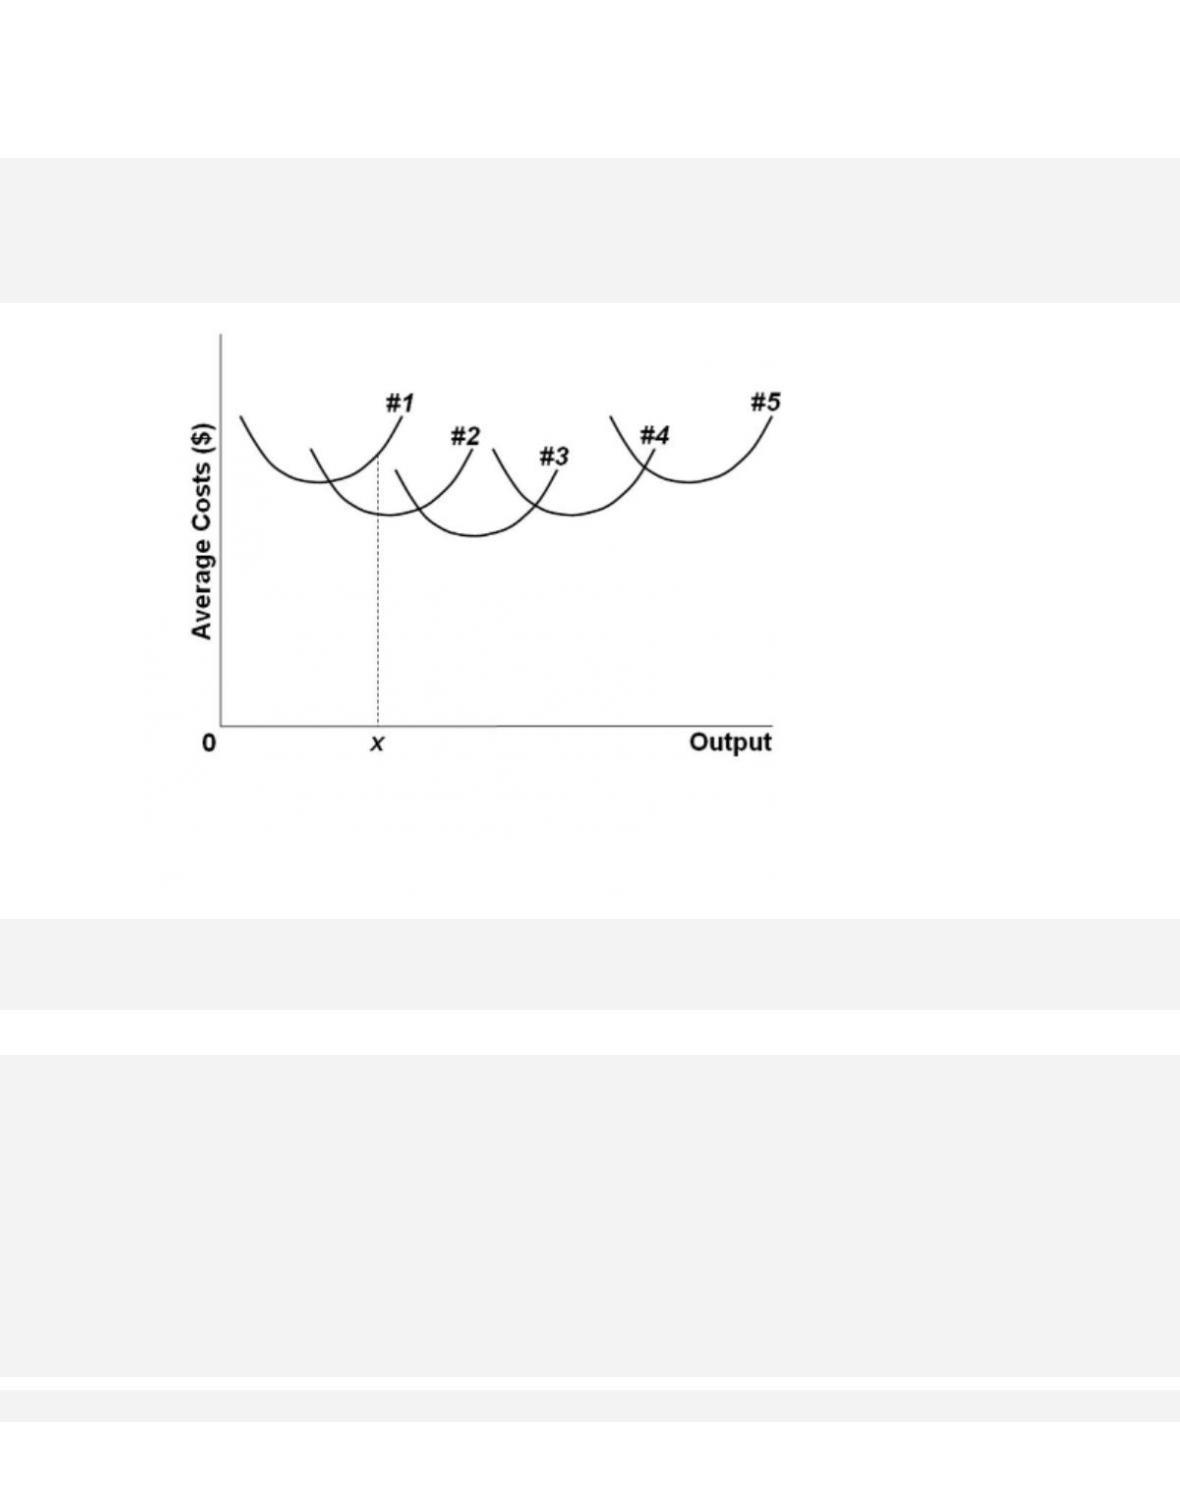
The diagram shows the short–run average total cost curves for five different plant sizes of a
firm. The shape of each individual curve reflects
148.
As the firm in the diagram expands from plant size #1 to plant size #3, it experiences
9-85
Copyright © 2018 McGraw-Hill Education. All rights reserved. No reproduction or distribution without the prior
written consent of McGraw-Hill Education.
Difficulty: 03 Hard
Learning Objective: 09–04 Use economies of scale to link a firms size and its average costs in
the long run.
Test Bank: I
Topic: Long-Run Production Costs
Type: Graph
149.
As the firm in the diagram expands from plant size #3 to plant size #5, it experiences

150.
The diagram shows the short-run average total cost curves for five different plant sizes of a
firm. The position of these five curves in relation to one another reflects
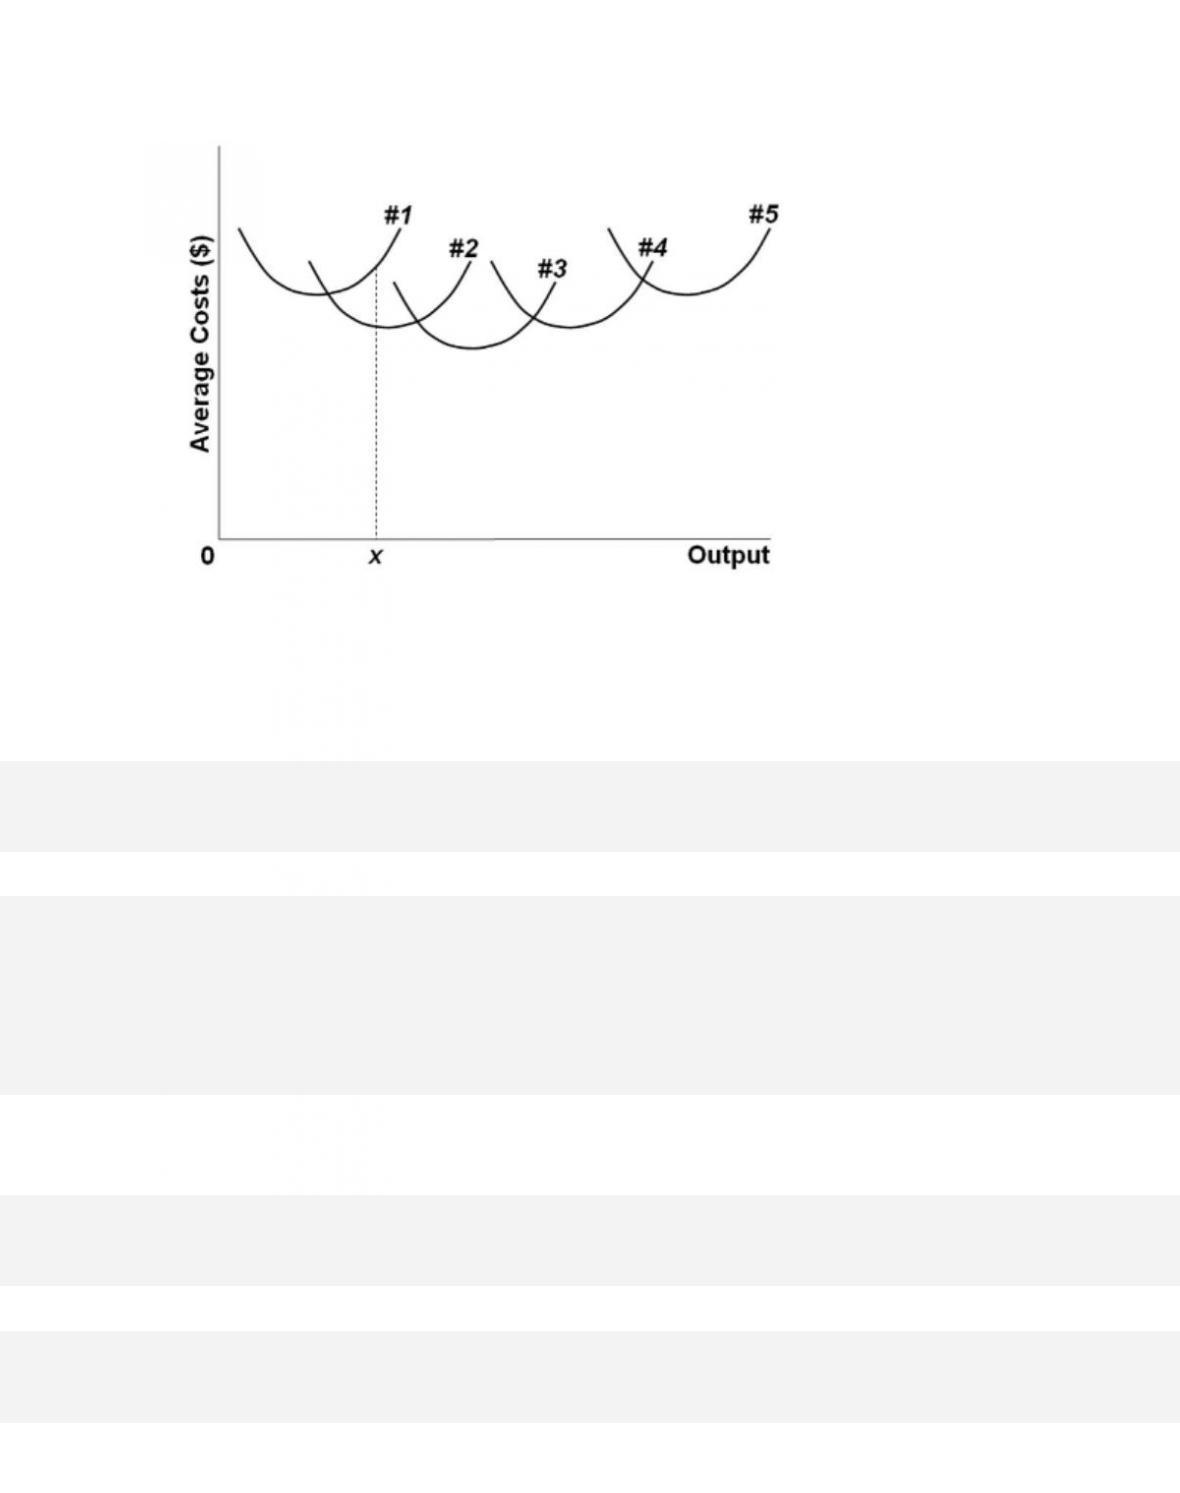
151.
The diagram shows the short-run average total cost curves for five different plant sizes of a
firm. If in the long run the firm should produce output 0x, it should do it with a plant of size
152. When diseconomies of scale occur,

9-88
Copyright © 2018 McGraw-Hill Education. All rights reserved. No reproduction or distribution without the prior
written consent of McGraw-Hill Education.
A c c e s s i b i l i t y : Keyboard Navigation
Blooms: Apply
Difficulty: 03 Hard
Learning Objective: 09–04 Use economies of scale to link a firms size and its average costs in
the long run.
Test Bank: I
Topic: Long-Run Production Costs
153. Which of the following is not a source of economies of scale?
154.
When a firm does more of something, it gets better at it. This learning-by-doing is
155.
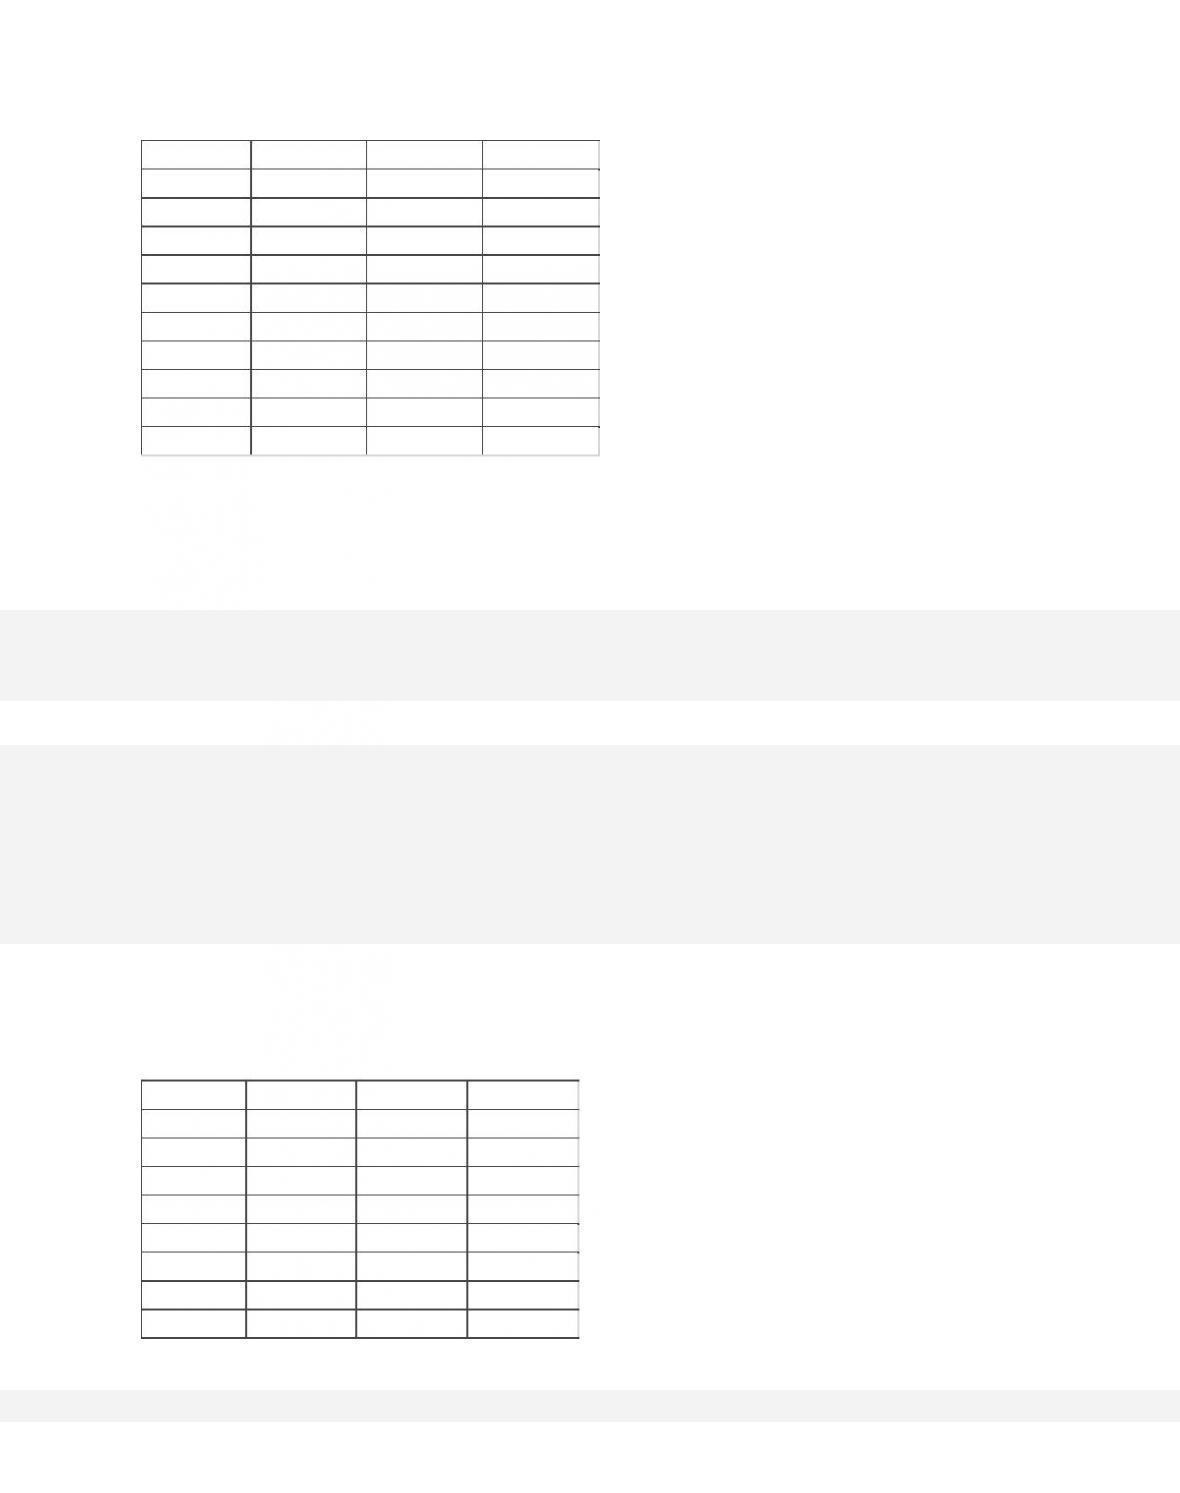
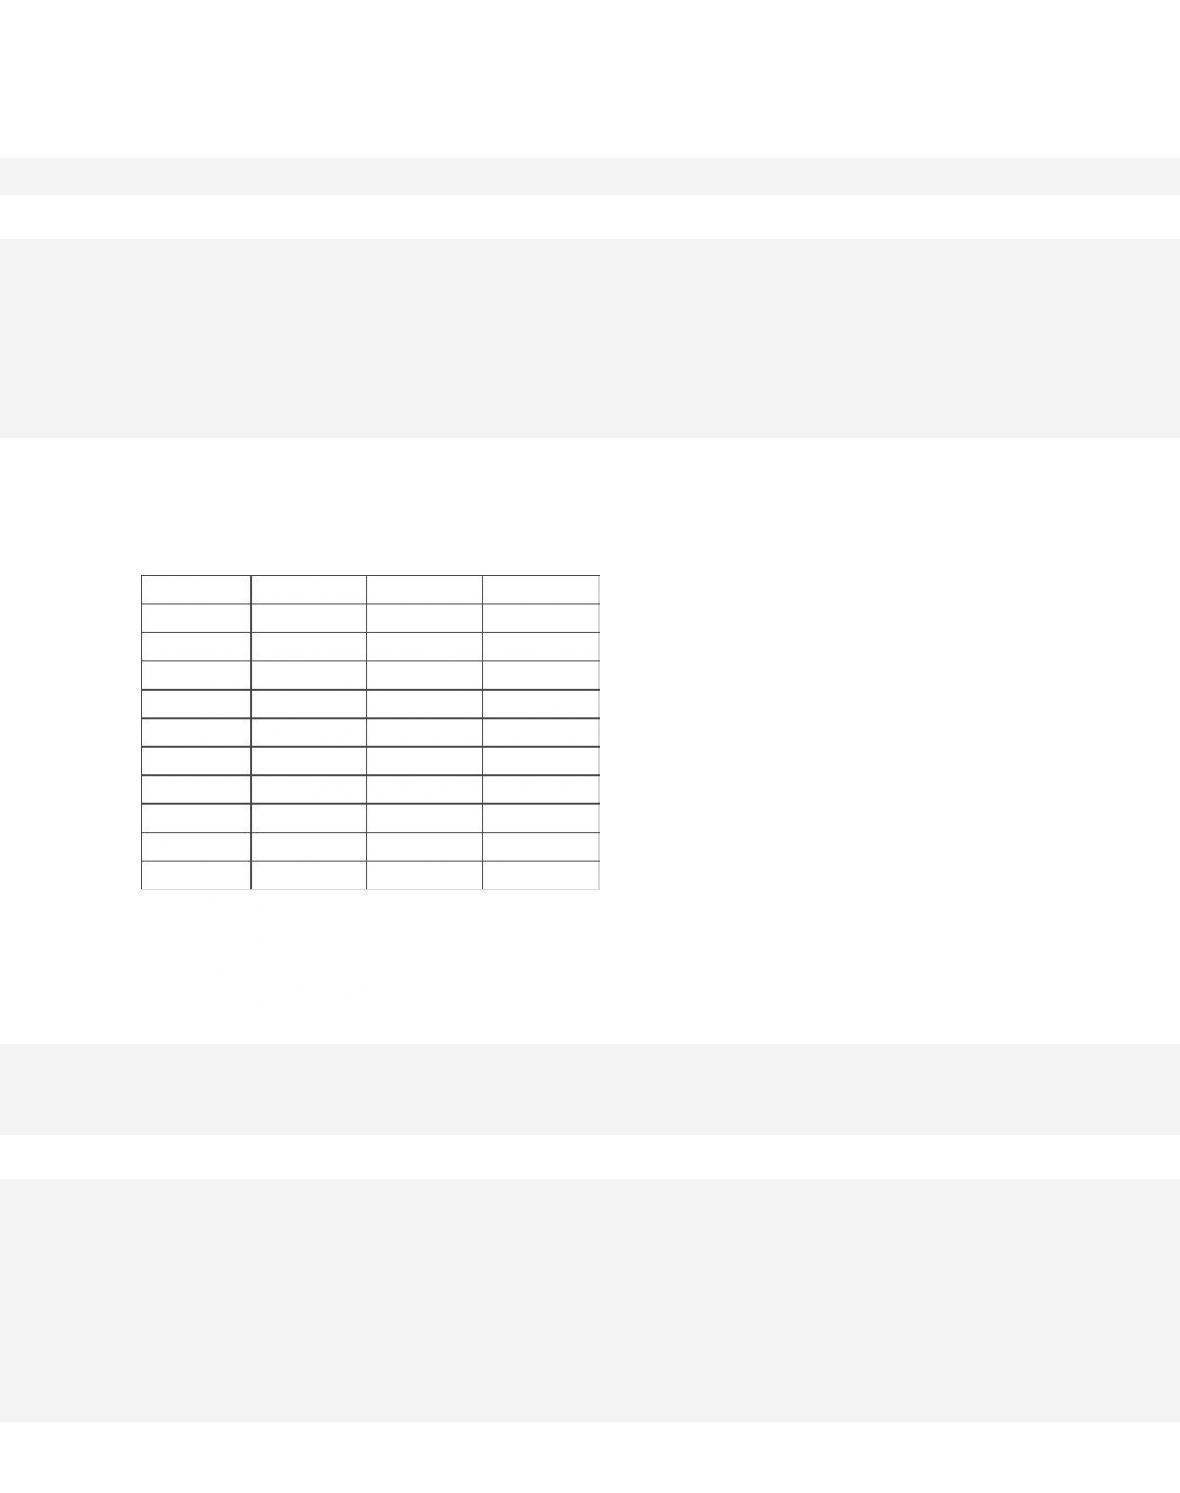
Use the following data to answer the question. The letters A, B, and C designate three
successively larger plant sizes.
9-89
Output
ATC-A
ATC-B
ATC-C
10
$6
$13
$44
20
5
9
35
30
4
6
27
40
5
4
20
50
7
3
14
60
10
4
11
70
14
5
8
80
19
7
6
90
25
10
5
100
32
16
7
In the long run, the firm should use plant size “A” for
156.
Use the following data to answer the question. The letters A, B, and C designate three
successively larger plant sizes.
Output
ATC-A
ATC-B
ATC-C
10
$6
$13
$44
20
5
9
35
30
4
6
27
40
5
4
20
50
7
3
14
60
10
4
11
70
14
5
8
80
19
7
6
90
25
10
5
100
32
16
7
In the long run, the firm should use plant size “C” for
157.
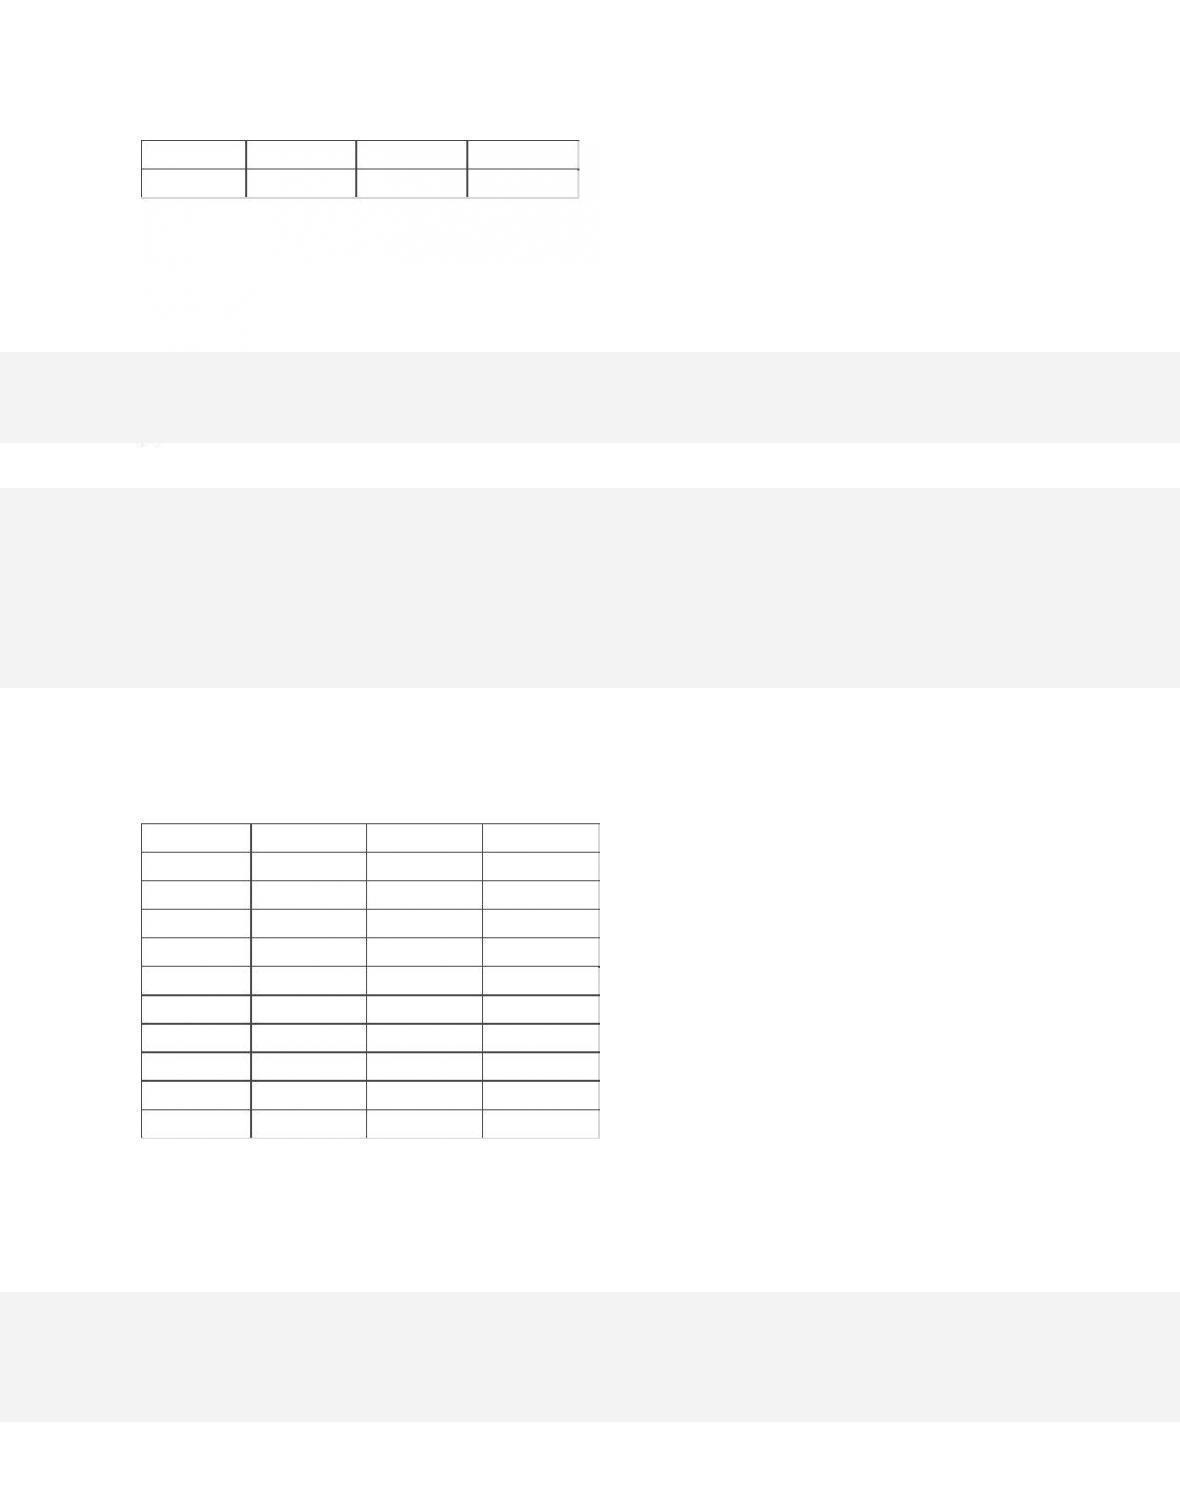
Use the following data to answer the question. The letters A, B, and C designate three
successively larger plant sizes.
Output
ATC-A
ATC-B
ATC-C
10
$6
$13
$44
20
5
9
35
30
4
6
27
40
5
4
20
50
7
3
14
60
10
4
11
70
14
5
8
80
19
7
6
90
25
10
5
100
32
16
7
Economies of scale in plant ATC-A are realized over the to levels of output;
diseconomies of scale exist over the to levels of output.
9-91
Copyright © 2018 McGraw-Hill Education. All rights reserved. No reproduction or distribution without the prior
written consent of McGraw-Hill Education.
C. 10, 50; 60, 100
D. 10, 70; 80, 100
158.
Use the following data to answer the question. The letters A, B, and C designate three
successively larger plant sizes.
Output
ATC-A
ATC-B
ATC-C
10
$6
$13
$44
20
5
9
35
30
4
6
27
40
5
4
20
50
7
3
14
60
10
4
11
70
14
5
8
80
19
7
6
90
25
10
5
100
32
16
7
At what level of output is minimum efficient scale realized?

9-92
Copyright © 2018 McGraw-Hill Education. All rights reserved. No reproduction or distribution without the prior
written consent of McGraw-Hill Education.
Topic: Long-Run Production Costs
Type: Table
159. Economies of scale are indicated by
160.
If a firm doubles its output in the long run and its unit costs of production decline, we can
conclude that
161.
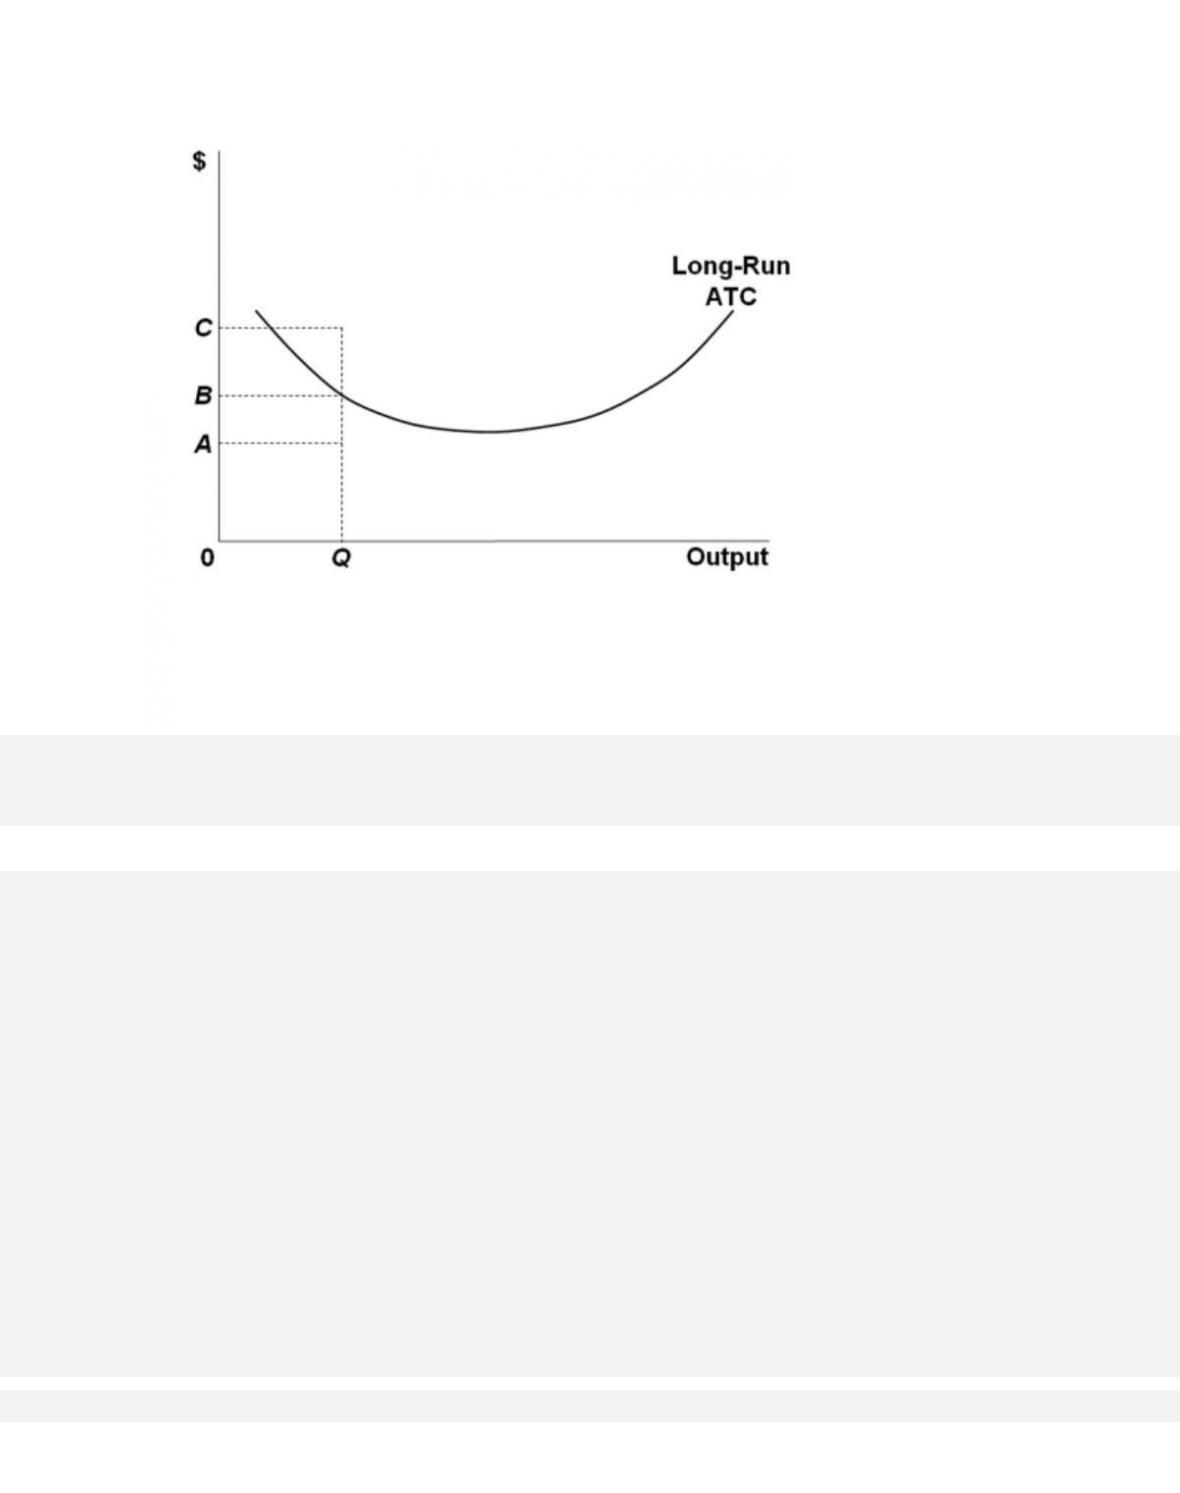
Refer to the diagram. For output level Q, per unit costs of C are
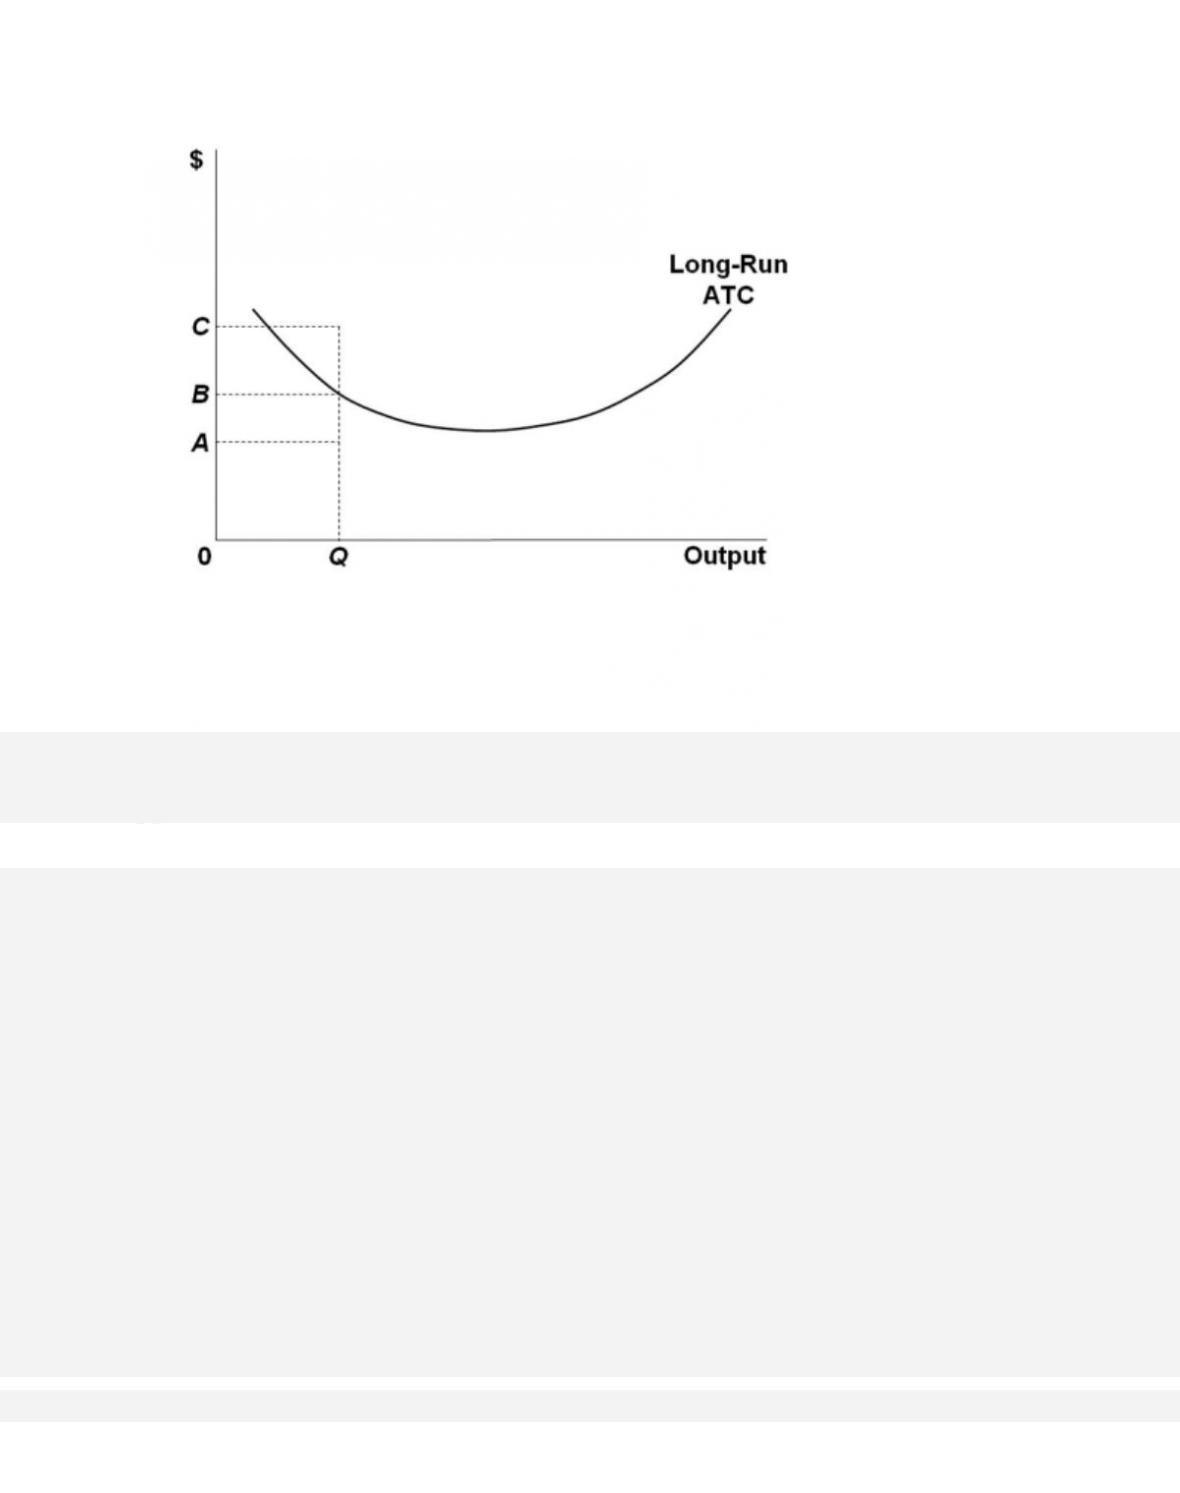
162.
Refer to the diagram. For output level Q, per unit costs of B are
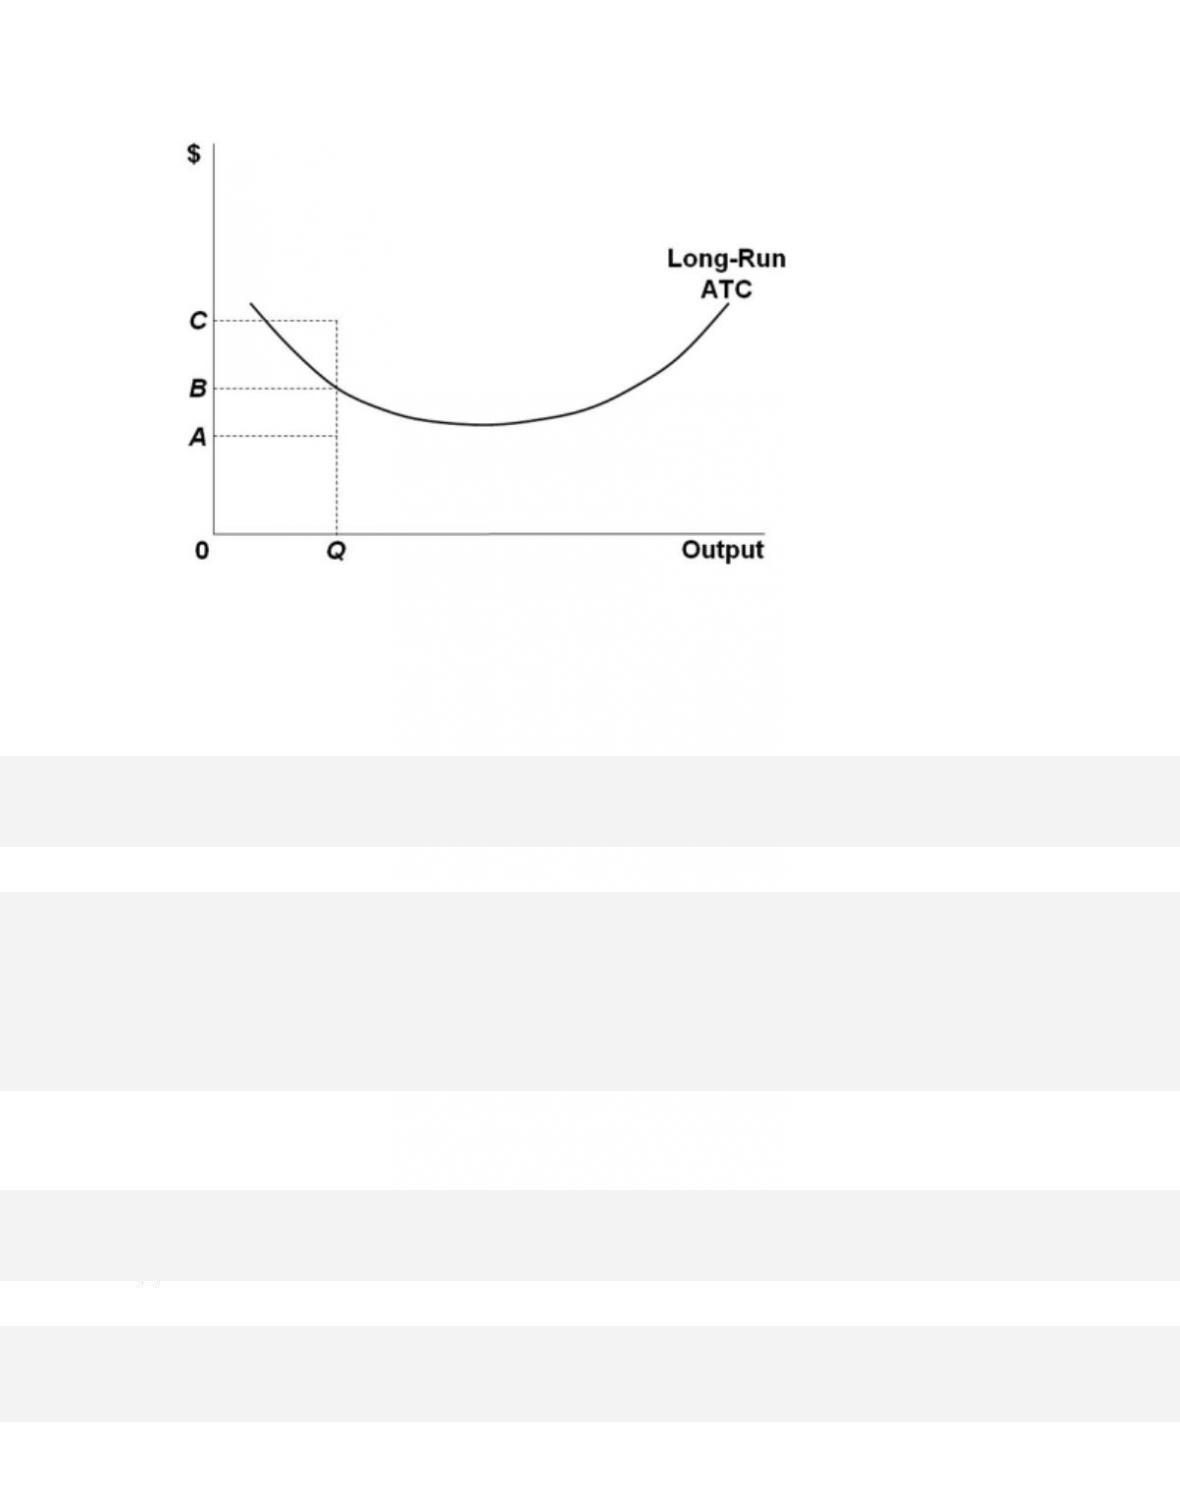
163.
Refer to the diagram. The per unit costs at output level Q that are both attainable and imply
the least-cost production for this level of output
164.
The minimum efficient scale of a firm

9-96
Copyright © 2018 McGraw-Hill Education. All rights reserved. No reproduction or distribution without the prior
written consent of McGraw-Hill Education.
A c c e s s i b i l i t y : Keyboard Navigation
Blooms: Apply
Difficulty: 03 Hard
Learning Objective: 09–04 Use economies of scale to link a firms size and its average costs in
the long run.
Test Bank: I
Topic: Long-Run Production Costs
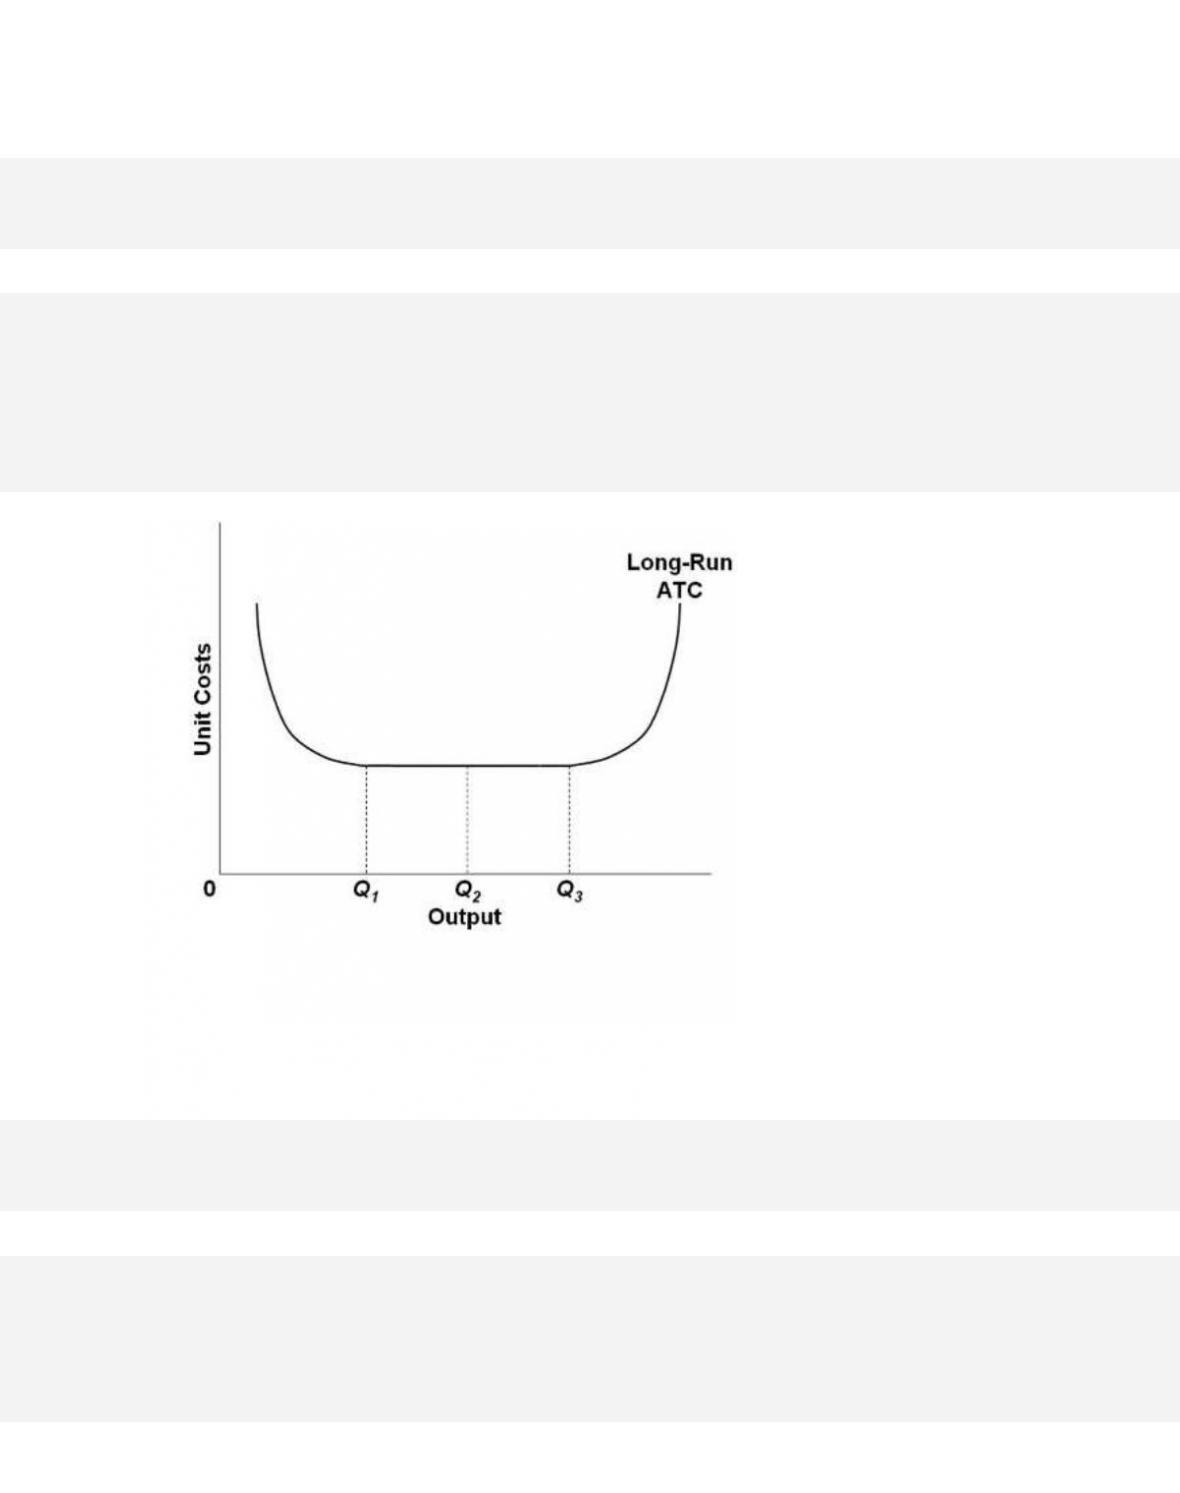
165.
If an industry’s long-run average total cost curve has an extended range of constant returns to
scale, this implies that
166.
A natural monopoly exists when
167.
Diseconomies of scale arise primarily because
9-97
Copyright © 2018 McGraw-Hill Education. All rights reserved. No reproduction or distribution without the prior
written consent of McGraw-Hill Education.
C.
firms must be large both absolutely and relative to the market to employ the most efficient
productive techniques available.
D.
beyond some point, marginal product declines as additional units of a variable resource
(labor) are added to a fixed resource (capital).
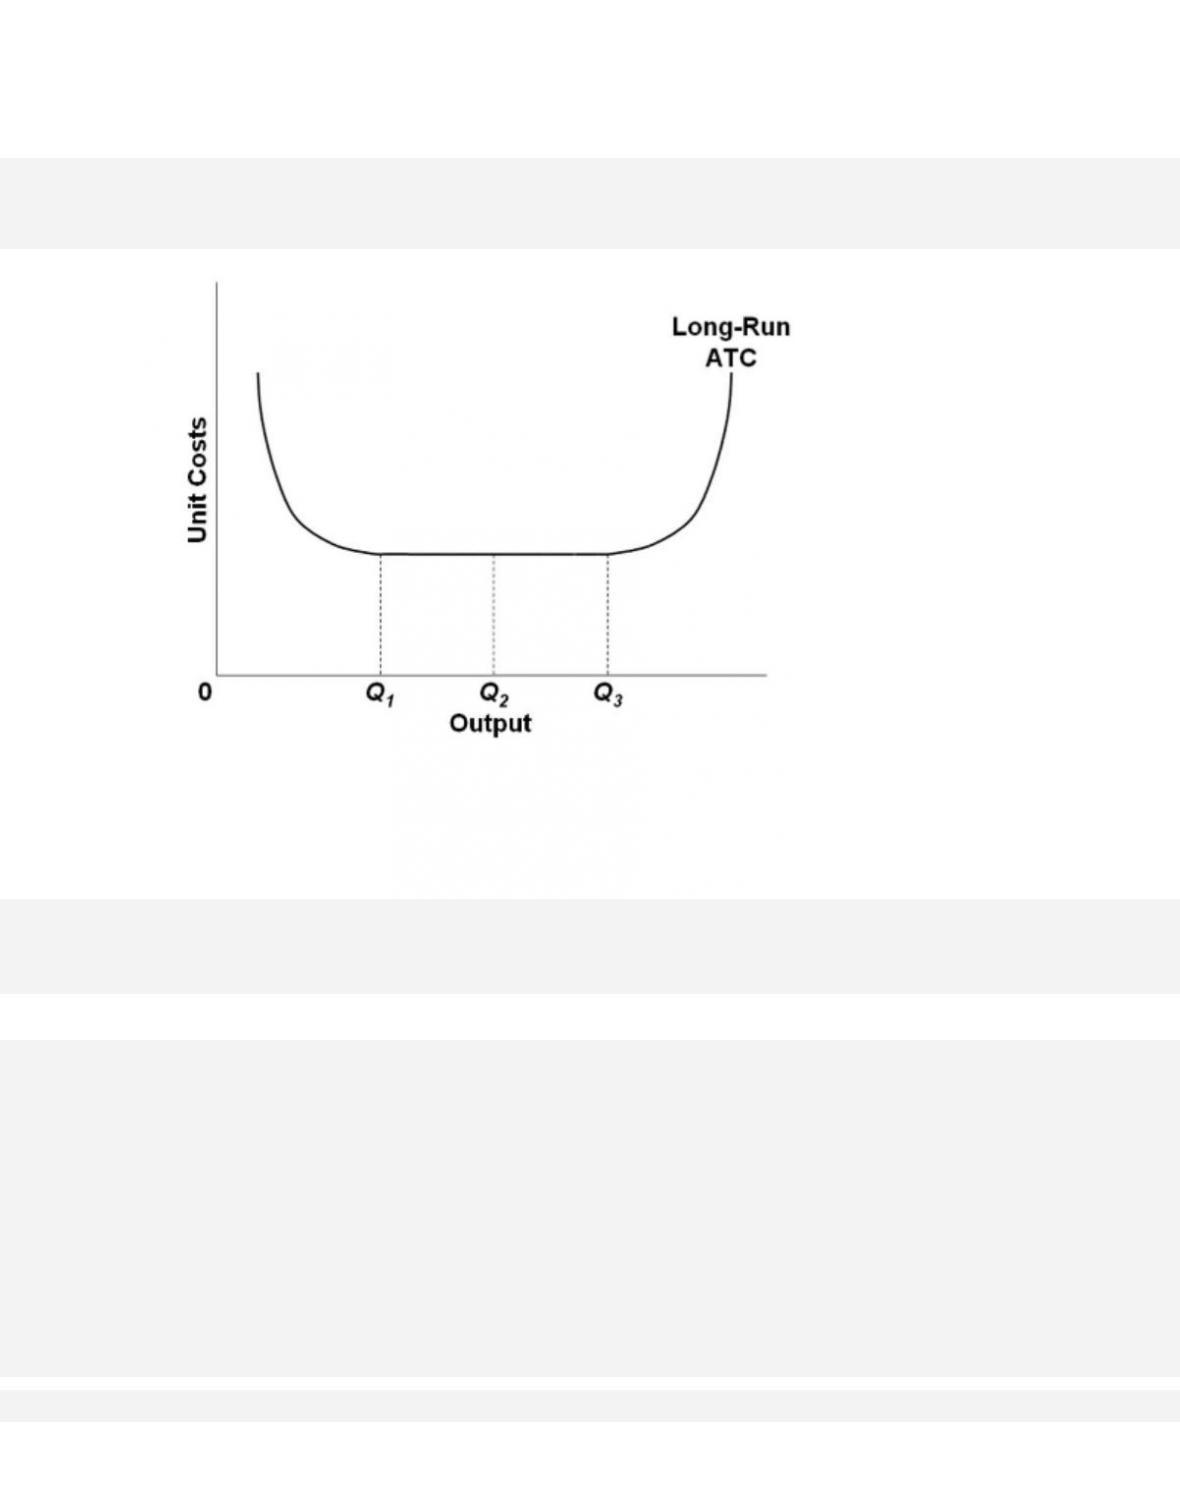
168.
In the diagram it is assumed that
9-98
Copyright © 2018 McGraw-Hill Education. All rights reserved. No reproduction or distribution without the prior
written consent of McGraw-Hill Education.
the long run.
Test Bank: I
Topic: Long-Run Production Costs
Type: Graph
169.
Refer to the diagram. Economies of scale
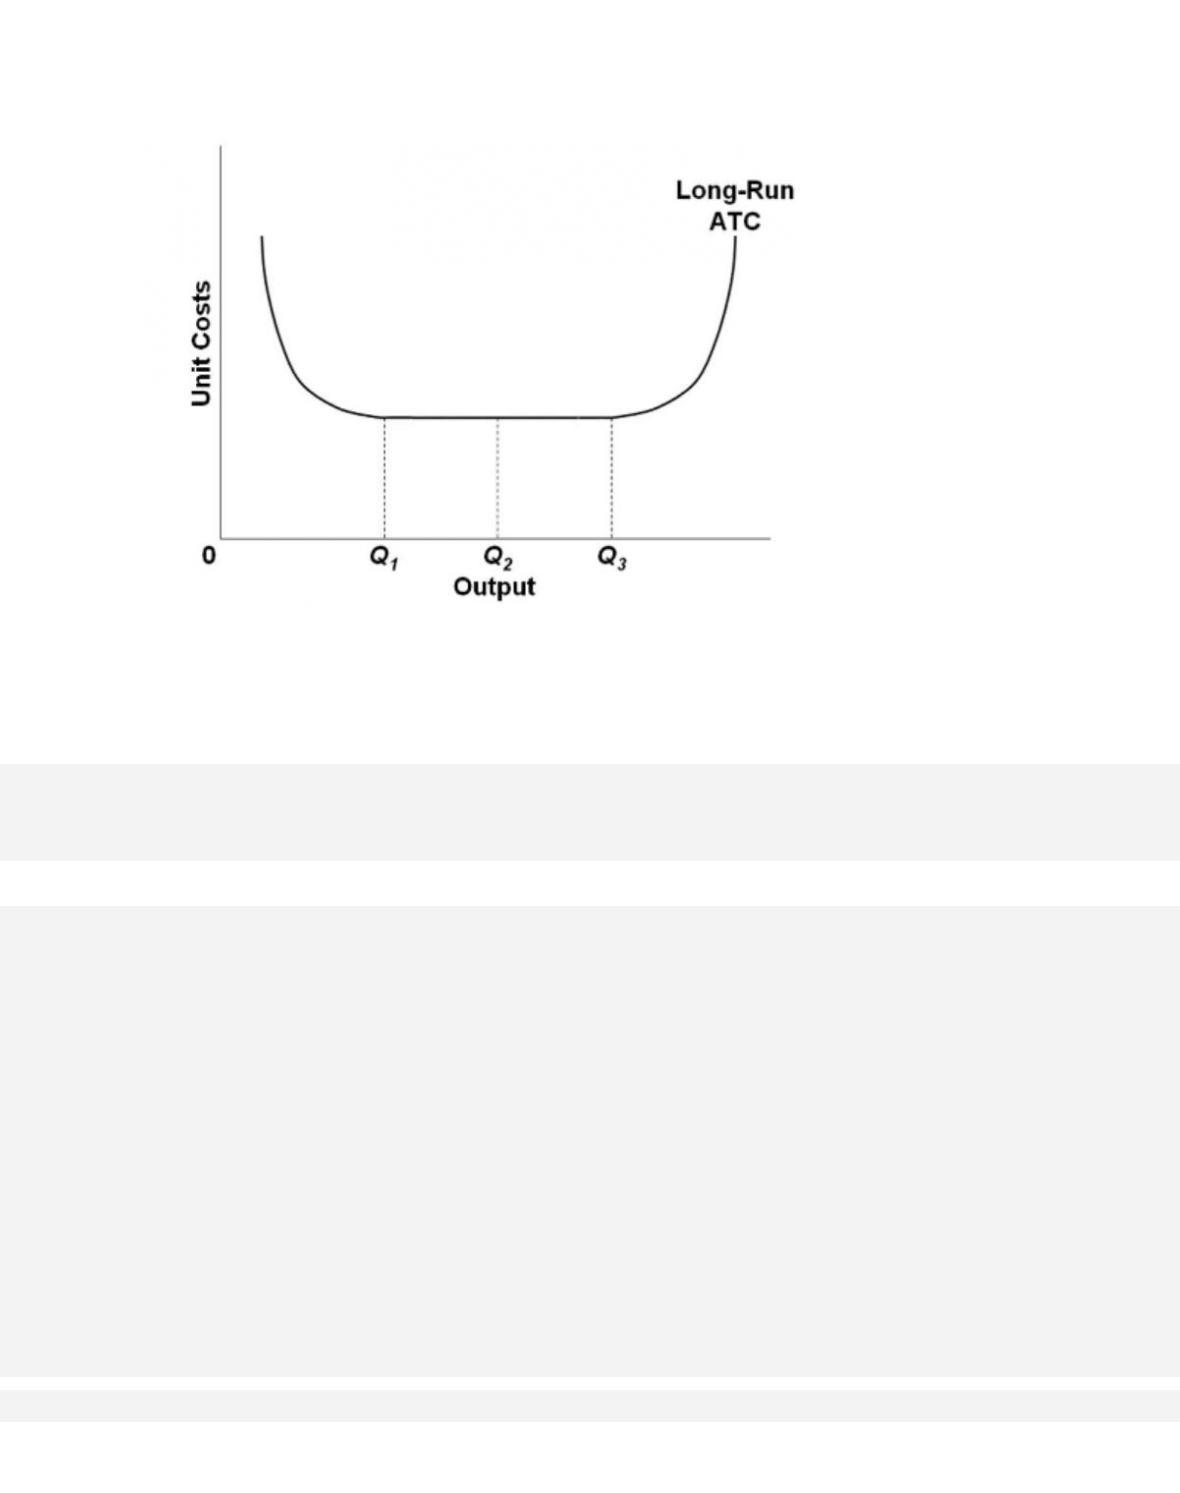
170.
Refer to the diagram. Diseconomies of scale

171.
Refer to the diagram. Minimum efficient scale