9-181
Copyright © 2018 McGraw-Hill Education. All rights reserved. No reproduction or distribution without the prior
written consent of McGraw-Hill Education.
Learning Objective: 09–04 Use economies of scale to link a firms size and its average costs in
the long run.
Test Bank: II
Topic: Long-Run Production Costs
334.
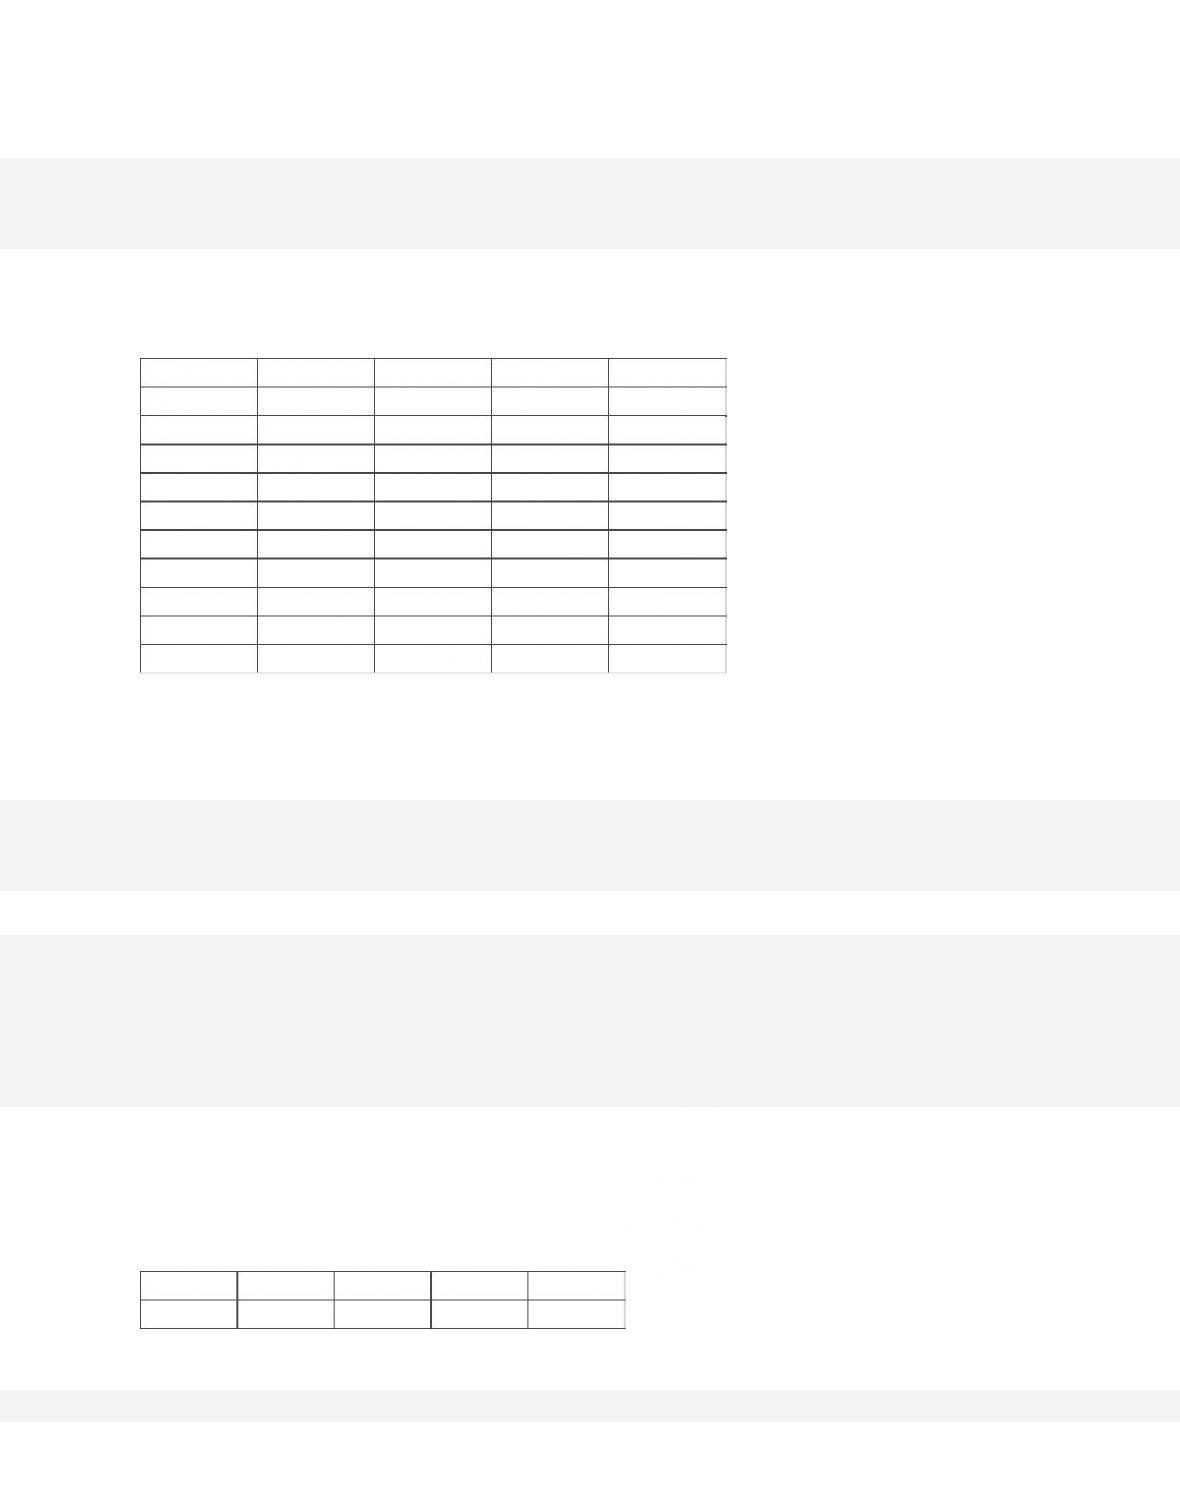
Plant sizes get larger as you move from ATC-1 to ATC–4.
Output
ATC-1
ATC-2
ATC-3
ATC-4
1,500
$10
15
$20
$30
2,000
8
12
17
25
2,500
9
10
15
20
3,000
12
8
13
18
3,500
15
6
11
16
4,000
18
10
9
14
4,500
20
12
7
12
5,000
24
15
11
10
5,500
29
19
13
8
6,000
35
25
15
9
Which plant size would produce at the least cost for the 3,000–4,000 range of output?
335.
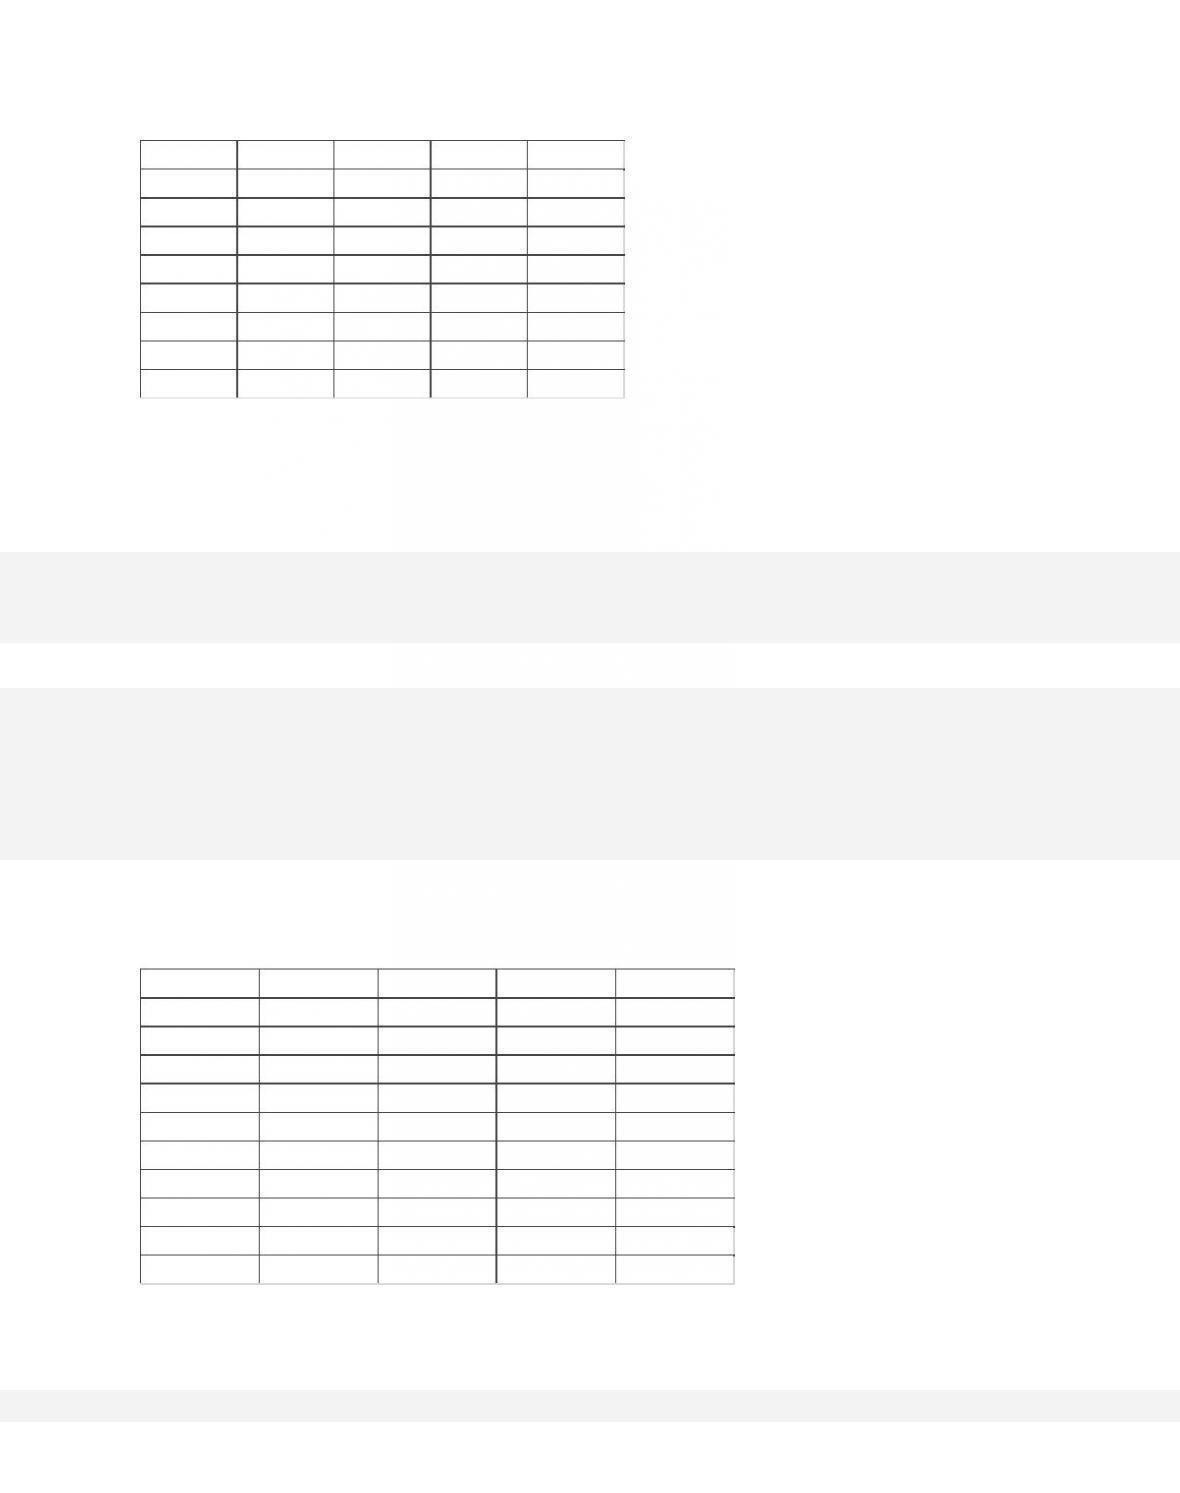
Plant sizes get larger as you move from ATC-1 to ATC–4.
Output
ATC-1
ATC-2
ATC-3
ATC-4
1,500
$10
15
$20
$30
9-182
2,000
8
12
17
25
2,500
9
10
15
20
3,000
12
8
13
18
3,500
15
6
11
16
4,000
18
10
9
14
4,500
20
12
7
12
5,000
24
15
11
10
5,500
29
19
13
8
6,000
35
25
15
9
In the long run, the firm should use plant size ATC-3 for what level of output?
336.
Plant sizes get larger as you move from ATC-1 to ATC–4.
Output
ATC-1
ATC-2
ATC-3
ATC-4
1,500
$10
15
$20
$30
2,000
8
12
17
25
2,500
9
10
15
20
3,000
12
8
13
18
3,500
15
6
11
16
4,000
18
10
9
14
4,500
20
12
7
12
5,000
24
15
11
10
5,500
29
19
13
8
6,000
35
25
15
9
Over what range of output are economies of scale experienced by this firm?
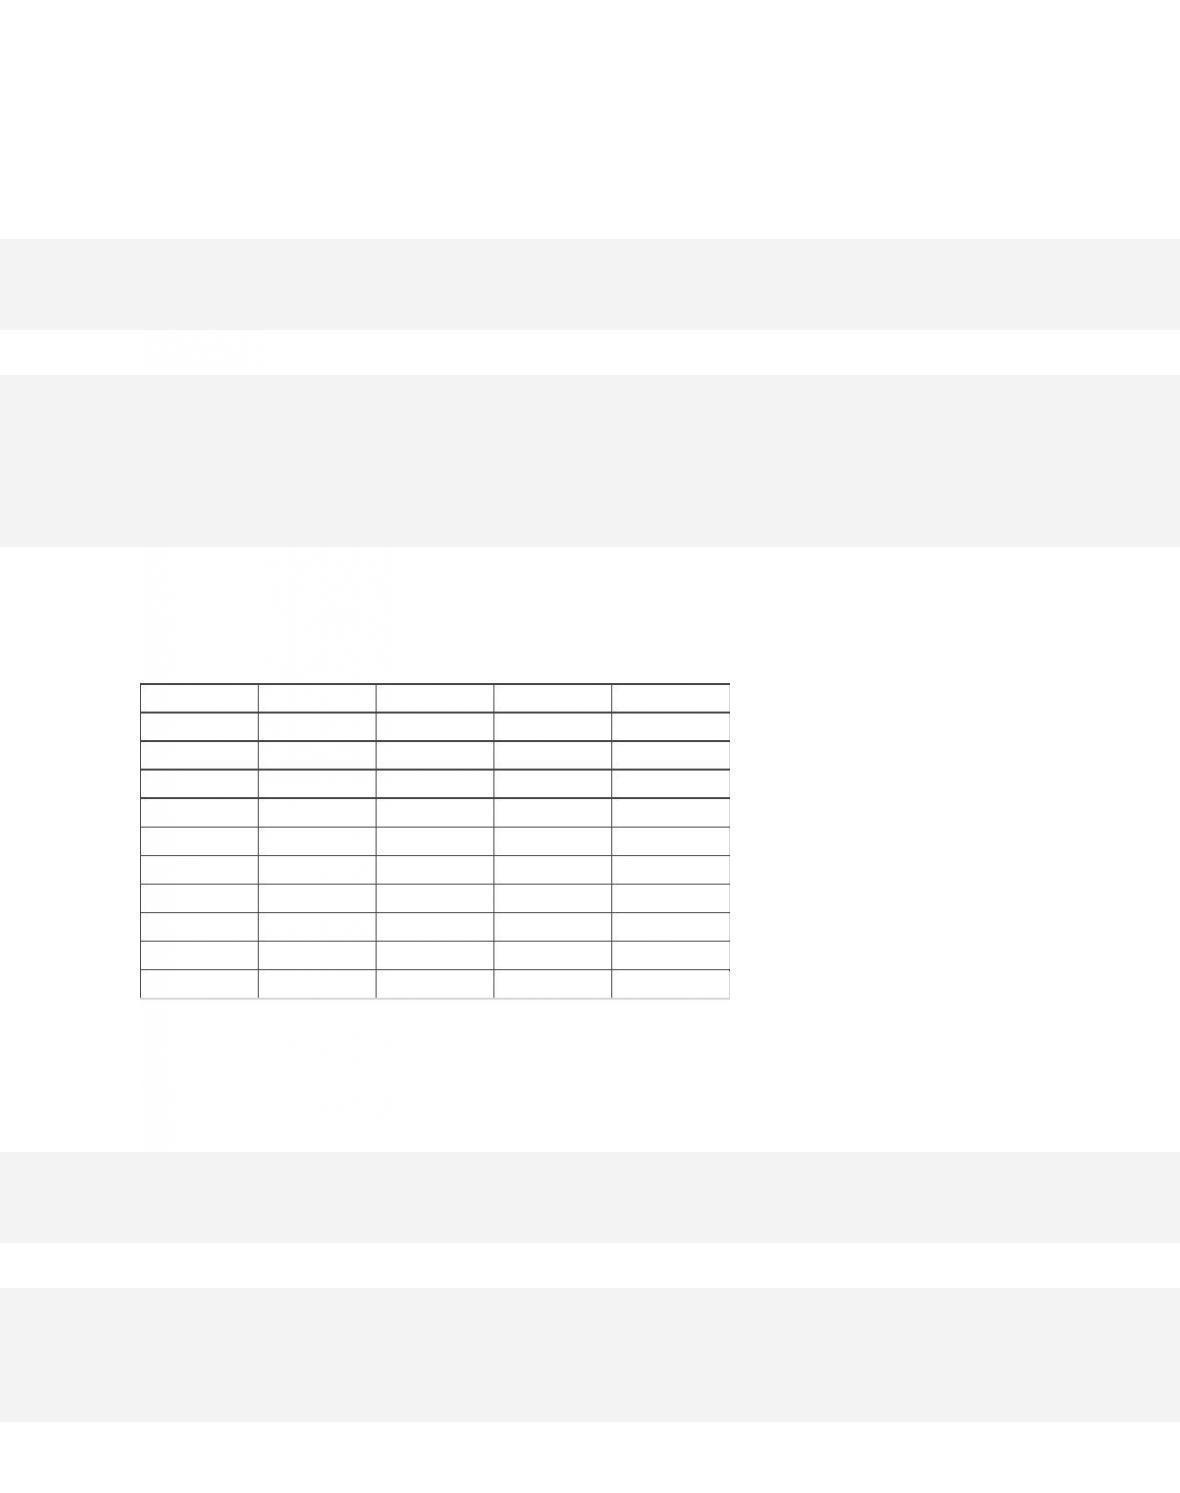
337.
Plant sizes get larger as you move from ATC-1 to ATC–4.
Output
ATC-1
ATC-2
ATC-3
ATC-4
1,500
$10
15
$20
$30
2,000
8
12
17
25
2,500
9
10
15
20
3,000
12
8
13
18
3,500
15
6
11
16
4,000
18
10
9
14
4,500
20
12
7
12
5,000
24
15
11
10
5,500
29
19
13
8
6,000
35
25
15
9
The firm’s minimum efficient scale is at what output level?
9-184
Copyright © 2018 McGraw-Hill Education. All rights reserved. No reproduction or distribution without the prior
written consent of McGraw-Hill Education.
Di f f i c ul t y : 03 Hard
Learning Objective: 09–04 Use economies of scale to link a firms size and its average costs in
the long run.
Test Bank: II
Topic: Long-Run Production Costs
338. A given level of consumer demand will support a large number of producers in an
industry if
339.
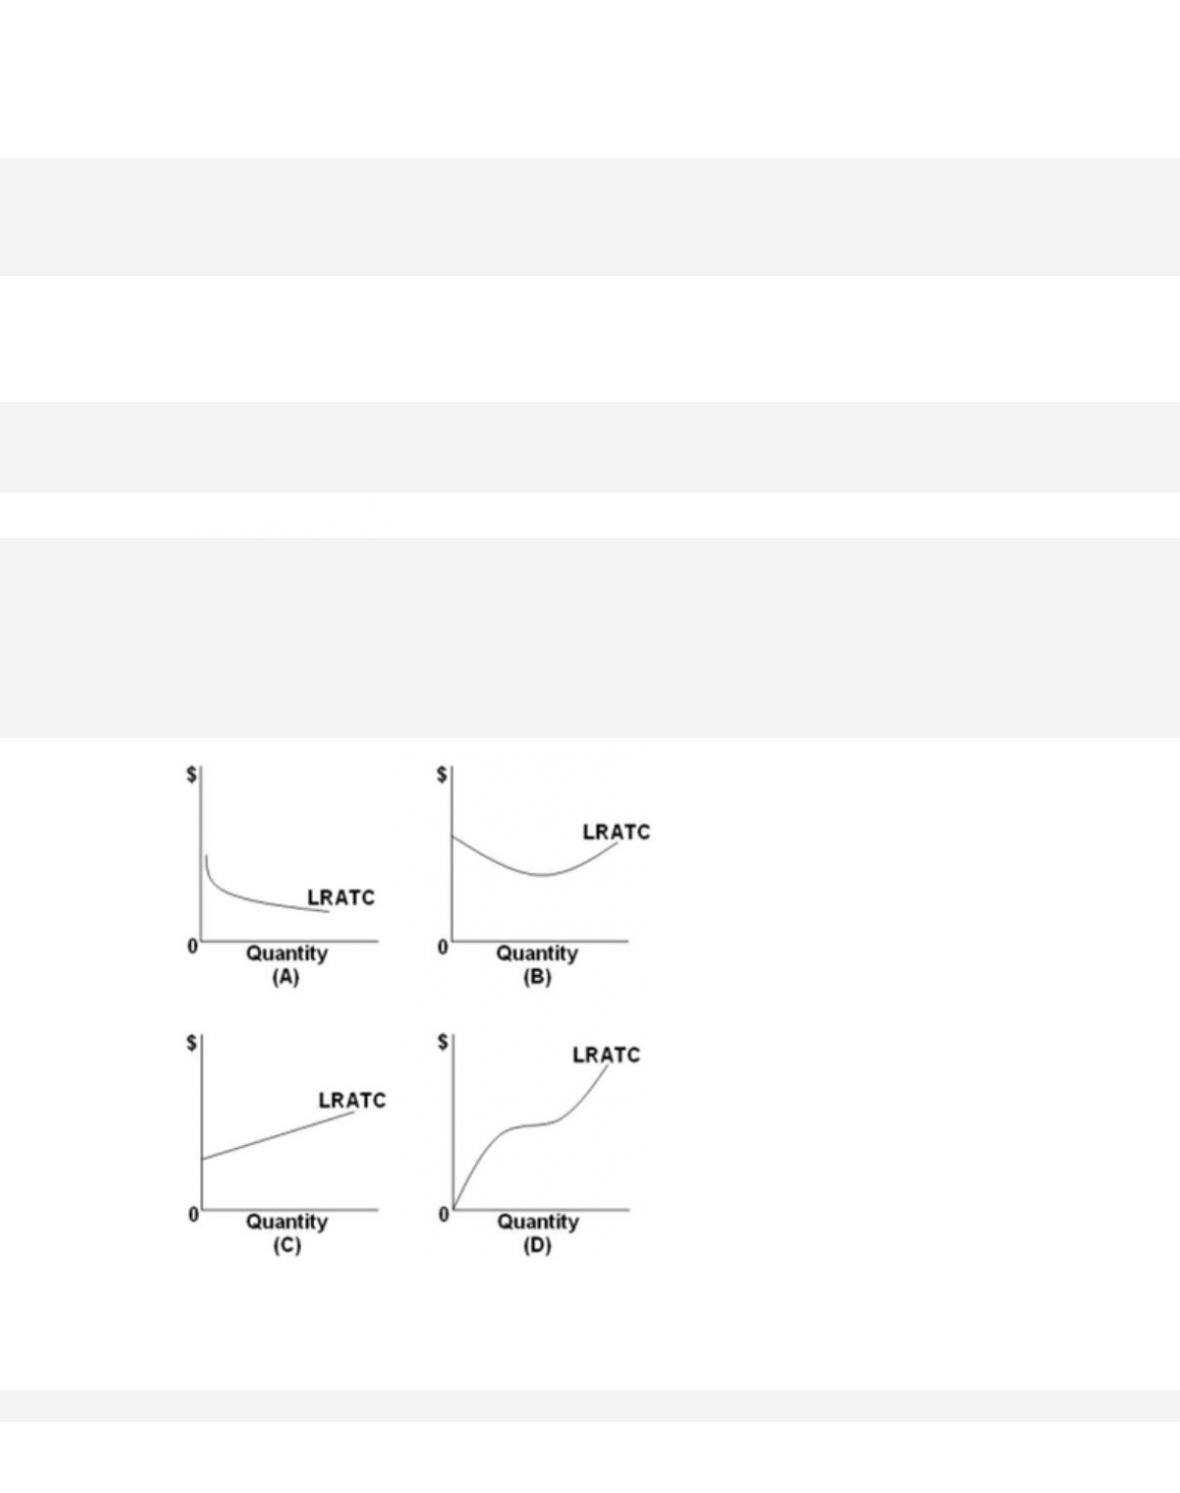
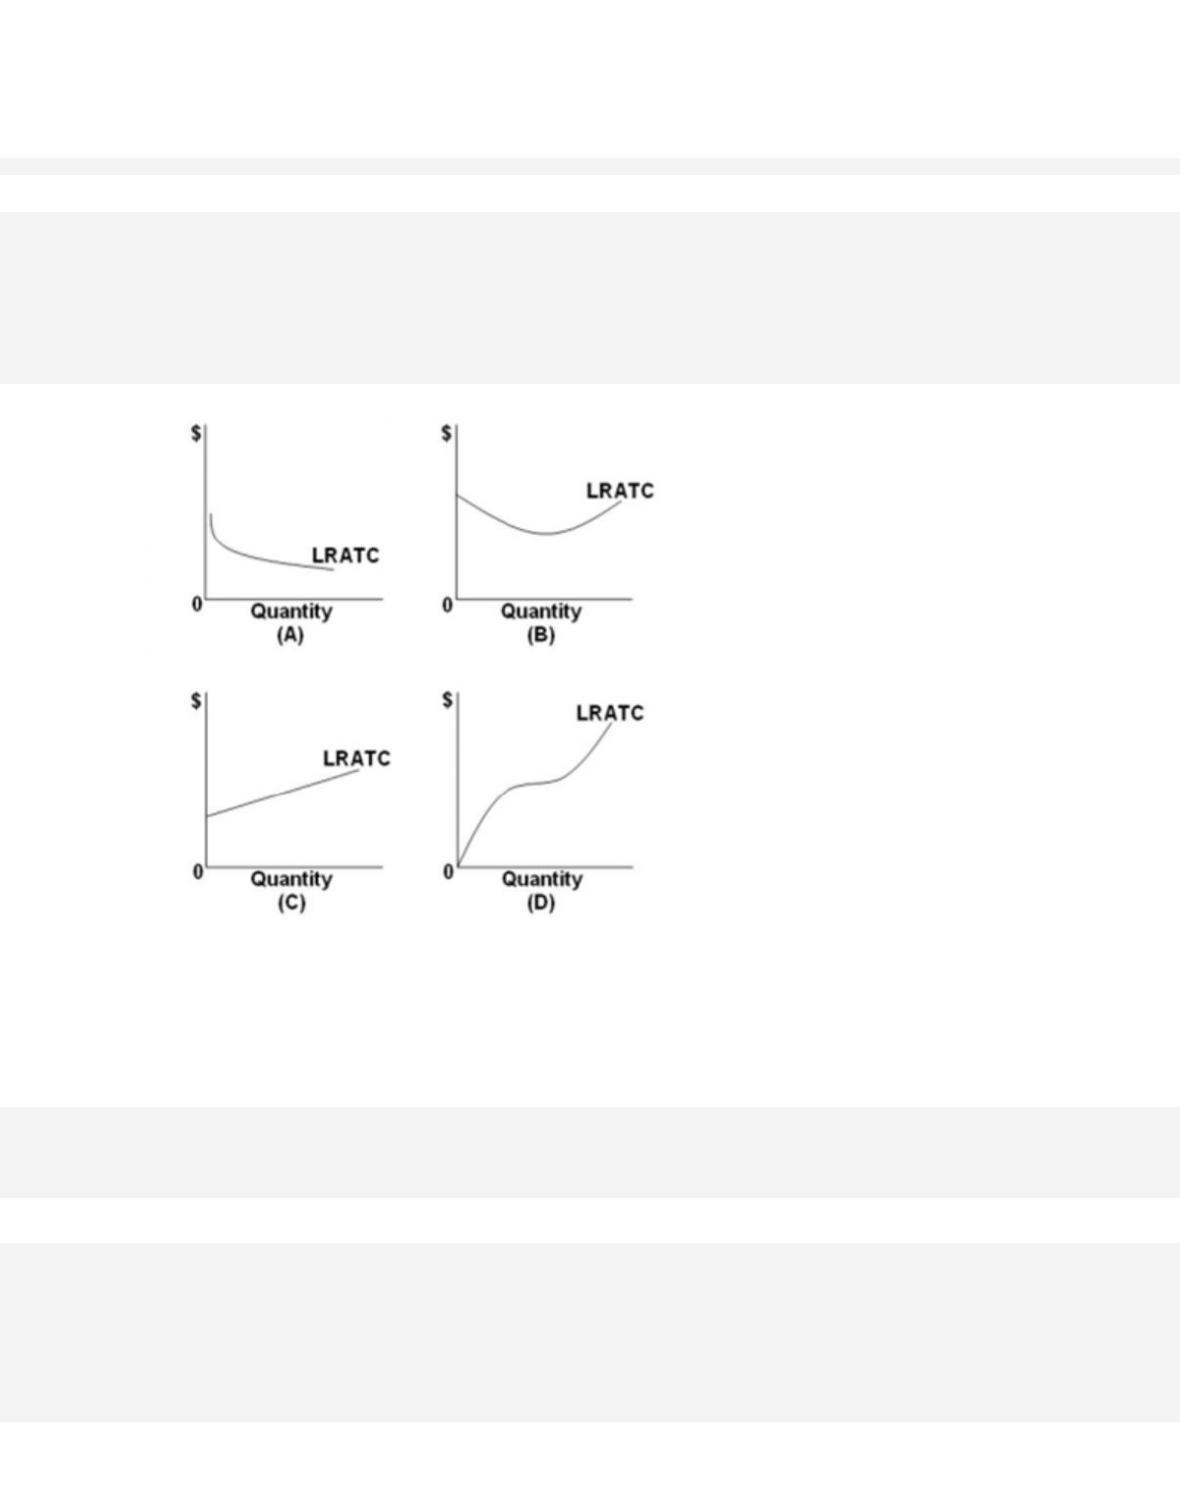
Refer to the provided graphs. They show the long-run average total cost (LRATC) for a product.
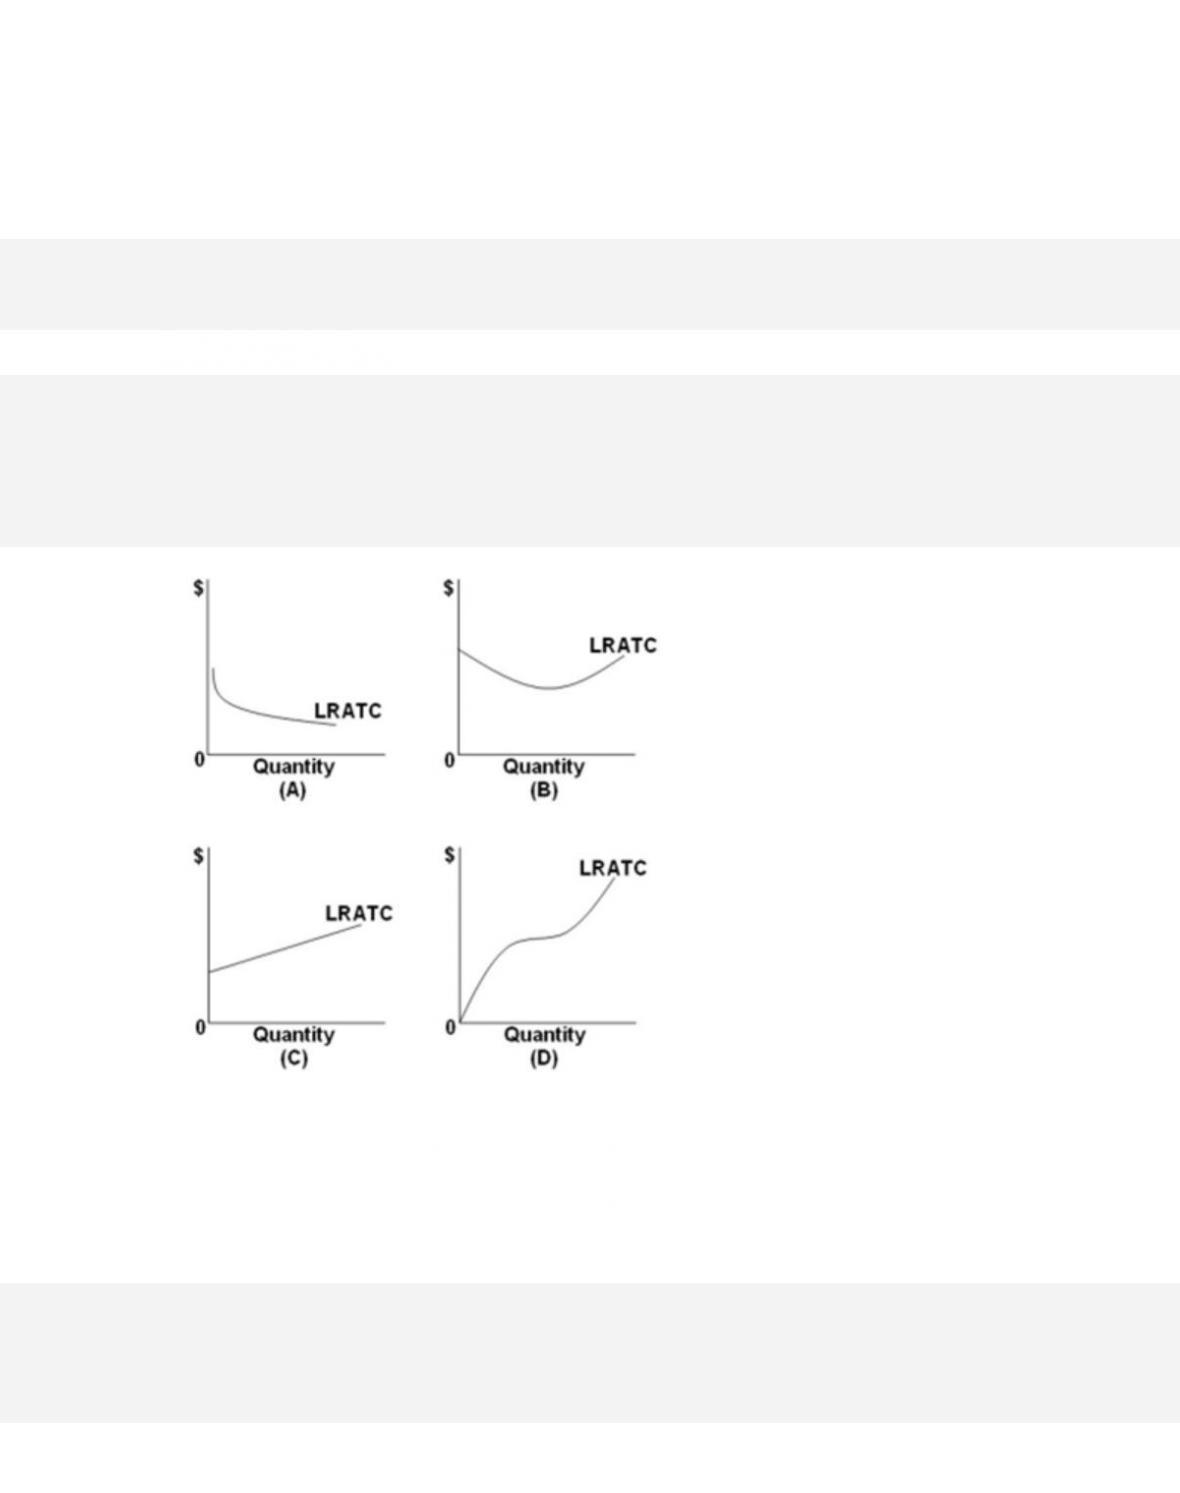
For which graph would a firm not be experiencing diseconomies of scale?
340.
Refer to the provided graphs. They show the long-run average total cost (LRATC) for a
product. For which graph would a firm experience first economies and then diseconomies
of scale over its range of output?
9-186
Copyright © 2018 McGraw-Hill Education. All rights reserved. No reproduction or distribution without the prior
written consent of McGraw-Hill Education.
D. graph D
341.
Refer to the provided graphs. They show the long-run average total cost (LRATC) for a product.
Which graph would most probably be applicable to a natural monopoly?

9-187
Copyright © 2018 McGraw-Hill Education. All rights reserved. No reproduction or distribution without the prior
written consent of McGraw-Hill Education.
the long run.
Test Bank: II
Topic: Long-Run Production Costs
342.
The following schedule gives the cost data for a firm.
Total
Product
Long-Run Total
Cost
10
$200
20
300
30
450
40
600
50
1,000
Diseconomies of scale start between
343. Diseconomies of scale occur mainly because

9-188
Copyright © 2018 McGraw-Hill Education. All rights reserved. No reproduction or distribution without the prior
written consent of McGraw-Hill Education.
Di f f i c ul t y : 03 Hard
Learning Objective: 09–04 Use economies of scale to link a firms size and its average costs in
the long run.
Test Bank: II
Topic: Long-Run Production Costs
344.
Which of the following statements is not correct?
345. A natural monopoly is characterized by
346.
The following table shows the short-run total cost data for a firm.

Output
Total Cost
0
$ 80
1
160
2
240
3
320
4
400
5
480
6
560
All of the following are correct, except that the firm has
347.
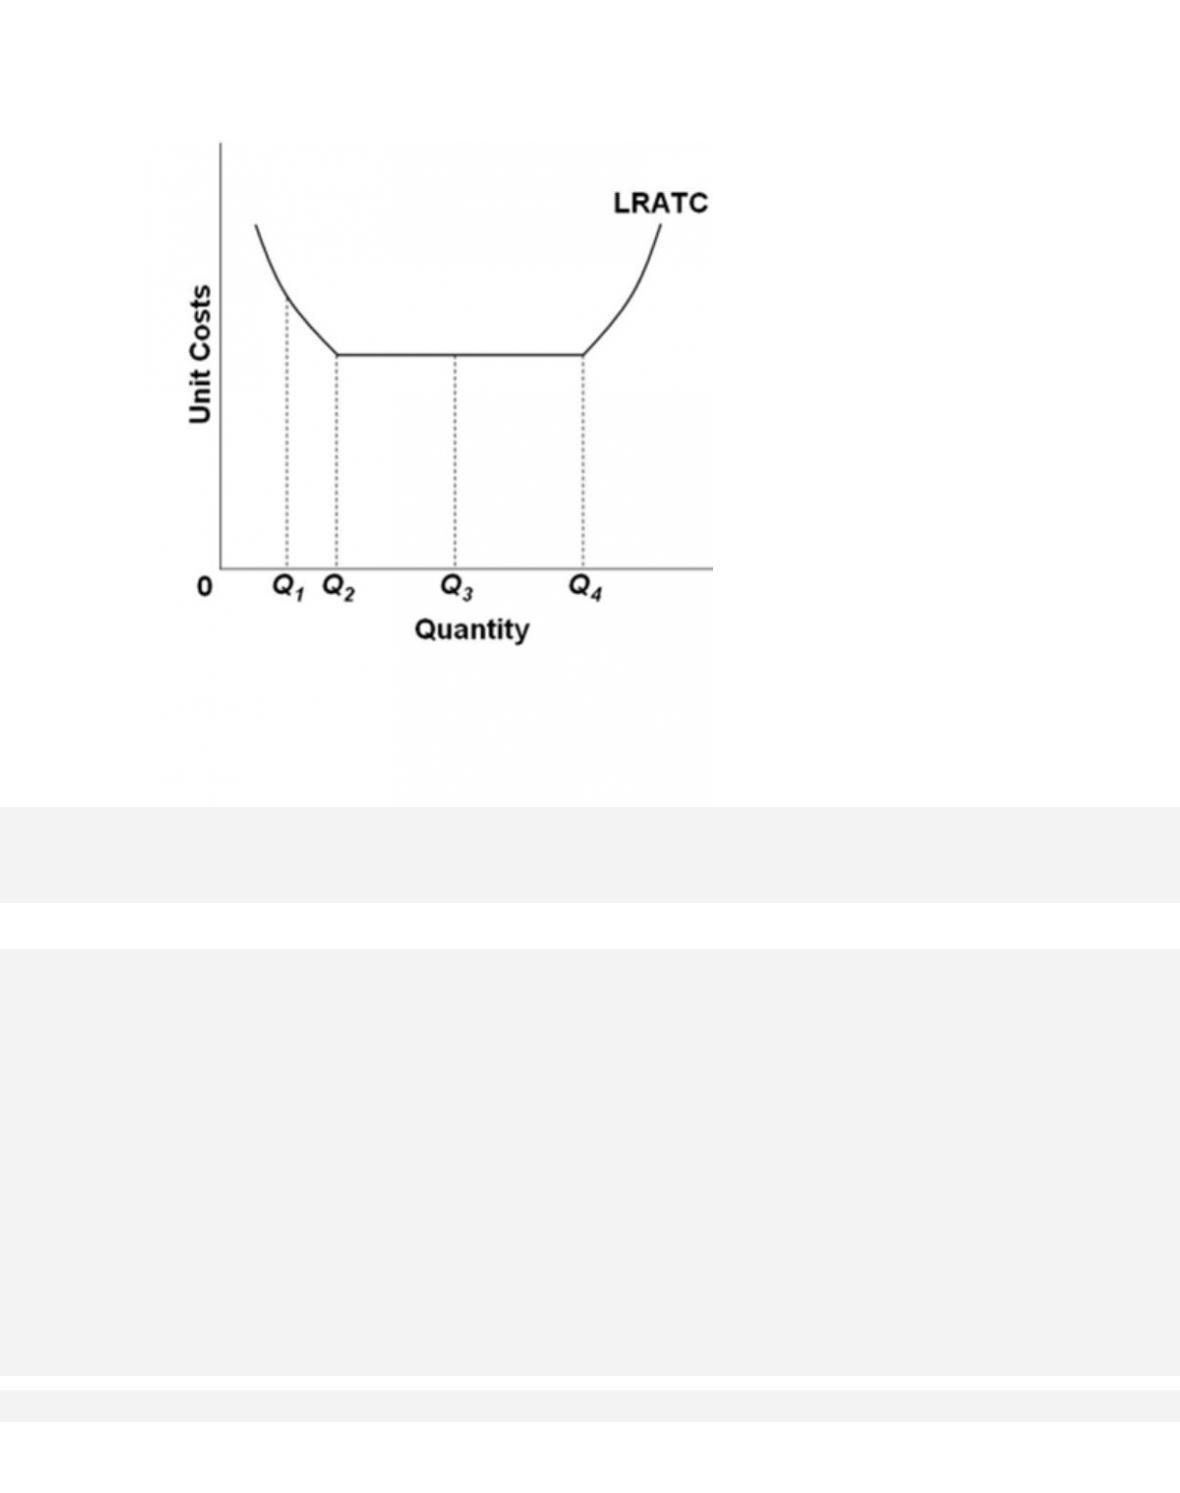
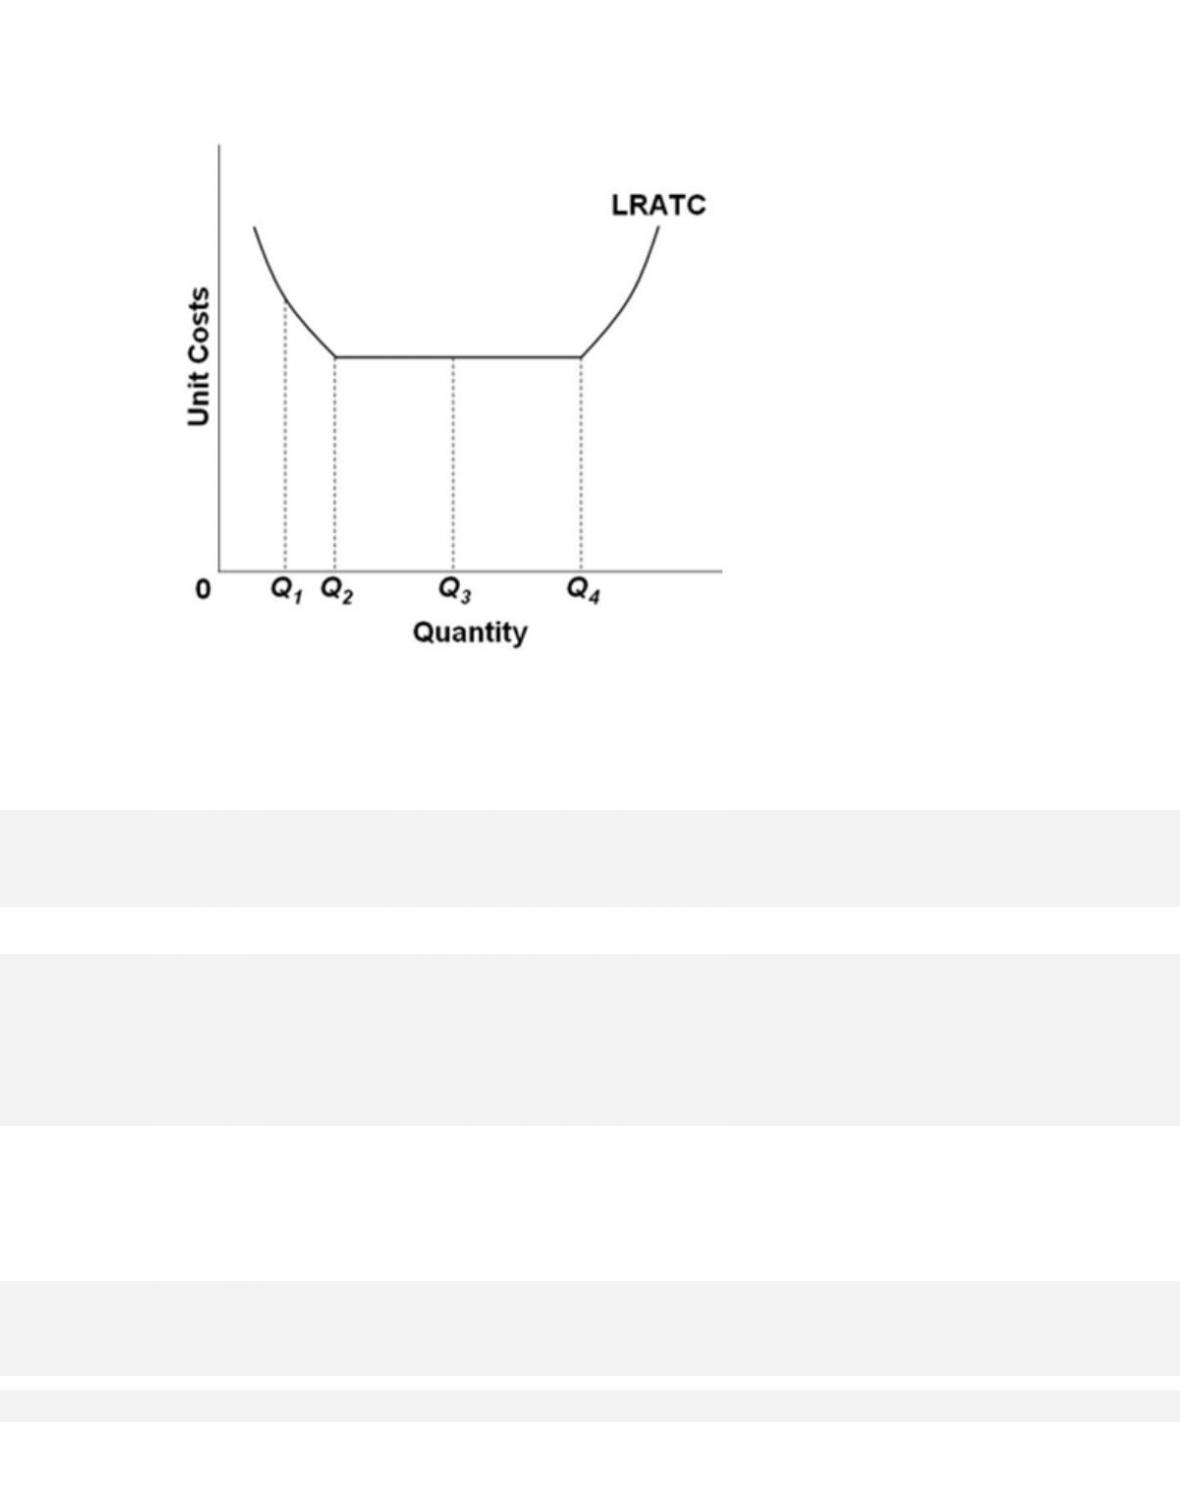
Refer to the provided graph. There are economies of scale

348.
Refer to the provided graph. There are diseconomies of scale
349.
Refer to the provided graph. Minimum efficient scale occurs at
350. If there are 10 plants producing the total domestic consumption of a product and each
plant is operating at minimum efficient scale, then each plant accounts for what percentage
of domestic consumption?