
7-141
A. income or budget
269. The marginal rate of substitution of beef for chicken is the
D. rate at which units of beef may be exchanged for units of chicken in the market.
270. The table shows an indifference schedule for several combinations of X and Y.
Combina
tion
Quantity of
X
Quantity of
Y
a
20
1
b
16
2
c
12
3
d
10
4
e
9
5

How much of X is the consumer willing to give up to obtain the fourth unit of Y?
A. 6
271. The table shows an indifference schedule for several combinations of X and Y.
Combina
tion
Quantity of
X
Quantity of
Y
a
20
1
b
16
2
c
12
3
d
10
4
e
9
5
In moving from combination b to c, the consumer
A. gets 1 unit of X for 1 unit of Y.

7-143
Copyright © 2018 McGraw-Hill Education. All rights reserved. No reproduction or distribution without the prior
written consent of McGraw-Hill Education.
Test Bank: II
To pi c:
Indifference Curve Analysis
272. The table shows an indifference schedule for several combinations of X and Y.
Combinat
ion
Quantity of
X
Quantity of
Y
a
20
1
b
16
2
c
12
3
d
10
4
e
9
5
In moving from combination a to b, then to c, d, and e, the marginal rate of substitution of X for
Y
273.
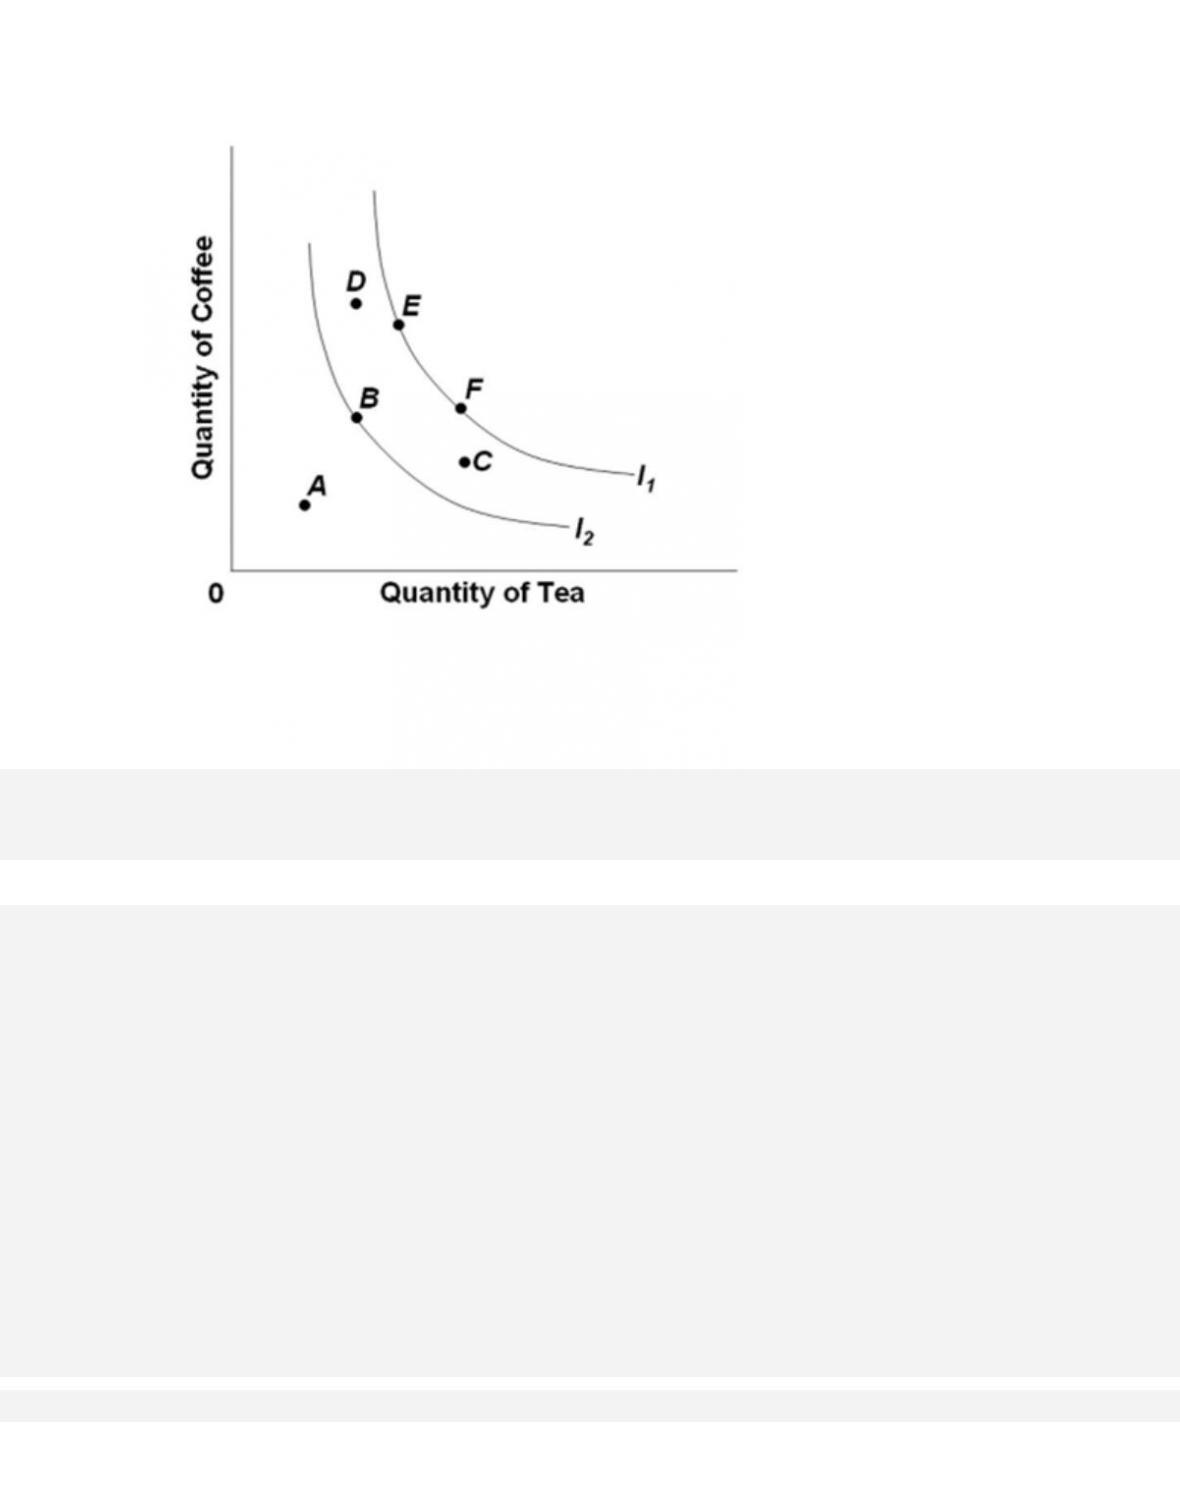
The graph shows part of a consumer’s indifference map for units of coffee and tea, where I1 and
I2 represent indifference curves. Which of the following statements is correct?
7-145
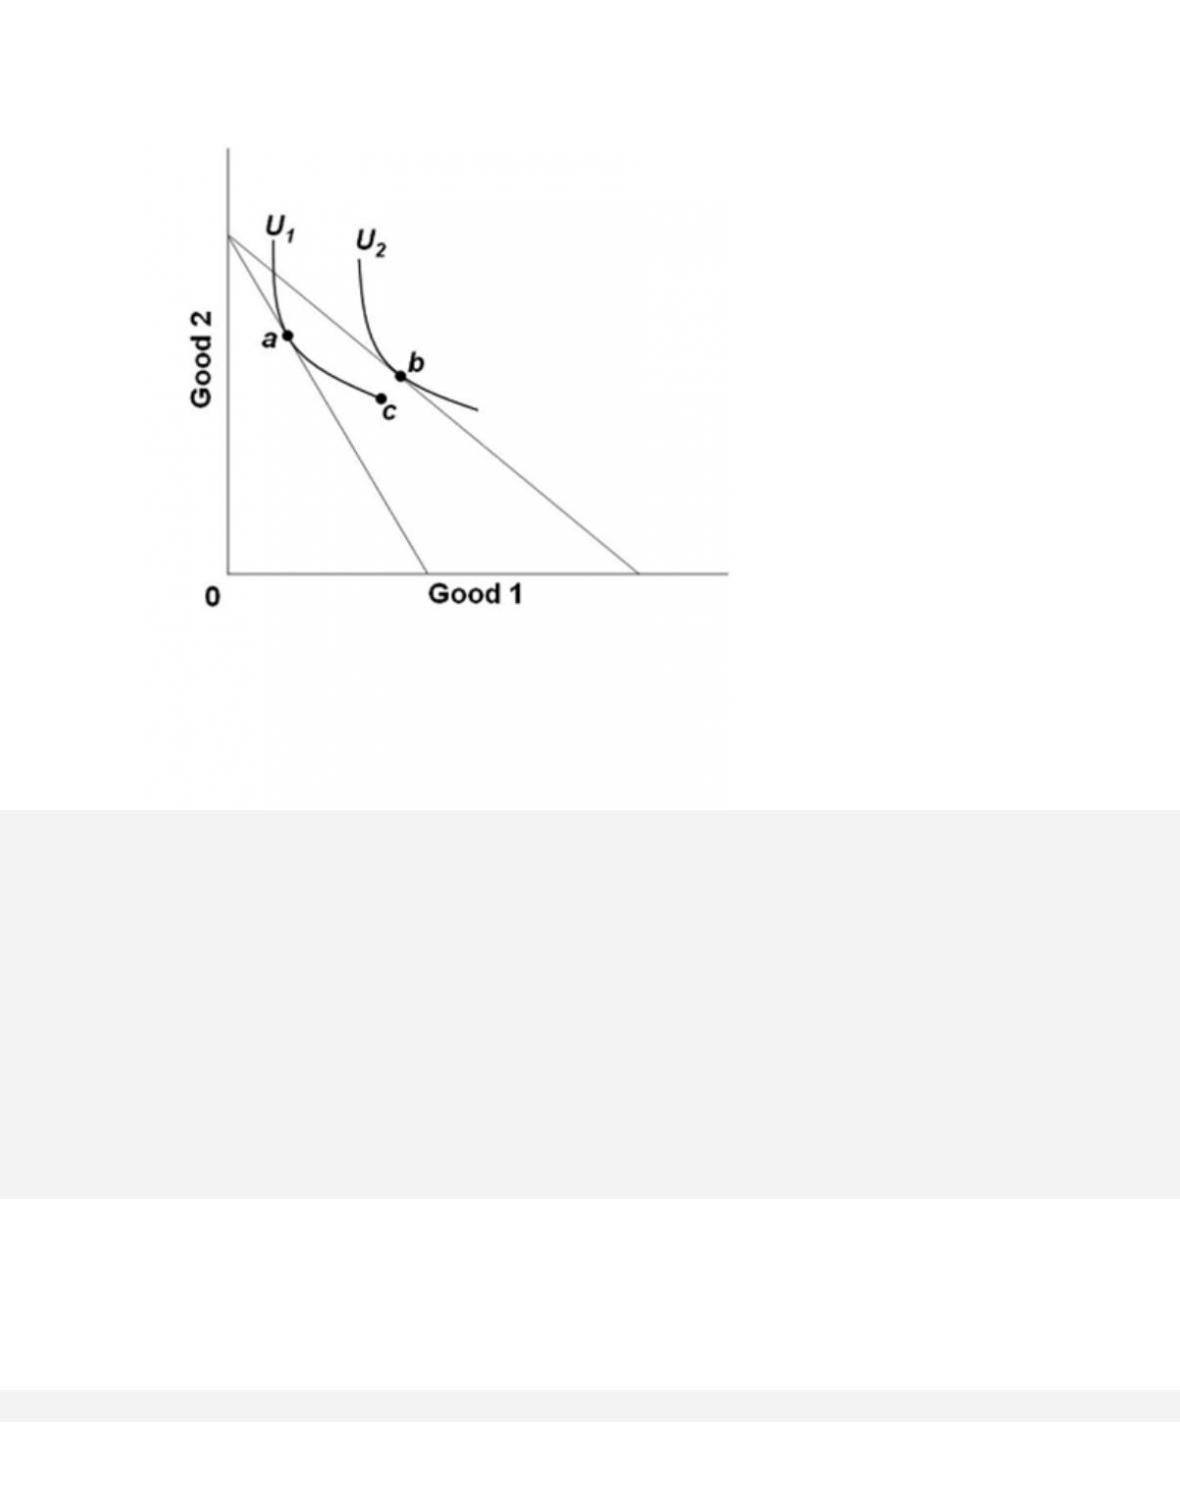
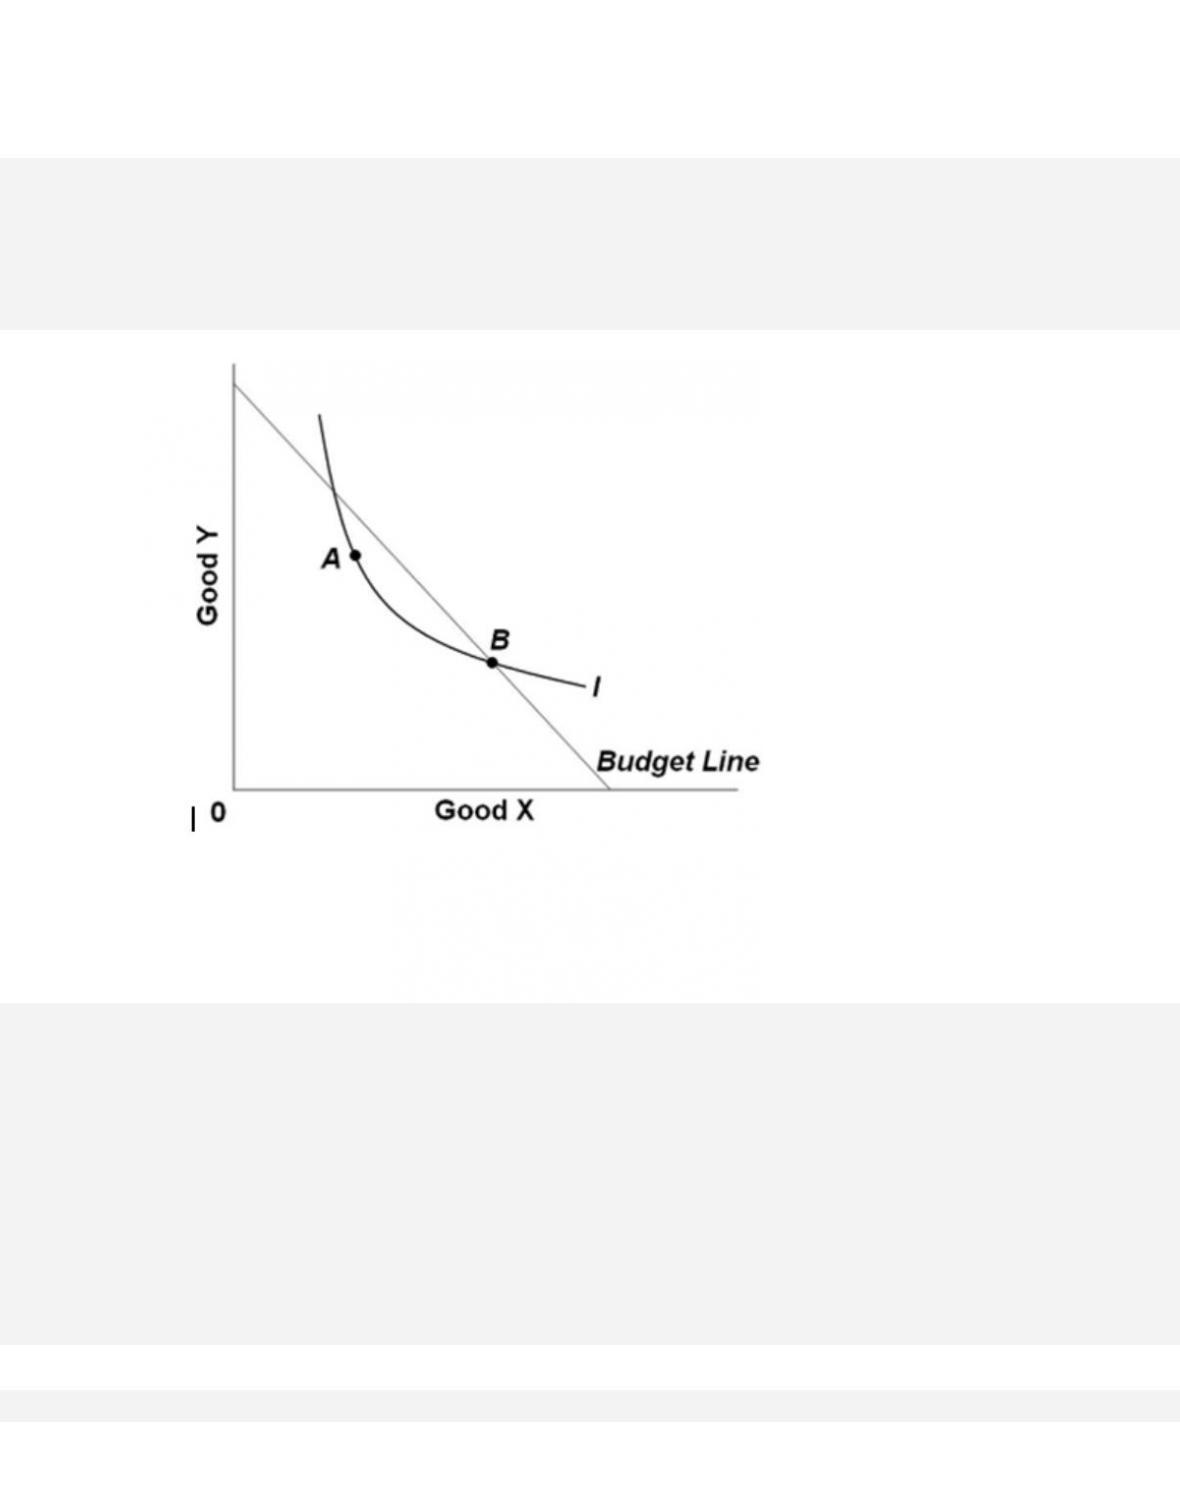
274.
Refer to the graph. What could cause the consumer equilibrium point to shift from point a to
point b?
A. The consumer’s income increased.
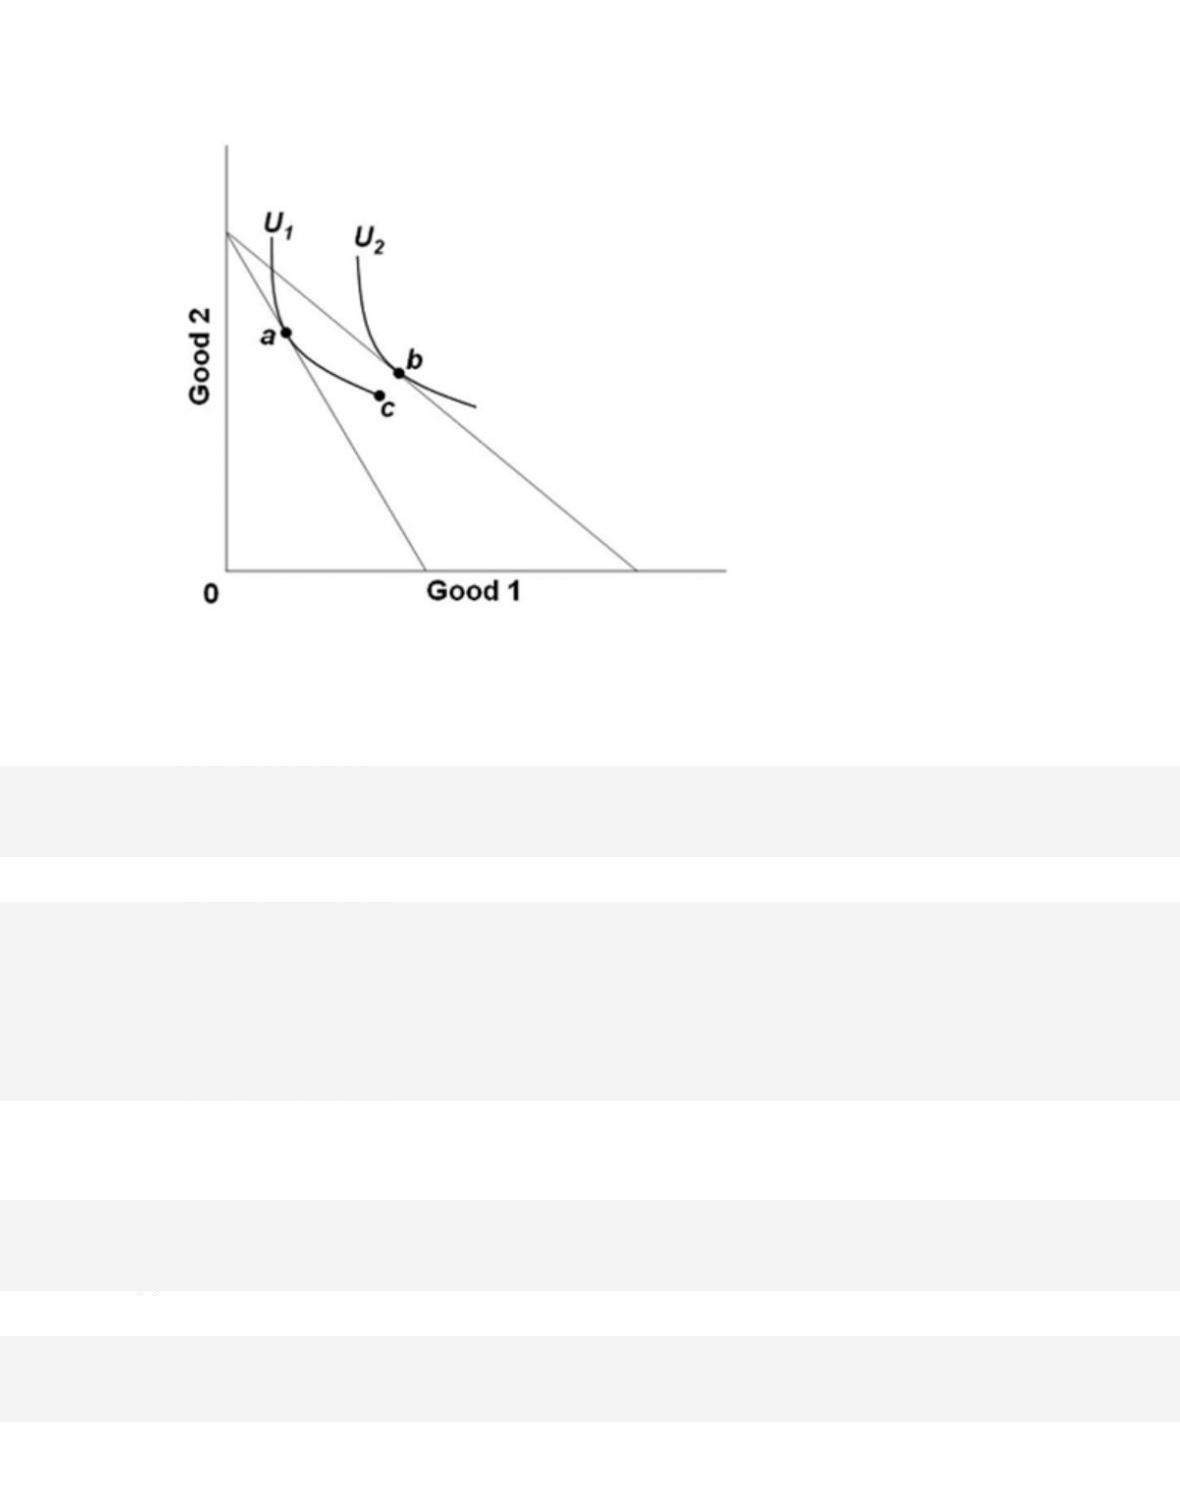
275.
Refer to the graph. As the consumer equilibrium point shifts from point a to point b,
276. To derive the demand curve of a product in indifference curve analysis, the
7-147
Copyright © 2018 McGraw-Hill Education. All rights reserved. No reproduction or distribution without the prior
written consent of McGraw-Hill Education.
A c c e s s i b i l i t y :
Keyboard Navigation
Blooms: Understand
D i f f iculty:
02 Medium
Learning Objective: 07–06 Appendix: Relate how the indifference curve model of
consumer behavior derives demand curves from budget lines, indifference curves, and
utility maximization.
Test Bank: II
To pi c:
Indifference Curve Analysis
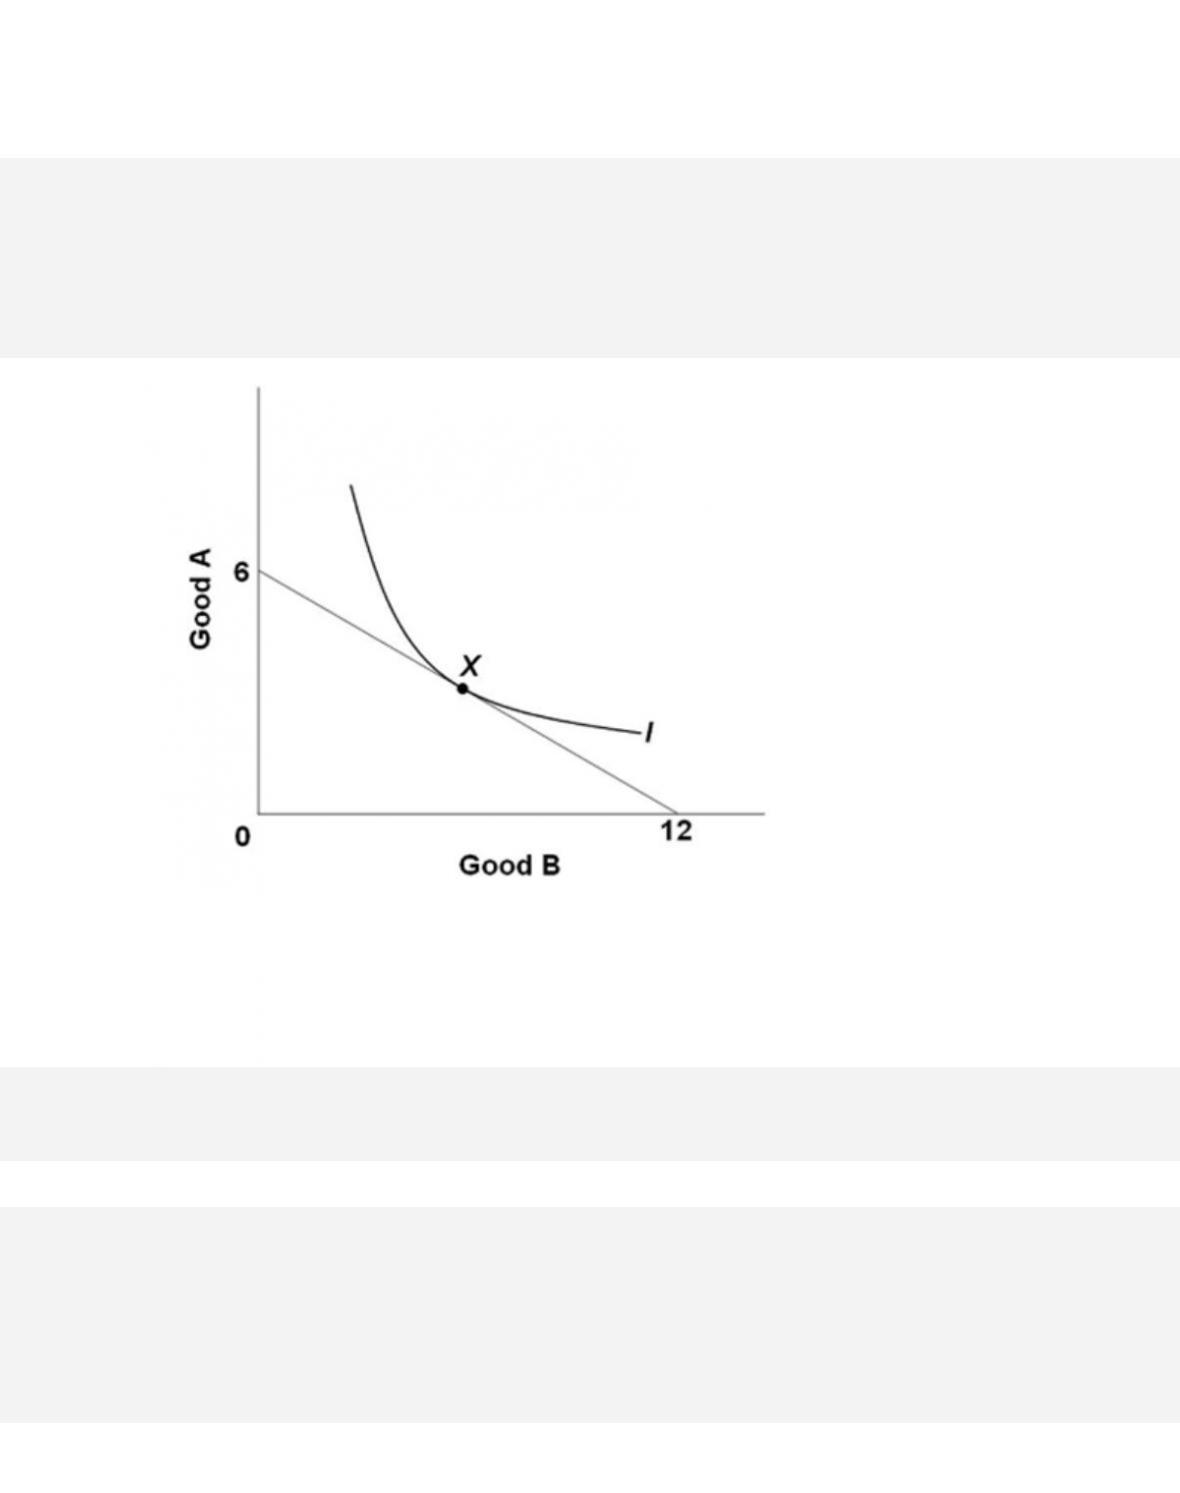
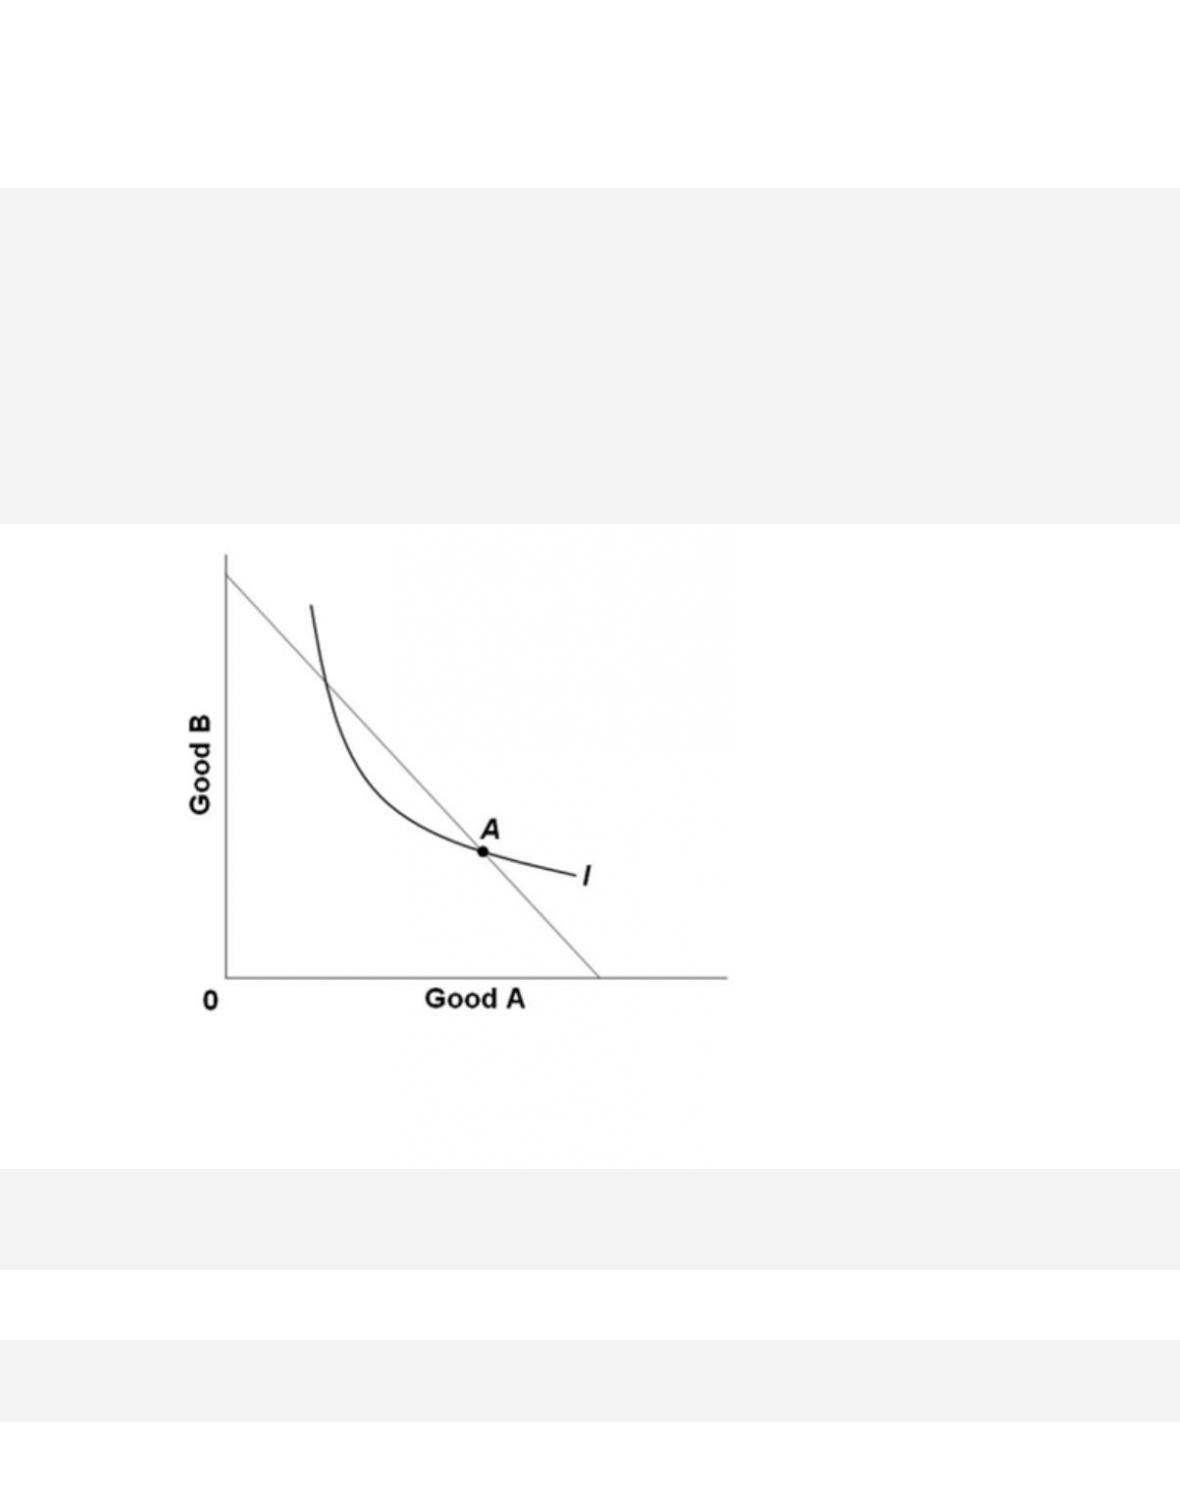
277.
At point X on the graph, which depicts a consumer’s indifference curve for goods A and B and
the relevant budget constraint line, we know that
7-148
Copyright © 2018 McGraw-Hill Education. All rights reserved. No reproduction or distribution without the prior
written consent of McGraw-Hill Education.
utility maximization.
Test Bank: II
To pi c:
Indifference Curve Analysis
278. A consumer allocates all income between two products, A and B. If, on an indifference
map, the equilibrium position shifts onto a higher indifference curve, then
A. the consumer must be purchasing more of both products.
279.
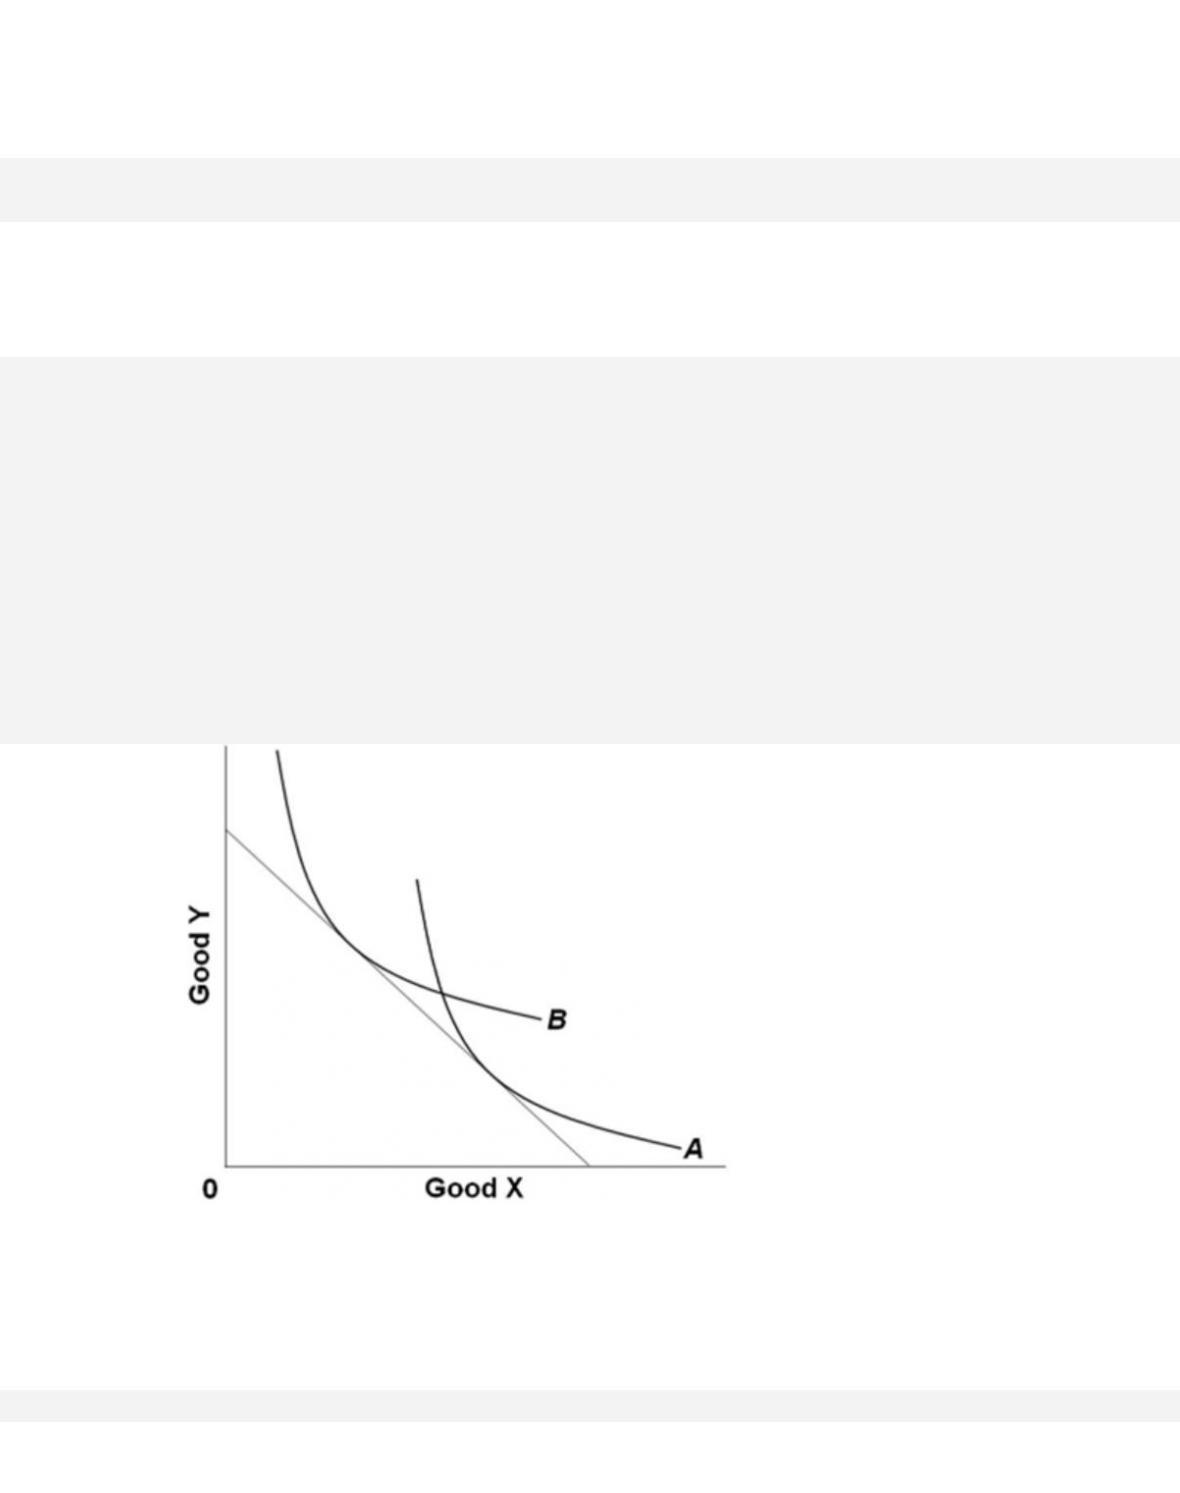
In the graph, the change in the individual’s preferences indicated by a shift from indifference
curve A to indifference curve B will result in
280.
Given the indifference curve and budget line above, which of the following must be true at point
A?
D. PA/PB = MUB/MUA
7-150
Copyright © 2018 McGraw-Hill Education. All rights reserved. No reproduction or distribution without the prior
written consent of McGraw-Hill Education.
Blooms: Understand
D i f f iculty:
02 Medium
Learning Objective: 07–06 Appendix: Relate how the indifference curve model of
consumer behavior derives demand curves from budget lines, indifference curves, and
utility maximization.
Test Bank: II
To pi c:
Indifference Curve Analysis
281.
Given the indifference curve and budget line above, this individual
A. prefers B to A, but B costs more.
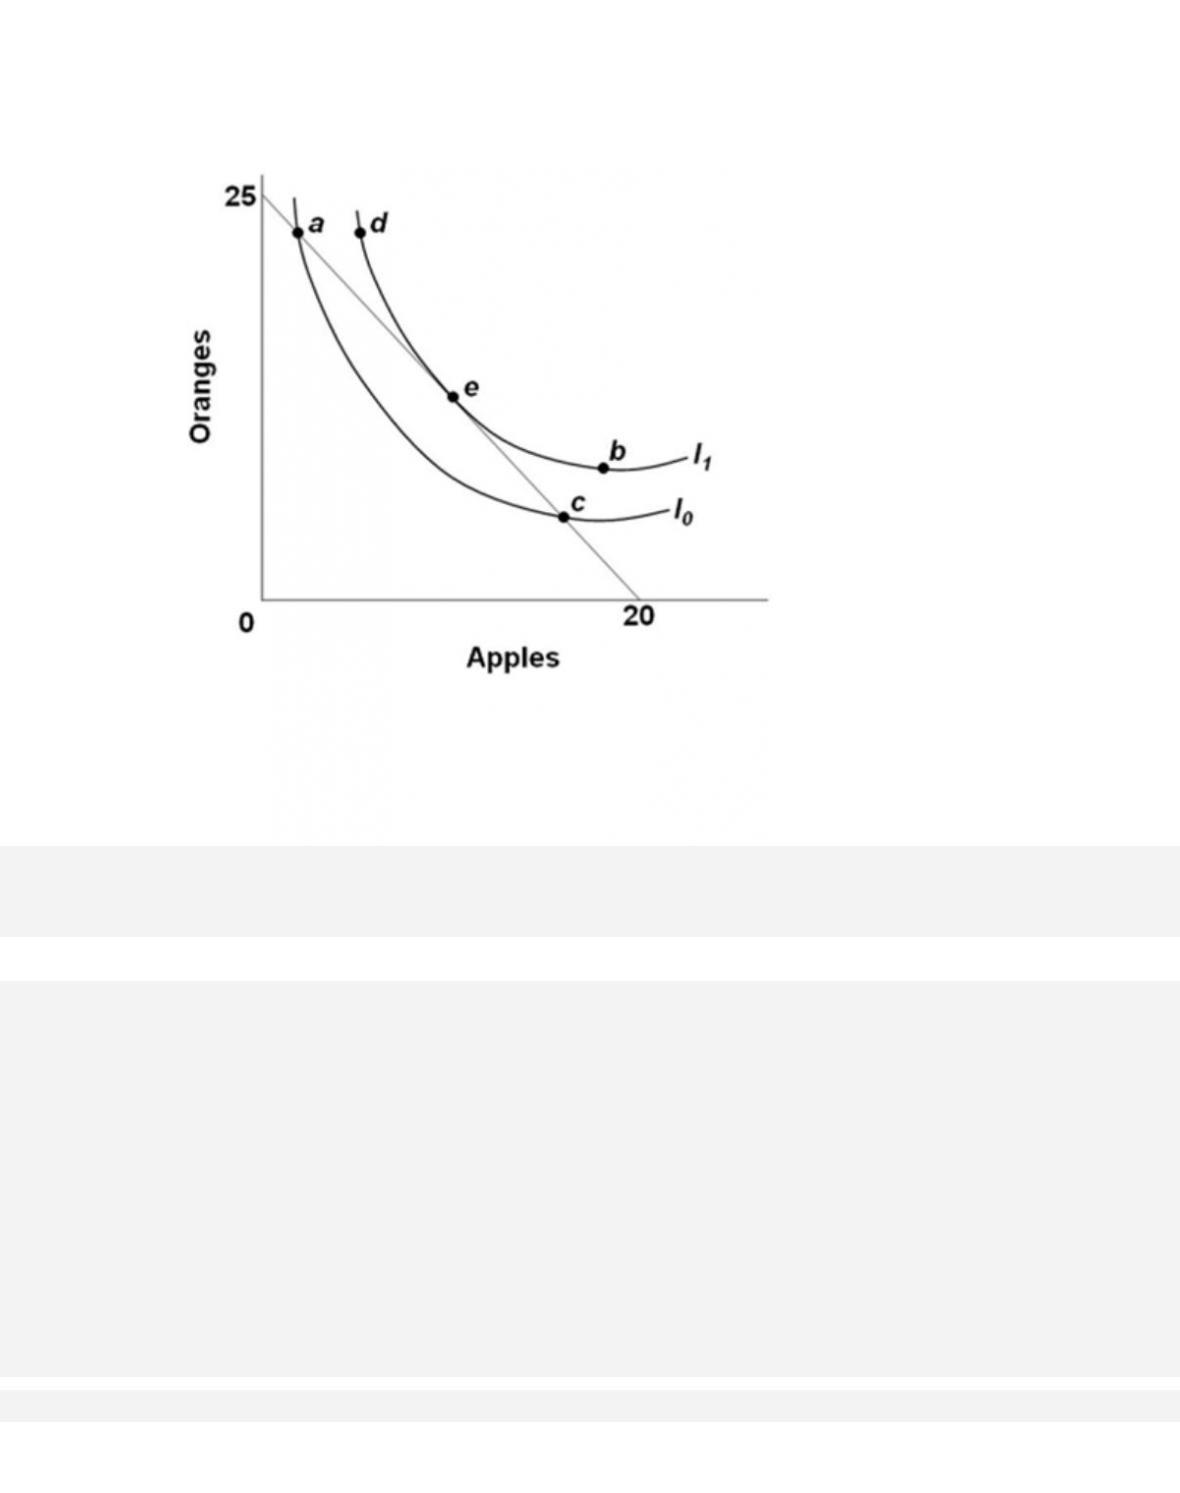
282.
In the diagram, suppose the consumer is currently exhausting his or her income at a point where
the marginal rate of substitution of apples for oranges is greater than 5/4. That is, MUA/MU0
>5/4. To maximize utility, the consumer should move from point
283.
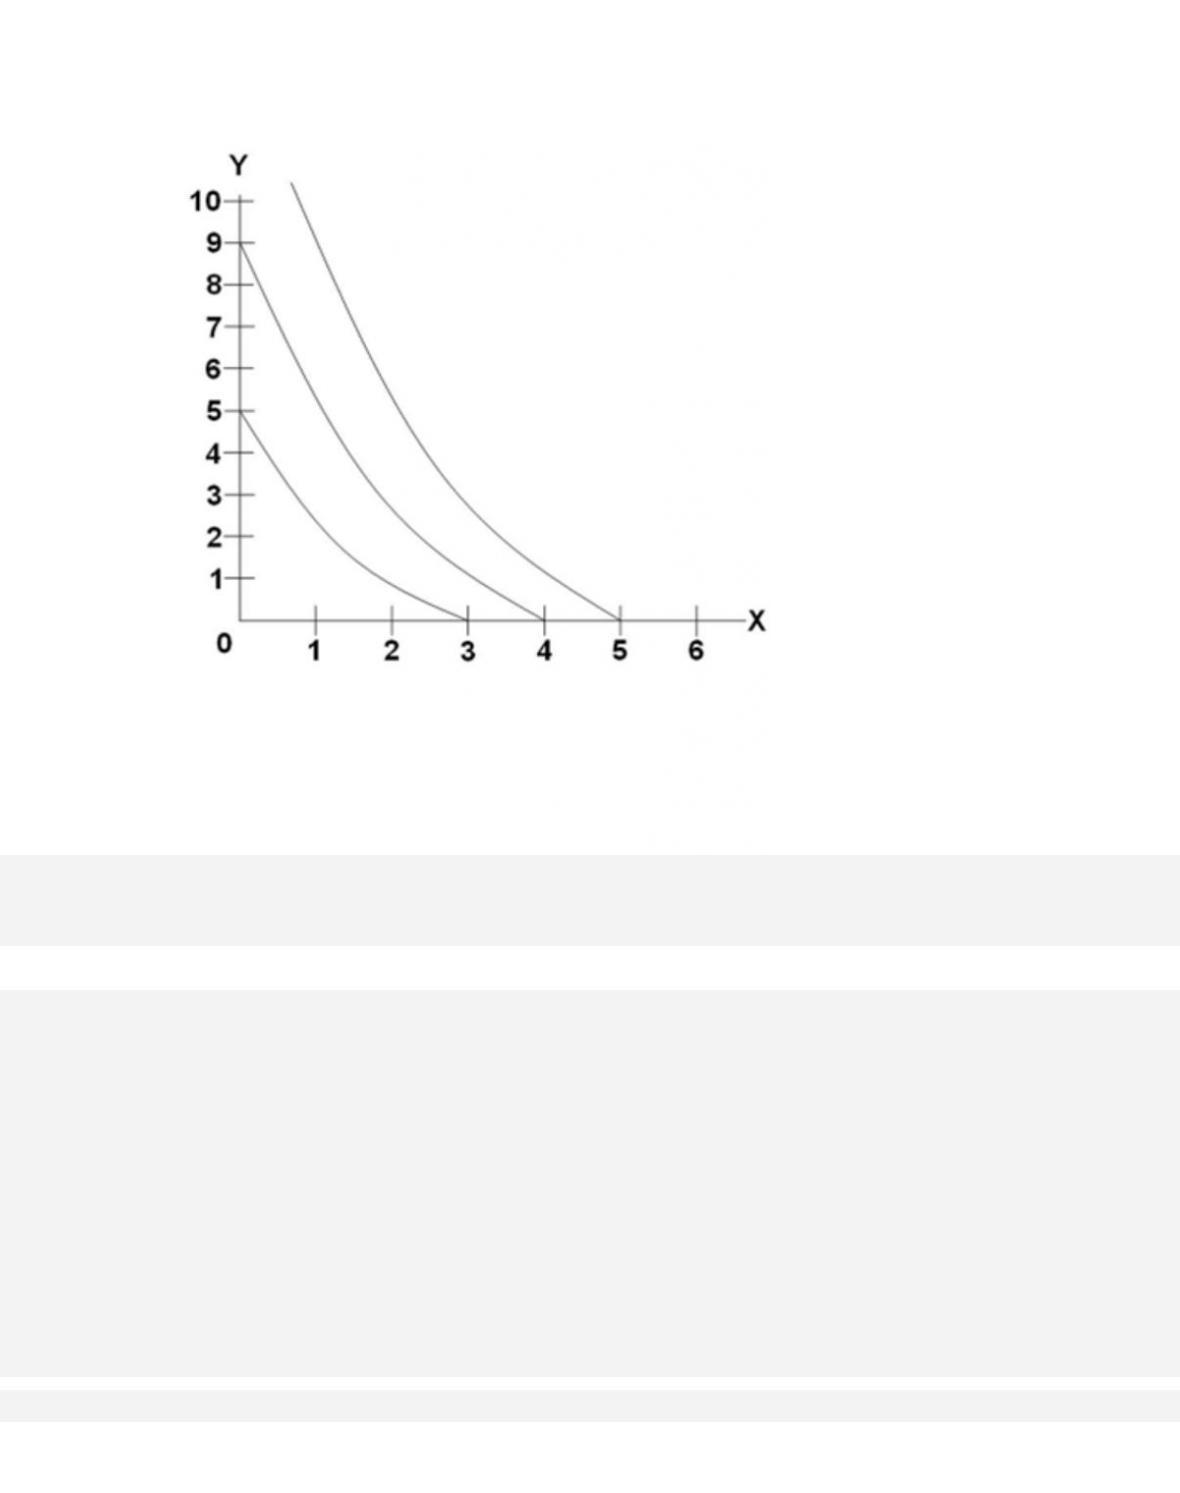
Refer to the given graph. Suppose you had tastes as described by the indifference curves above.
If your income was $100, Px = 20 and Py = 25, which combination of X and Y would maximize
your utility?
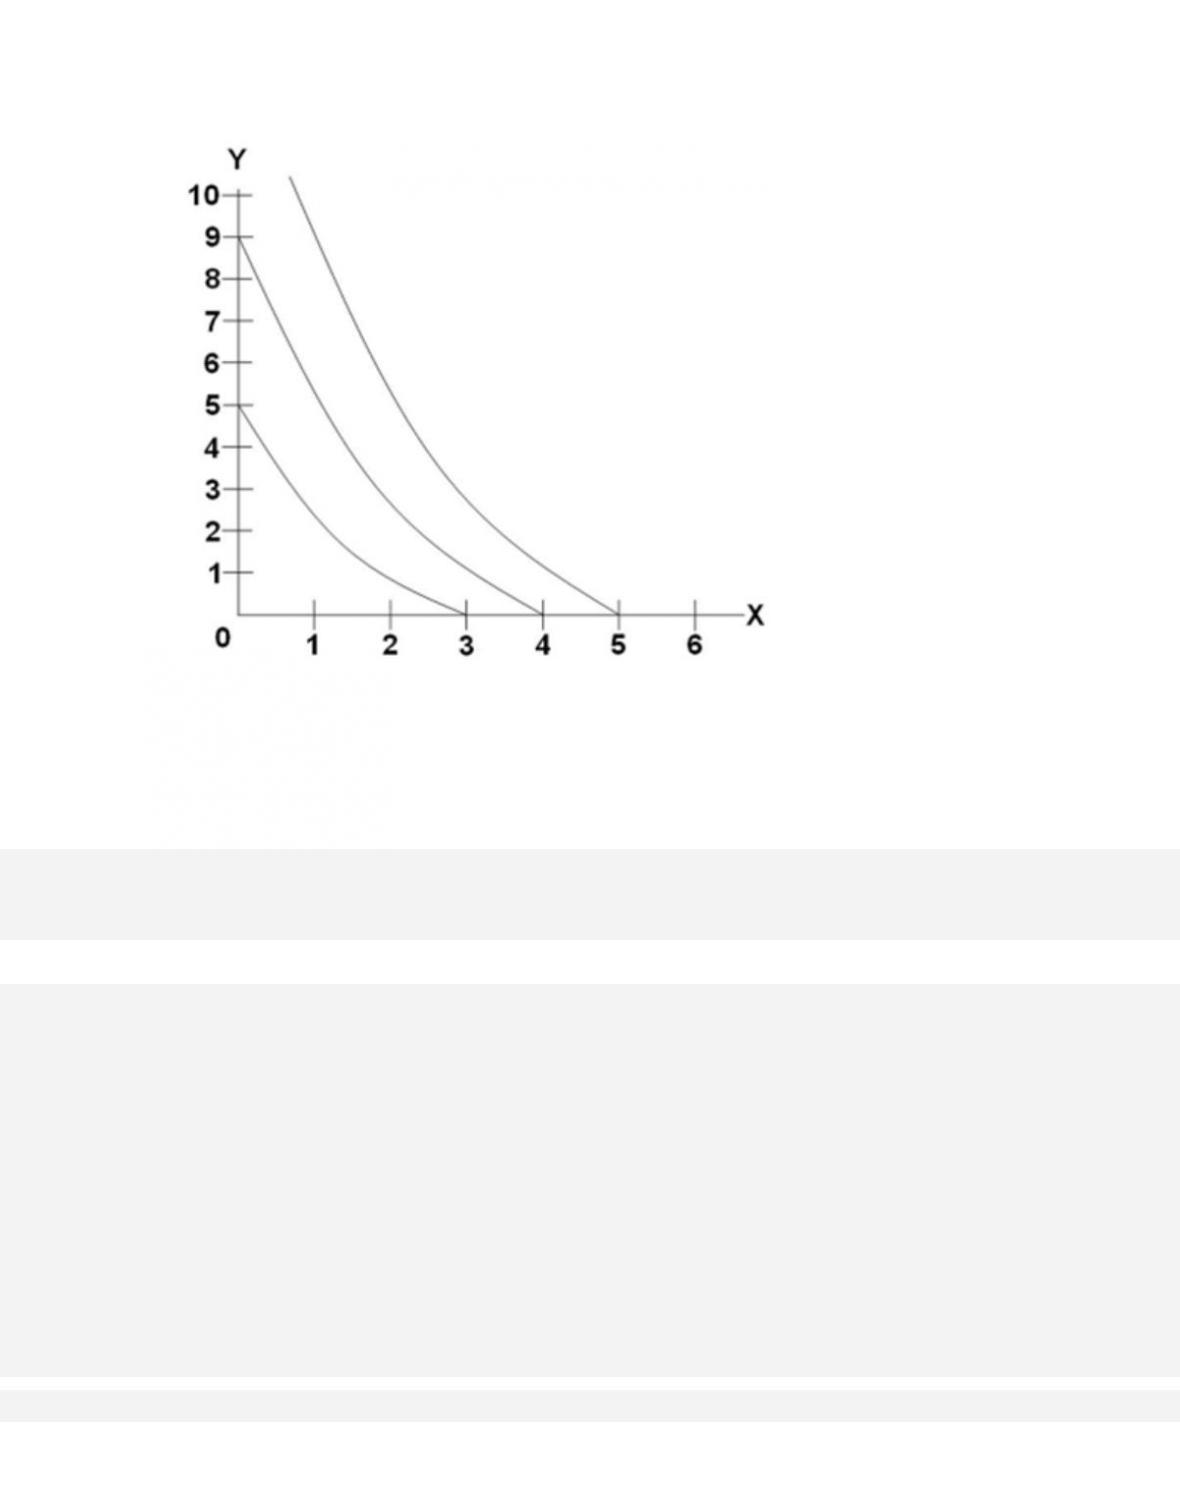
284.
Refer to the graph. Suppose you had tastes as described by the indifference curves above. If
your income was $90, Px = 30, and Py = 10, which combination of X and Y would maximize
your utility?
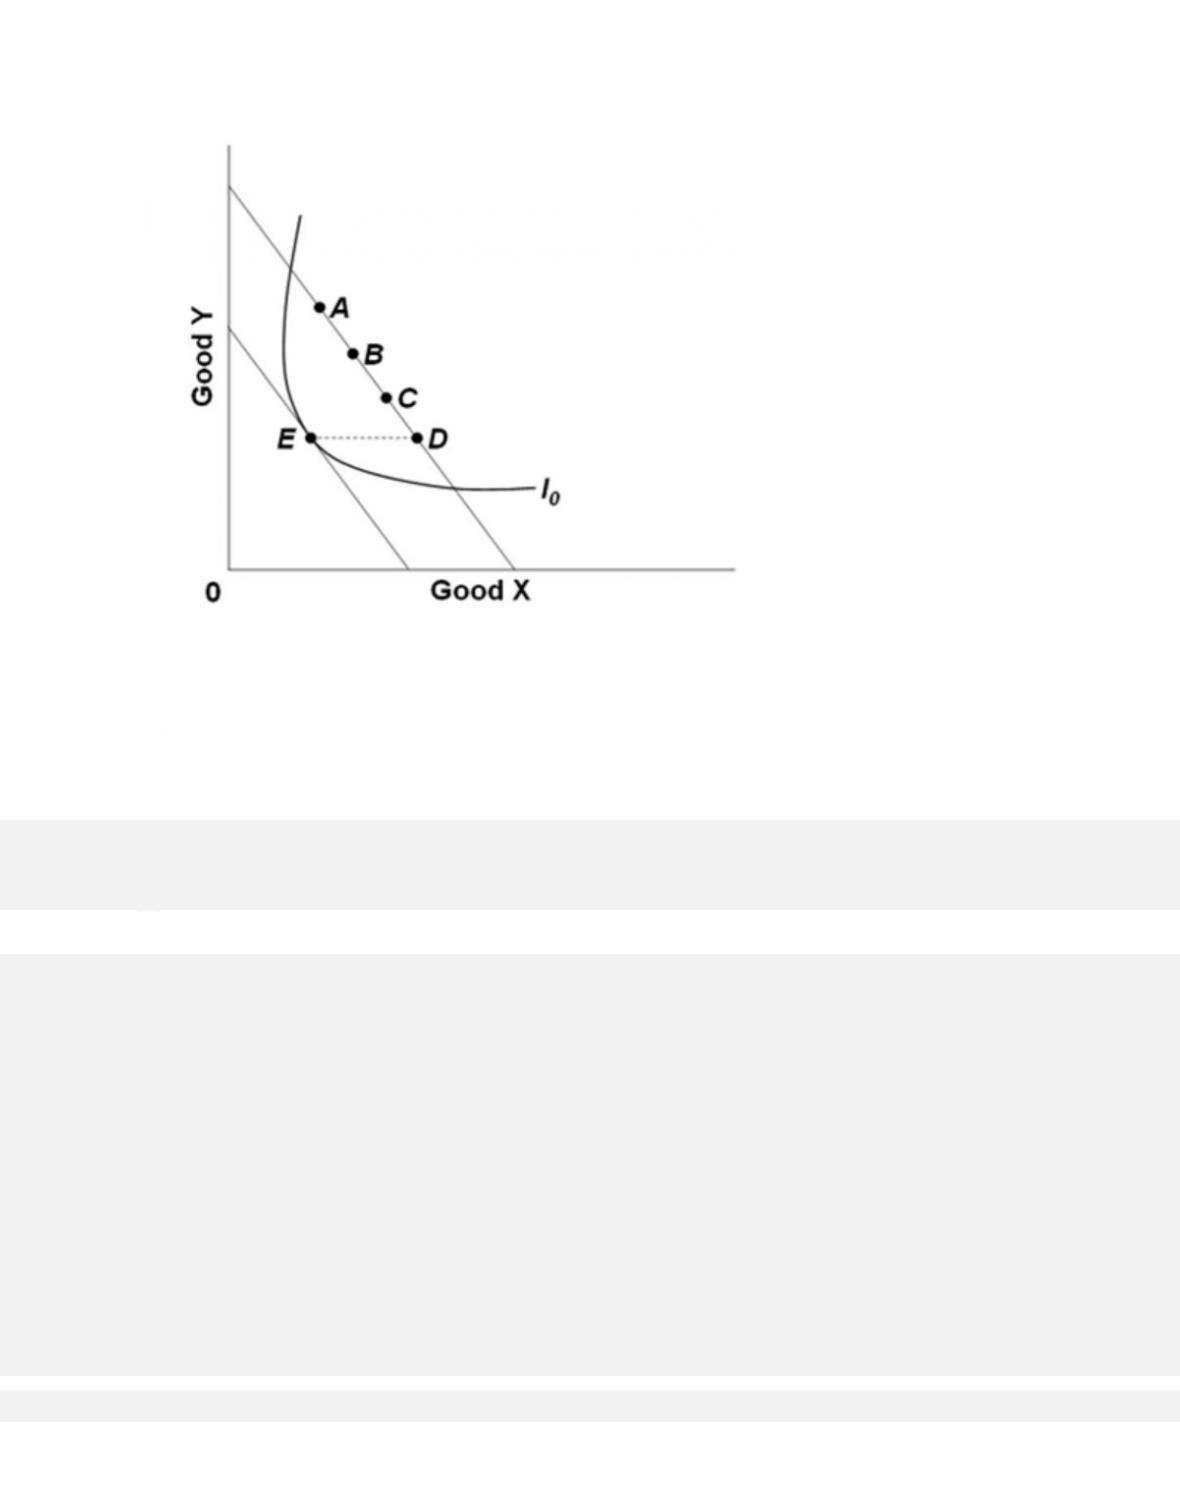
285.
Consider the diagram, where E is the consumer’s original equilibrium position. We know good
Y is not a normal good if, as income increases, the consumer’s new equilibrium position is at
point