
7-121
D i f f i c u l t y :
02 Medium
226. Assume a round of golf requires four hours of leisure time, and attending a concert requires
two hours. If the price of a round of golf is $40 and the price of a concert is $80, ceteris
paribus, Joe will play
227. The marginal utility of leisure time appears to
228. You can drive from Kansas City to St. Louis in five hours. You can fly between the cities
in two hours. The price of an airline ticket is $150. The cost of driving between the cities is
$50. About what hourly wage would make the “full” cost of driving equal the “full” cost of

flying, where “full” cost includes the value of time?
229. An increase in the productivity of labor over time will
230. A consumer has two basic choices in making a trip: rent a car for $30.00 a day and spend
two days of travel to the destination, or spend $400 for an airplane ticket and fly to the
destination in two hours. The marginal utilities of the car rental and the airline ticket are the
same. The consumer values time at $5 an hour. The rational consumer will most likely

7-123
Copyright © 2018 McGraw-Hill Education. All rights reserved. No reproduction or distribution without the prior
written consent of McGraw-Hill Education.
Blooms: Understand
D i f f i c u l t y :
02 Medium
Learning Objective: 07–05 Give examples of several real-world phenomena that can
be explained by applying the theory of consumer behavior.
Test Bank: II
To pi c:
Applications and Extensions
231. If consumption of a good is subsidized by the government, then the MU/P of that good
among consumers will
232. The financing of health care through insurance has
233. Health insurance often pays 80 percent of health care costs. This situation will encourage
the rational consumer to
A. consume less health care because the cost is too expensive.

7-124
Copyright © 2018 McGraw-Hill Education. All rights reserved. No reproduction or distribution without the prior
written consent of McGraw-Hill Education.
B. obtain health insurance that pays less than 80 percent of medical care costs.
C. use more medical services than they would if they had to paid the full price.
D. eliminate their health care coverage because it does not cover 100 percent of the cost.
234. If you purchase a gift worth $25 for your sister, but your sister would be willing to pay
only $10 ifshe bought the item for herself, then the
235. From the viewpoint of potential criminals, the probability of being fined or imprisoned
A. raises the marginal utility of criminal behavior.

7-125
Copyright © 2018 McGraw-Hill Education. All rights reserved. No reproduction or distribution without the prior
written consent of McGraw-Hill Education.
To pi c:
Applications and Extensions
236. Many people do not steal or commit fraud because to them, the resulting feelings of guilt
and uneasiness make the
237. When DVD players start becoming obsolete then, to potential thieves, the
A. marginal utility of stealing them increases.
True / False Questions
238. Marginal utility is the accumulation of the total utility from successive units of a good or
service consumed.

7-126
Copyright © 2018 McGraw-Hill Education. All rights reserved. No reproduction or distribution without the prior
written consent of McGraw-Hill Education.
Blooms: Remember
Difficu l t y :
01 Easy
Learning Objective: 07–01 Define and explain the relationship between total utility,
marginal utility, and the law of diminishing marginal utility.
Test Bank: II
To pi c:
Law of Diminishing Marginal Utility
239. The law of diminishing marginal utility suggests that the total utility that a consumer
derives from a product will increase slower and slower as more of the product is consumed.
240. If total utility increases as consumption of a good increases, then marginal utility must be
increasing also.
241. With diminishing marginal utility, if a consumer reduces her consumption of a good, then
her marginal utility from that good would increase.

7-127
Copyright © 2018 McGraw-Hill Education. All rights reserved. No reproduction or distribution without the prior
written consent of McGraw-Hill Education.
Learning Objective: 07–01 Define and explain the relationship between total utility,
marginal utility, and the law of diminishing marginal utility.
Test Bank: II
To pi c:
Law of Diminishing Marginal Utility
242. The price of chicken = $5, while the price of pork = $9. If, after spending her entire
budget, the consumer has MU of chicken = 6, while the MU of pork = 12, then the consumer
should have bought more chicken and less pork in order to increase her total utility.
243. If the price of a good increases, it will tend to make the MU to P ratio for the good rise and
the good becomes more attractive to the buyer.
244. The law of diminishing marginal utility implies that in order to induce a buyer to buy more
of a product, the seller must lower its price.

7-128
Copyright © 2018 McGraw-Hill Education. All rights reserved. No reproduction or distribution without the prior
written consent of McGraw-Hill Education.
Learning Objective: 07–03 Explain how a demand curve can be derived by observing
the outcomes of price changes in the utility-maximization model.
Test Bank: II
To pi c:
Utility Maximization and the Demand Curve
245. The income effect of a price increase for a normal good causes an increase in the
consumption of the good.
246. The substitution effect of a price decrease for a good causes an increase in the consumption
of the good, regardless of whether the good is normal or inferior.
247. An increase in the real income of a consumer is one result from an increase in the price of
a product that the consumer is buying.

7-129
Copyright © 2018 McGraw-Hill Education. All rights reserved. No reproduction or distribution without the prior
written consent of McGraw-Hill Education.
Test Bank: II
To pi c:
Income and Substitution Effects
248. The income and substitution effects will both induce the consumer to buy more of a normal
good when its price decreases.
249. Someone who pays $800 to fly from one city to another instead of paying only $100 for a
bus trip between the two cities is making an irrational choice and is thus not maximizing his
utility.
250. If consumers are convinced by ads that Brand X has a lot more value than they originally
thought, then the MU/P of X will decrease.

7-130
To pi c:
Applications and Extensions
Multiple Choice Questions
251. A graph that shows the maximum combinations of two goods which a consumer can
purchase with a given money income is
252. The ratio of the prices of two products that a consumer could buy with a given fixed
income is equivalent to the
253. A decrease in the prices of two products that a consumer buys out of a constant budget
would cause the consumer’s
A. indifference curves to shift outward from the origin.
B. indifference curves to shift inward to the origin.

7-131
Copyright © 2018 McGraw-Hill Education. All rights reserved. No reproduction or distribution without the prior
written consent of McGraw-Hill Education.
C. budget line to shift outward from the origin.
D. budget line to shift inward to the origin.
254. A leftward shift of a consumer‘s budget line to a position parallel with the original one
could indicate that the
A. price of one product has decreased in relation to the other.
B. prices of both products have decreased in the same proportion.
255. Suppose a consumer has an income of $16, the price of A is $2, and the price of B is $1.
Which of the following combinations is on the consumer’s budget line?

7-132
Copyright © 2018 McGraw-Hill Education. All rights reserved. No reproduction or distribution without the prior
written consent of McGraw-Hill Education.
D i f f i c u l t y :
02 Medium
Learning Objective: 07–06 Appendix: Relate how the indifference curve model of
consumer behavior derives demand curves from budget lines, indifference curves, and
utility maximization.
Test Bank: II
To pi c:
Indifference Curve Analysis
256. If a consumer has an income of $200, the price of X is $5, and the price of Y is $10, what
is the maximum quantity of X the consumer is able to purchase?
257. A consumer has an income of $200, and the price of X is $5, while the price of Y is $10. If
the consumer buys 8 units of X, then the maximum quantity of Y that she could also buy is
D. 14.
258. The income of a consumer is $40, the price of A is $8, and the price of B is $4. If the
7-133
quantity of A is measured vertically, then the slope of the budget line is
D. −2.5.
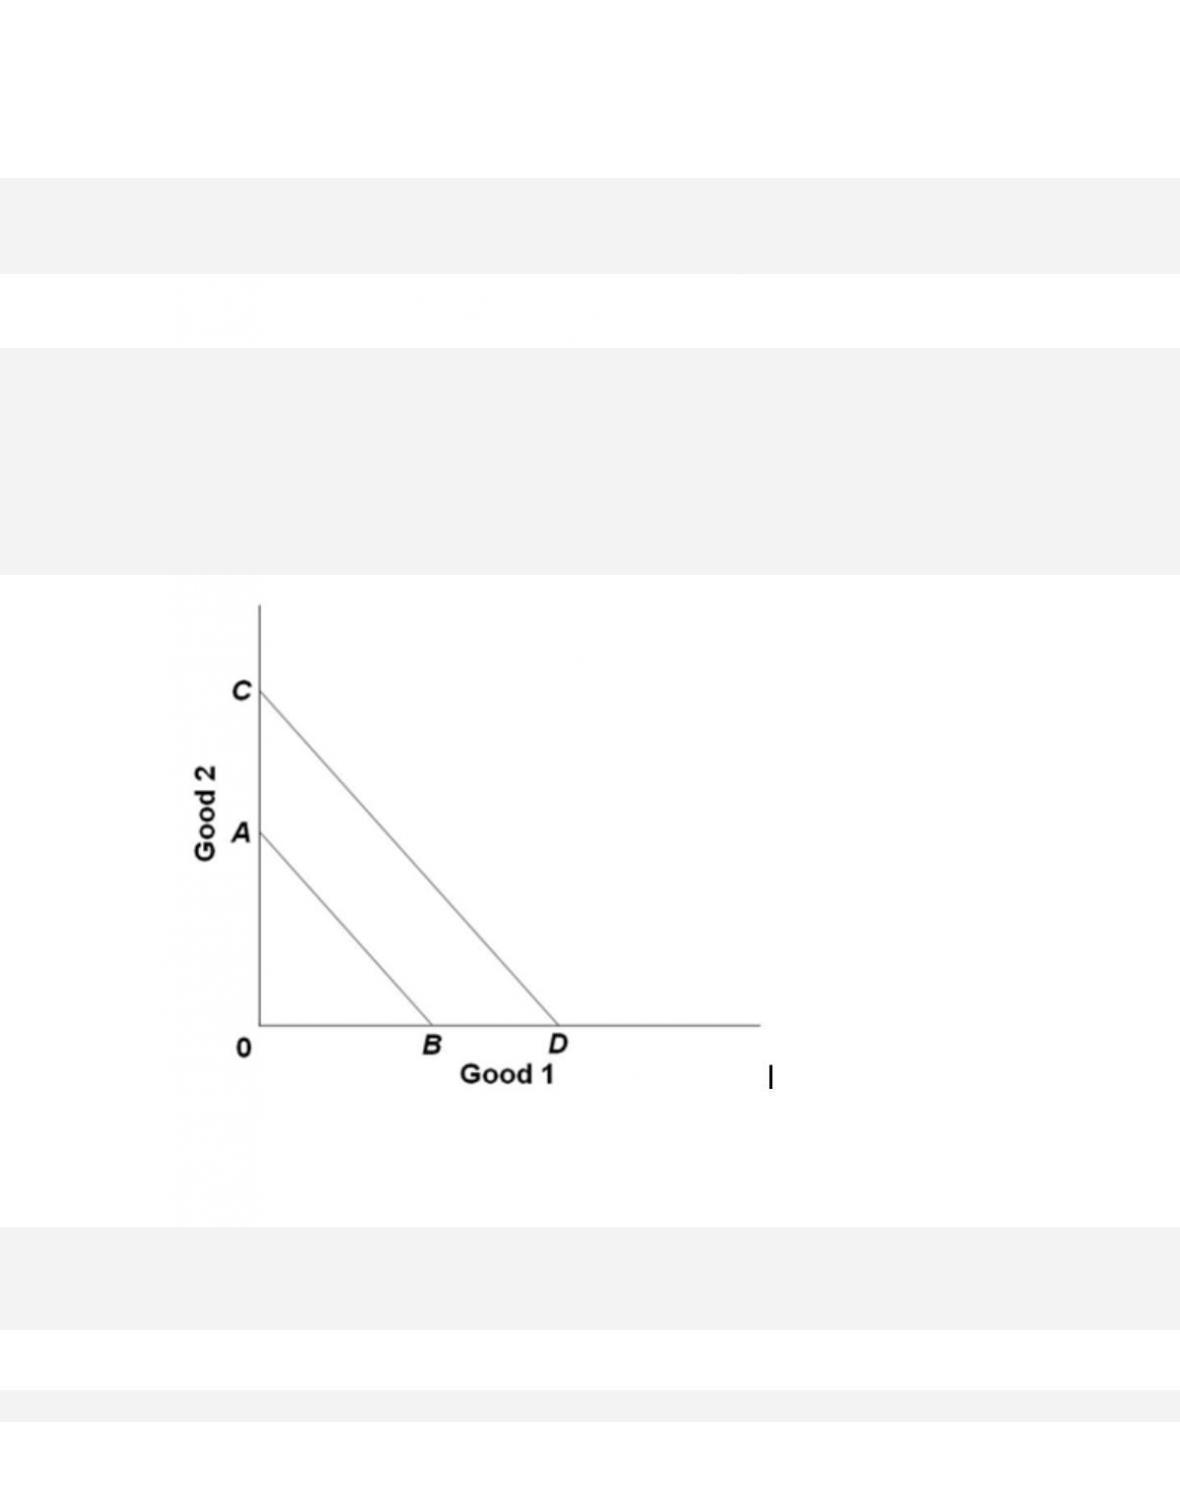
259.
Refer to the graph. The shift of the budget line from AB to CD is consistent with
A. a decrease in the consumer’s money income.
7-134
Copyright © 2018 McGraw-Hill Education. All rights reserved. No reproduction or distribution without the prior
written consent of McGraw-Hill Education.
AACSB: Knowledge Application
Blooms: Understand
D i f f i c u l t y :
02 Medium
Learning Objective: 07–06 Appendix: Relate how the indifference curve model of
consumer behavior derives demand curves from budget lines, indifference curves, and
utility maximization.
Test Bank: II
To pi c:
Indifference Curve Analysis
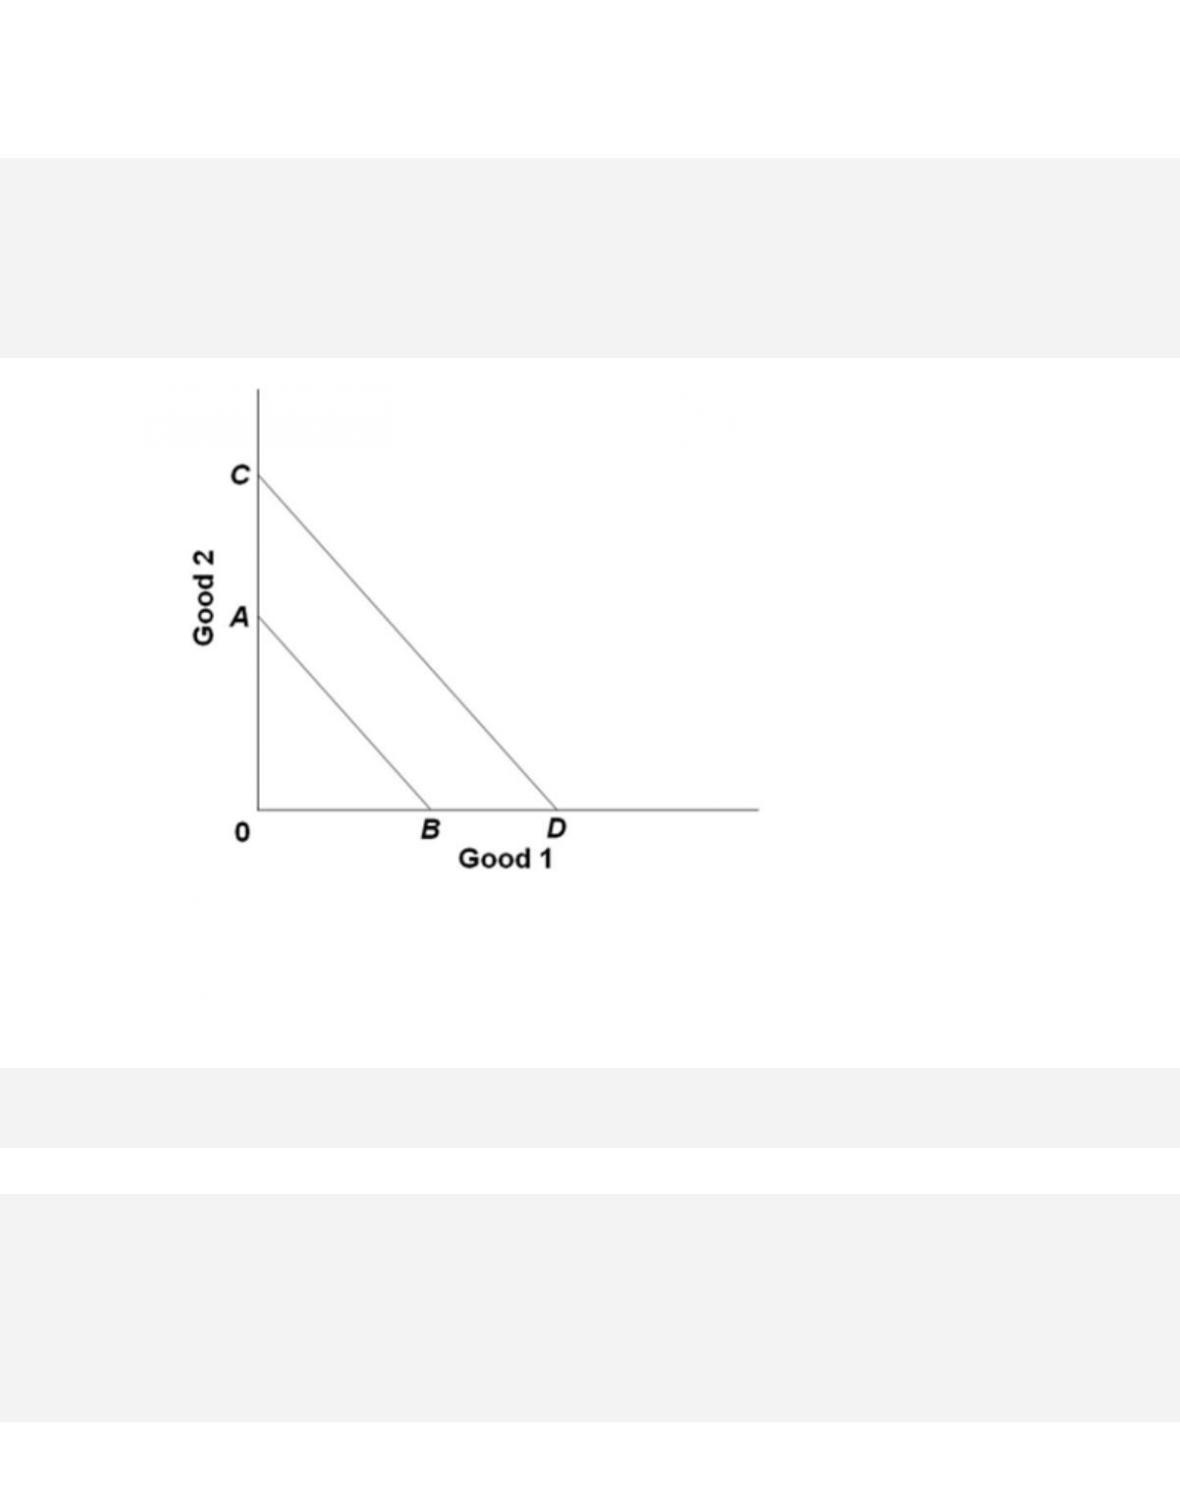
260.
Refer to the diagram. Cheri’s budget line shifts inward from CD to AB. Which statement below
is consistent with this shift?
A. Both prices double, while her income also doubles.
7-135
Copyright © 2018 McGraw-Hill Education. All rights reserved. No reproduction or distribution without the prior
written consent of McGraw-Hill Education.
Test Bank: II
To pi c:
Indifference Curve Analysis
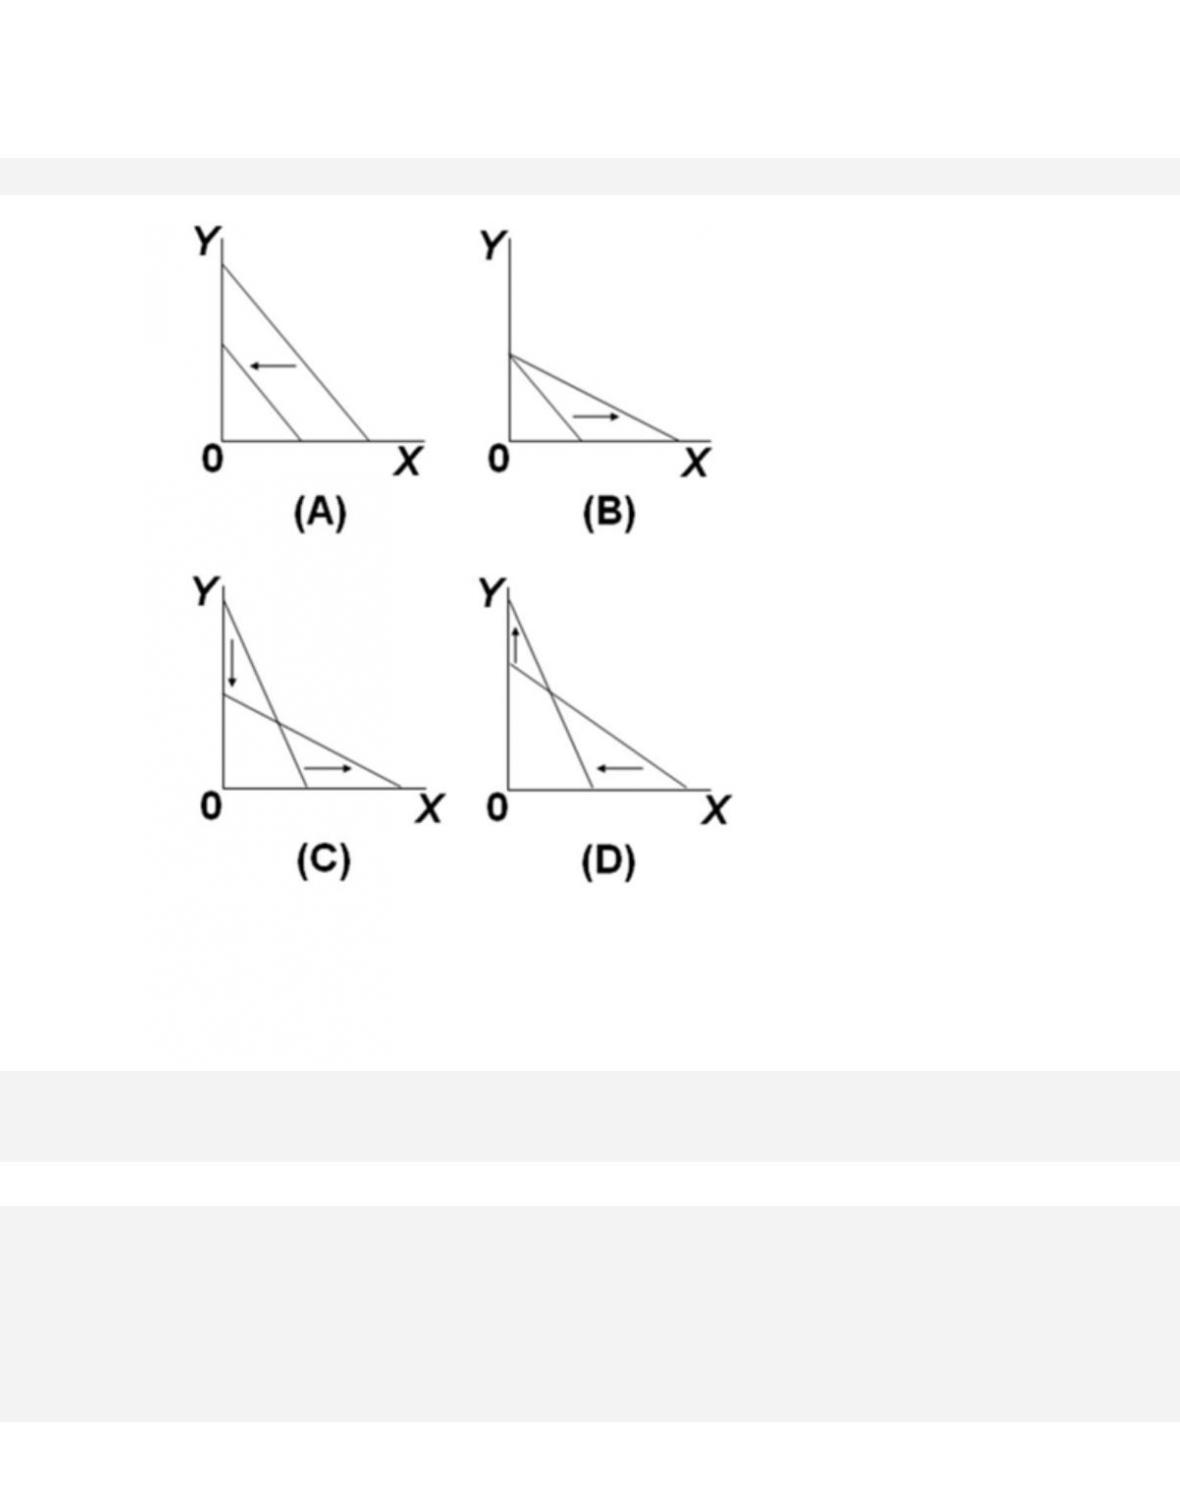
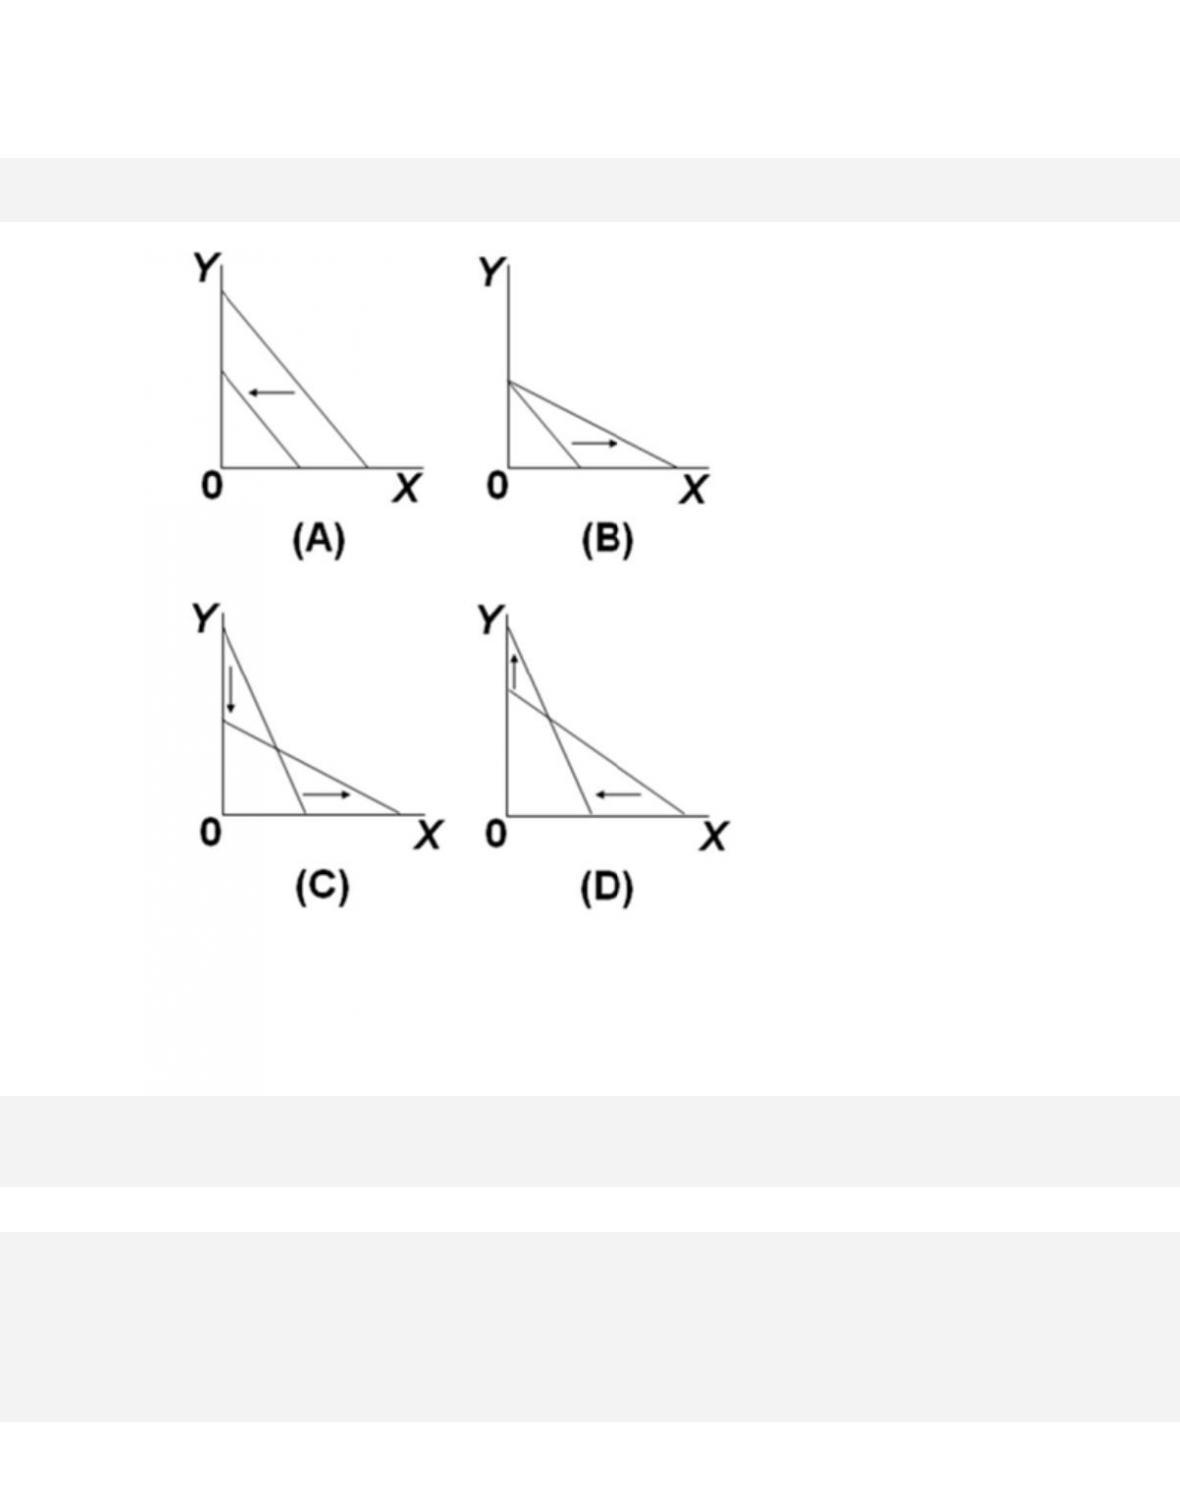
261.
Which of the graphs shows a change in the price of X, but no changes in the price of Y and in
the buyer’s budget?
7-136
Copyright © 2018 McGraw-Hill Education. All rights reserved. No reproduction or distribution without the prior
written consent of McGraw-Hill Education.
utility maximization.
Test Bank: II
To pi c:
Indifference Curve Analysis
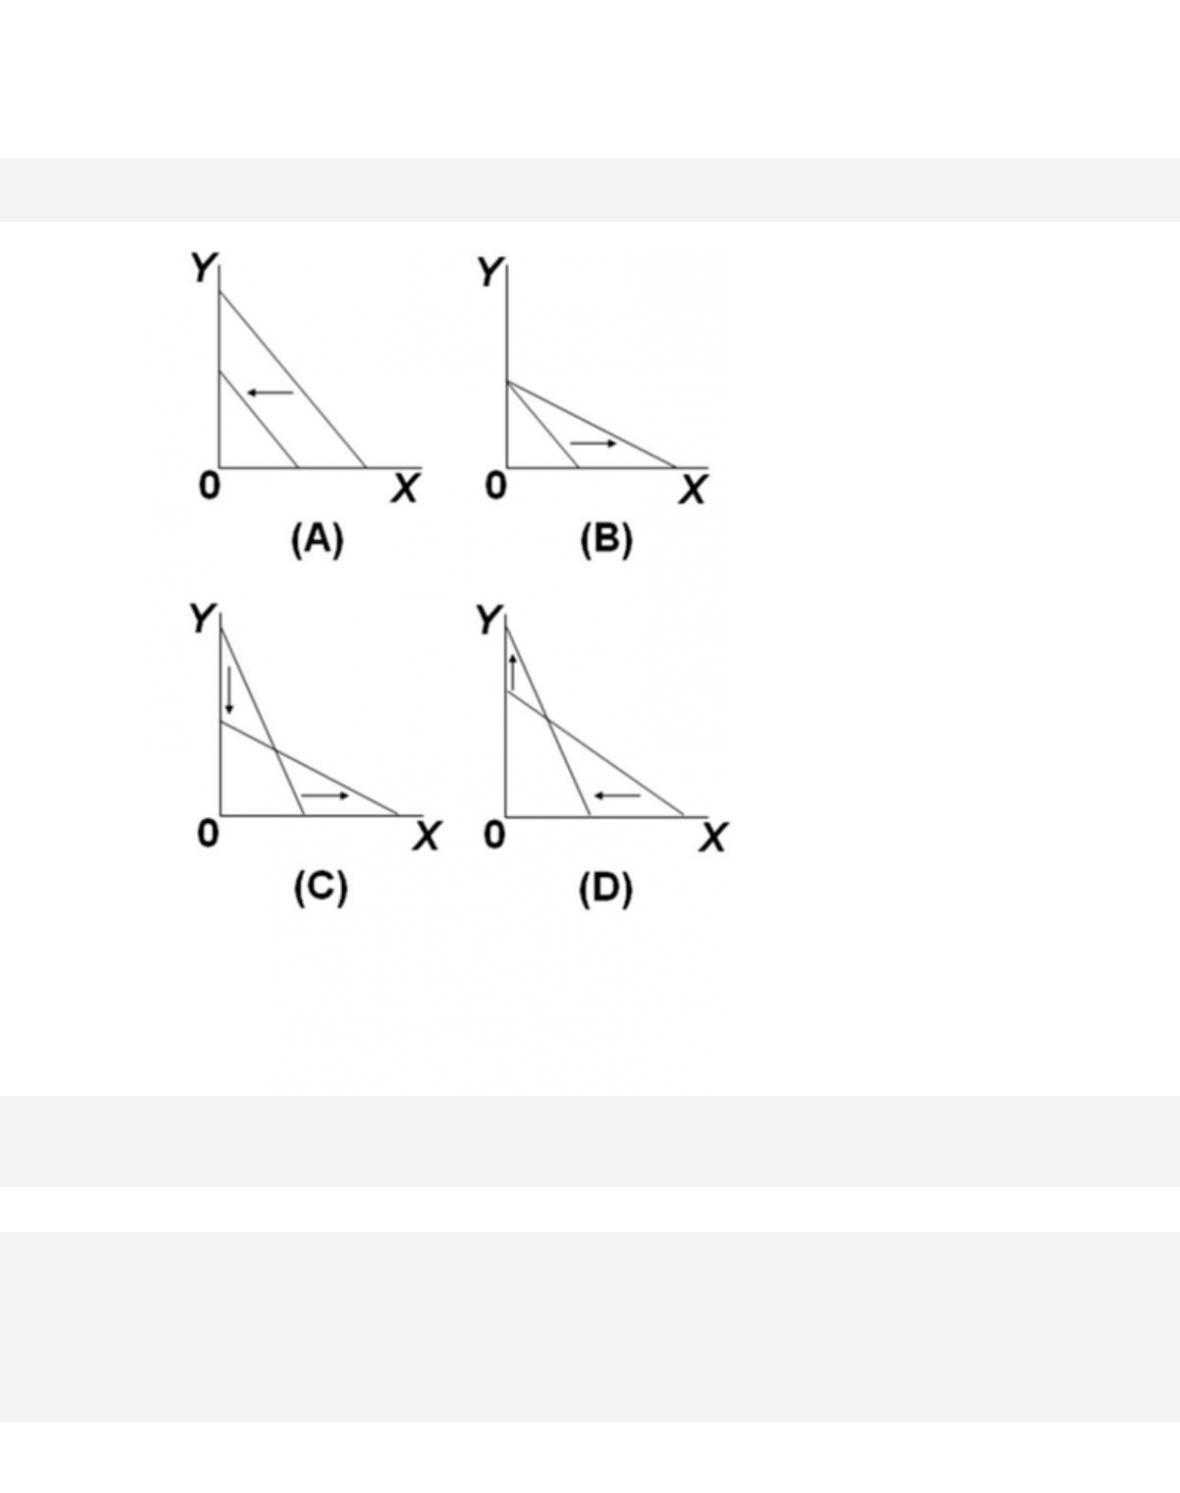
262.
Which of the graphs shows a change in the buyer‘s income, but no changes in the prices of X
and Y?
7-137
Copyright © 2018 McGraw-Hill Education. All rights reserved. No reproduction or distribution without the prior
written consent of McGraw-Hill Education.
utility maximization.
Test Bank: II
To pi c:
Indifference Curve Analysis
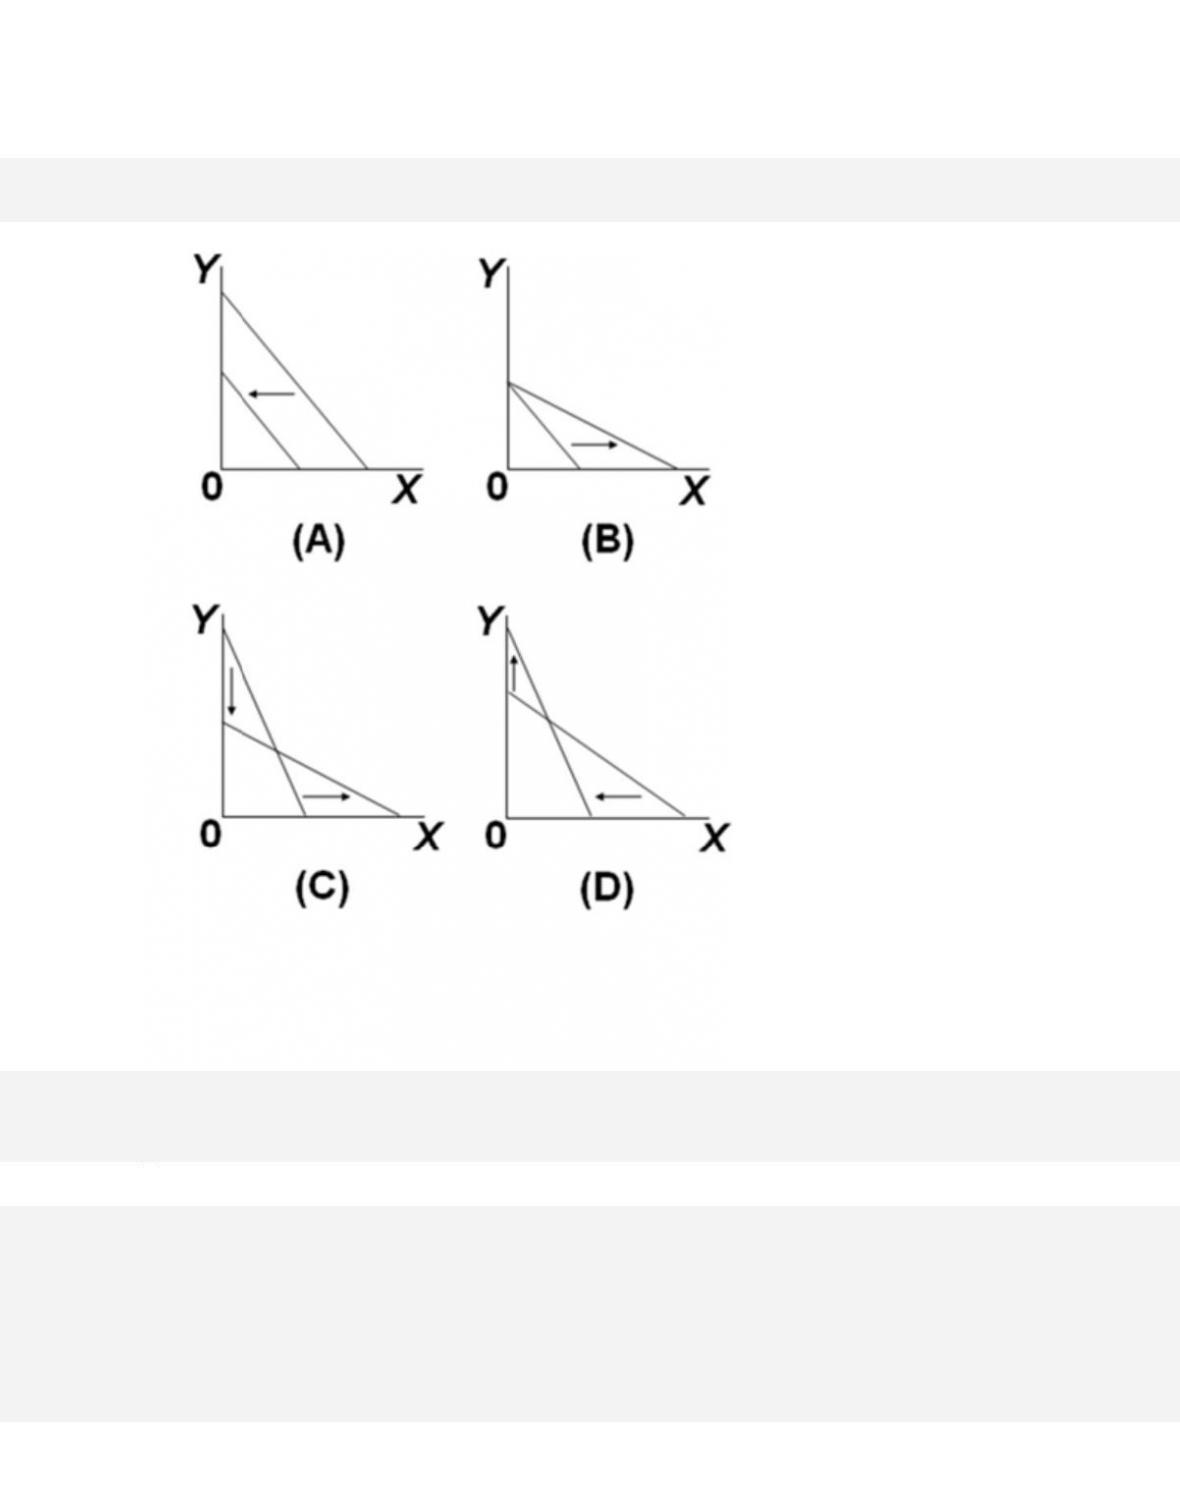
263.
Which of the graphs shows a decrease in the price of X and an increase in the price of Y, but no
change in the buyer’s budget?
7-138
Copyright © 2018 McGraw-Hill Education. All rights reserved. No reproduction or distribution without the prior
written consent of McGraw-Hill Education.
utility maximization.
Test Bank: II
To pi c:
Indifference Curve Analysis
264.
Which of the graphs shows an increase in the price of X and a decrease in the price of Y?
7-139
Copyright © 2018 McGraw-Hill Education. All rights reserved. No reproduction or distribution without the prior
written consent of McGraw-Hill Education.
utility maximization.
Test Bank: II
To pi c:
Indifference Curve Analysis
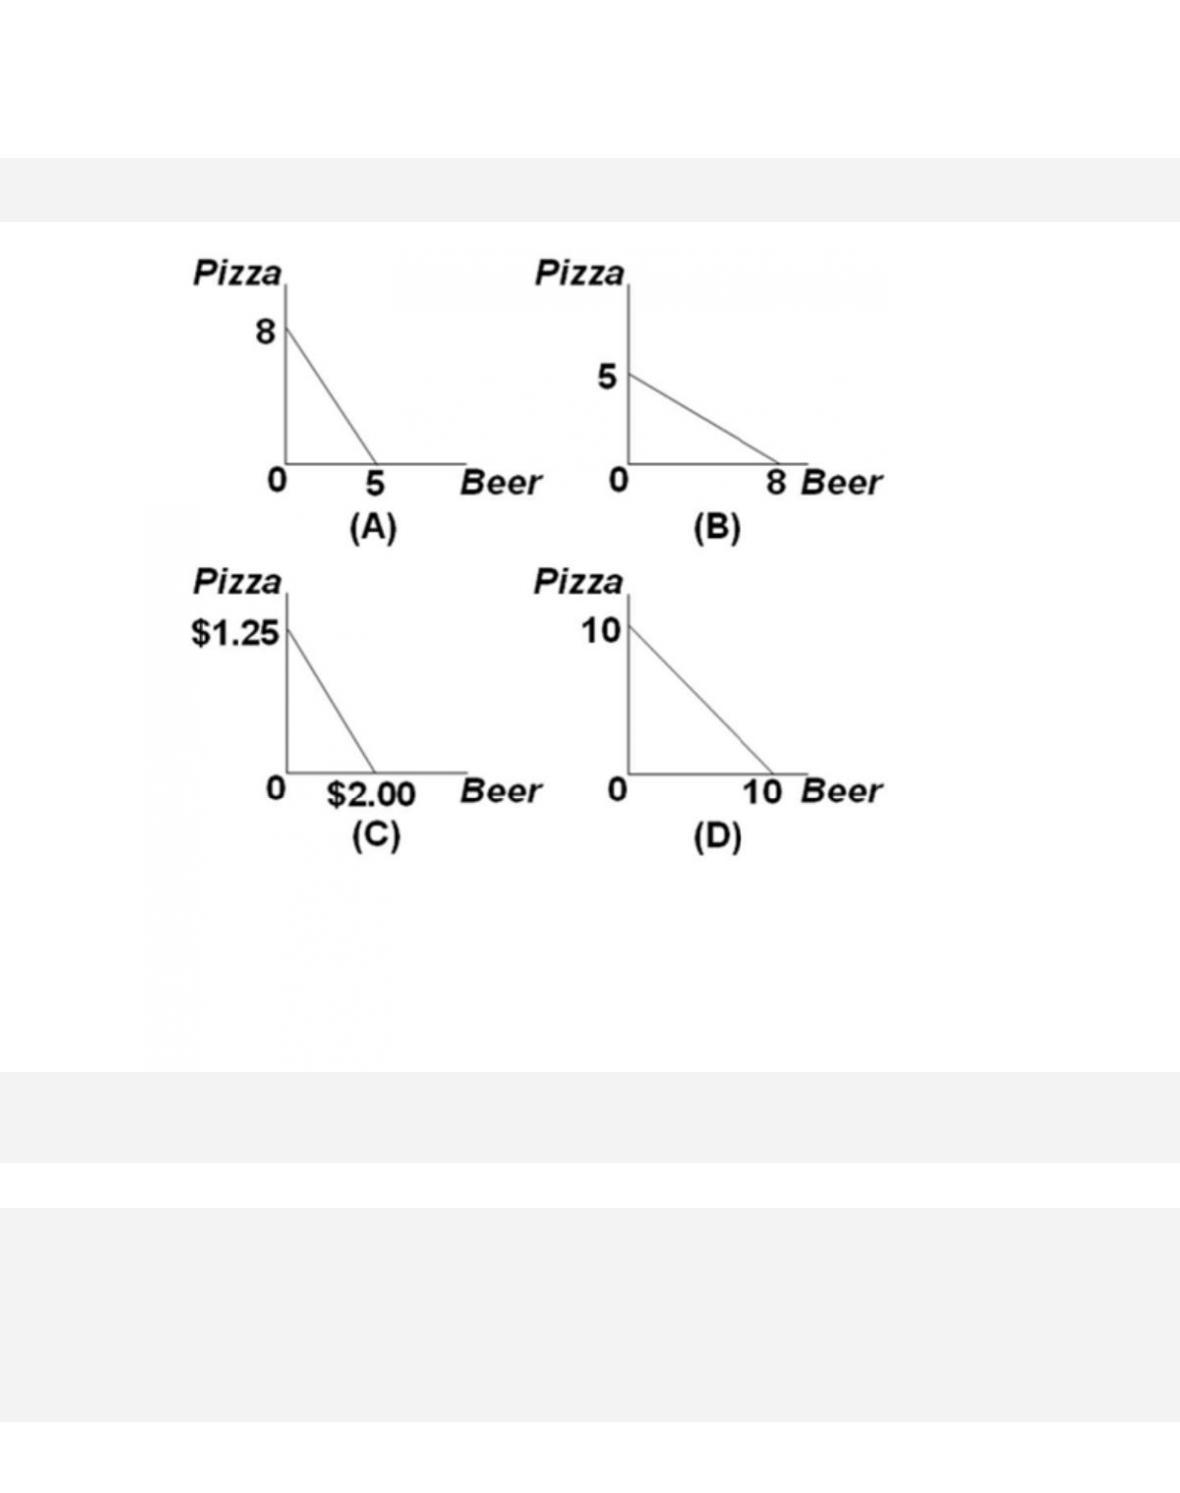
265.
Refer to the graphs. Pizza and beer are the only two goods Jon consumes. The price of beer is
$2.00 per pitcher and pizza is $1.25 per slice. If Jon has only $10 to spend for the evening,
which graph represents the set of possible combinations of beer and pizza that he can buy?

7-140
Copyright © 2018 McGraw-Hill Education. All rights reserved. No reproduction or distribution without the prior
written consent of McGraw-Hill Education.
utility maximization.
Test Bank: II
To pi c:
Indifference Curve Analysis
266. An indifference curve shows
A. the maximum combinations of two products that a consumer can afford to buy, given prices
and the consumer’s income.
267. If two combinations of goods X and Y give a consumer equal satisfaction, then these two
combinations must both be on the same
268. As a consumer moves from one point to another along an indifference curve, which of the
following is assumed to stay constant?