
7-61
Topic: Indifference Curve Analysis
112. Assume the price of product Y (the quantity of which is plotted on the vertical axis) is
initially $15 and the price of X (the quantity of which is plotted on the horizontal axis) is
initially $3. Assume money income is initially $60. If the prices of Y and X now increase to
$30 and $6, respectively, and money income increases to $120, then the budget line will
A. shift rightward and become steeper.
113. Assume initially that the price of X (the quantity of which is measured on the horizontal
axis) is $9 and the price of Y (the quantity of which is measured on the vertical axis) is $4. If
the price of X now declines to $6, the budget line will
A. be unaffected.
114. Edith is buying products X and Y with her money income. Suppose her budget line shifts

7-62
rightward (outward). This might be the result of
A. the prices of X and Y increasing while her money income remains constant.
115. Assume the price of product Y (the quantity of which is on the vertical axis) is $15 and the
price of product X (the quantity of which is on the horizontal axis) is $3. Also assume that
money income is $60. The absolute value of the slope of the resulting budget line is
A. 5.
116. The indifference curve in the diagram yields Juan 100 units of utility. If Juan’s money
income were to increase by 20 percent, the indifference curve would
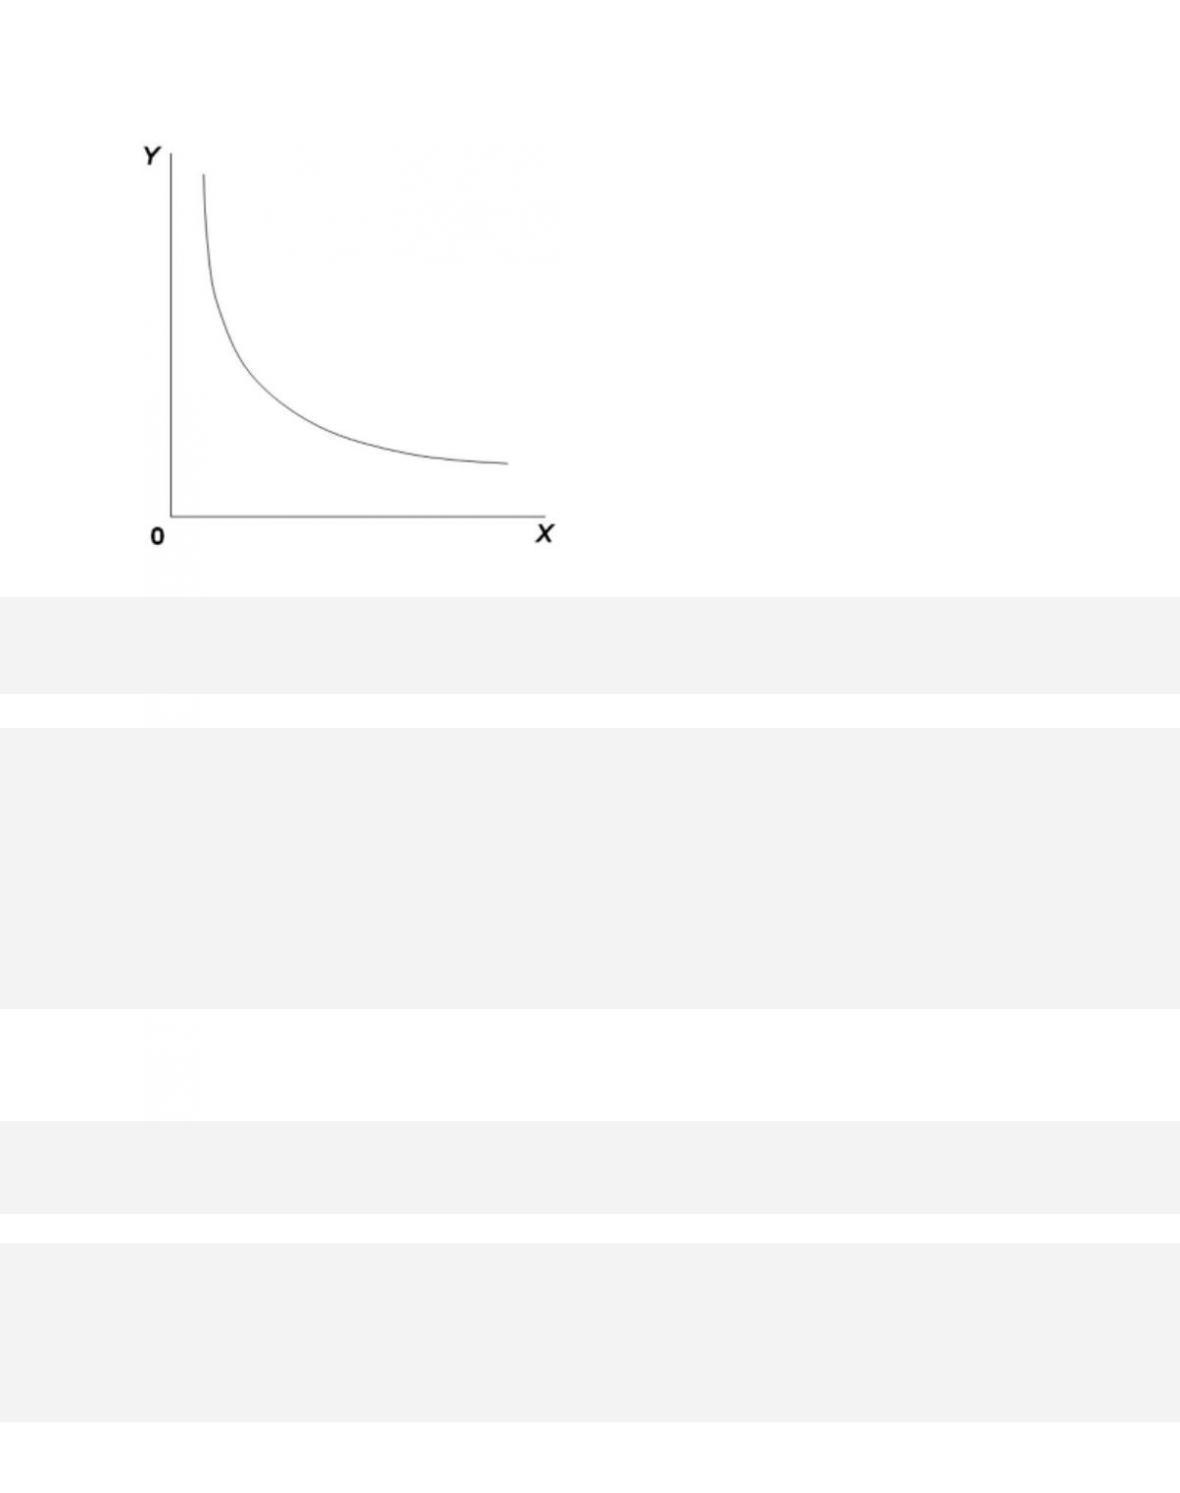
A. shift leftward.
117. At each point on an indifference curve,
A. money income is the same.

7-64
Copyright © 2018 McGraw-Hill Education. All rights reserved. No reproduction or distribution without the prior
written consent of McGraw-Hill Education.
G r a d a b l e : a u t o m a t i c
Learning Objective: 07–06 Appendix: Relate how the indifference curve model of
consumer behavior derives demand curves from budget lines, indifference curves, and
utility maximization.
Test Bank: I
Topic: Indifference Curve Analysis
118. An indifference curve shows all
A. possible equilibrium positions on an indifference map.
119. An indifference curve
A. may be either upsloping or downsloping, depending on whether the two products are
complements or substitutes.

7-65
120. An indifference map implies that
A. money income is constant, but the prices of the two products vary directly with the quantities
purchased.
121. The marginal rate of substitution measures the
A. magnitude of the substitution effect.
122. The marginal rate of substitution
A. may increase or decrease on a given indifference curve, depending on whether the
substitution or the income effect is dominant.

7-66
Copyright © 2018 McGraw-Hill Education. All rights reserved. No reproduction or distribution without the prior
written consent of McGraw-Hill Education.
B. increases as one moves southeast along an indifference curve.
C. is constant at all points on the budget line.
D. declines as one moves southeast along an indifference curve.
123. Which of the following is correct?
A. Budget lines are linear and upsloping; indifference curves are downsloping and concave to
the origin.
124. Indifference curve analysis
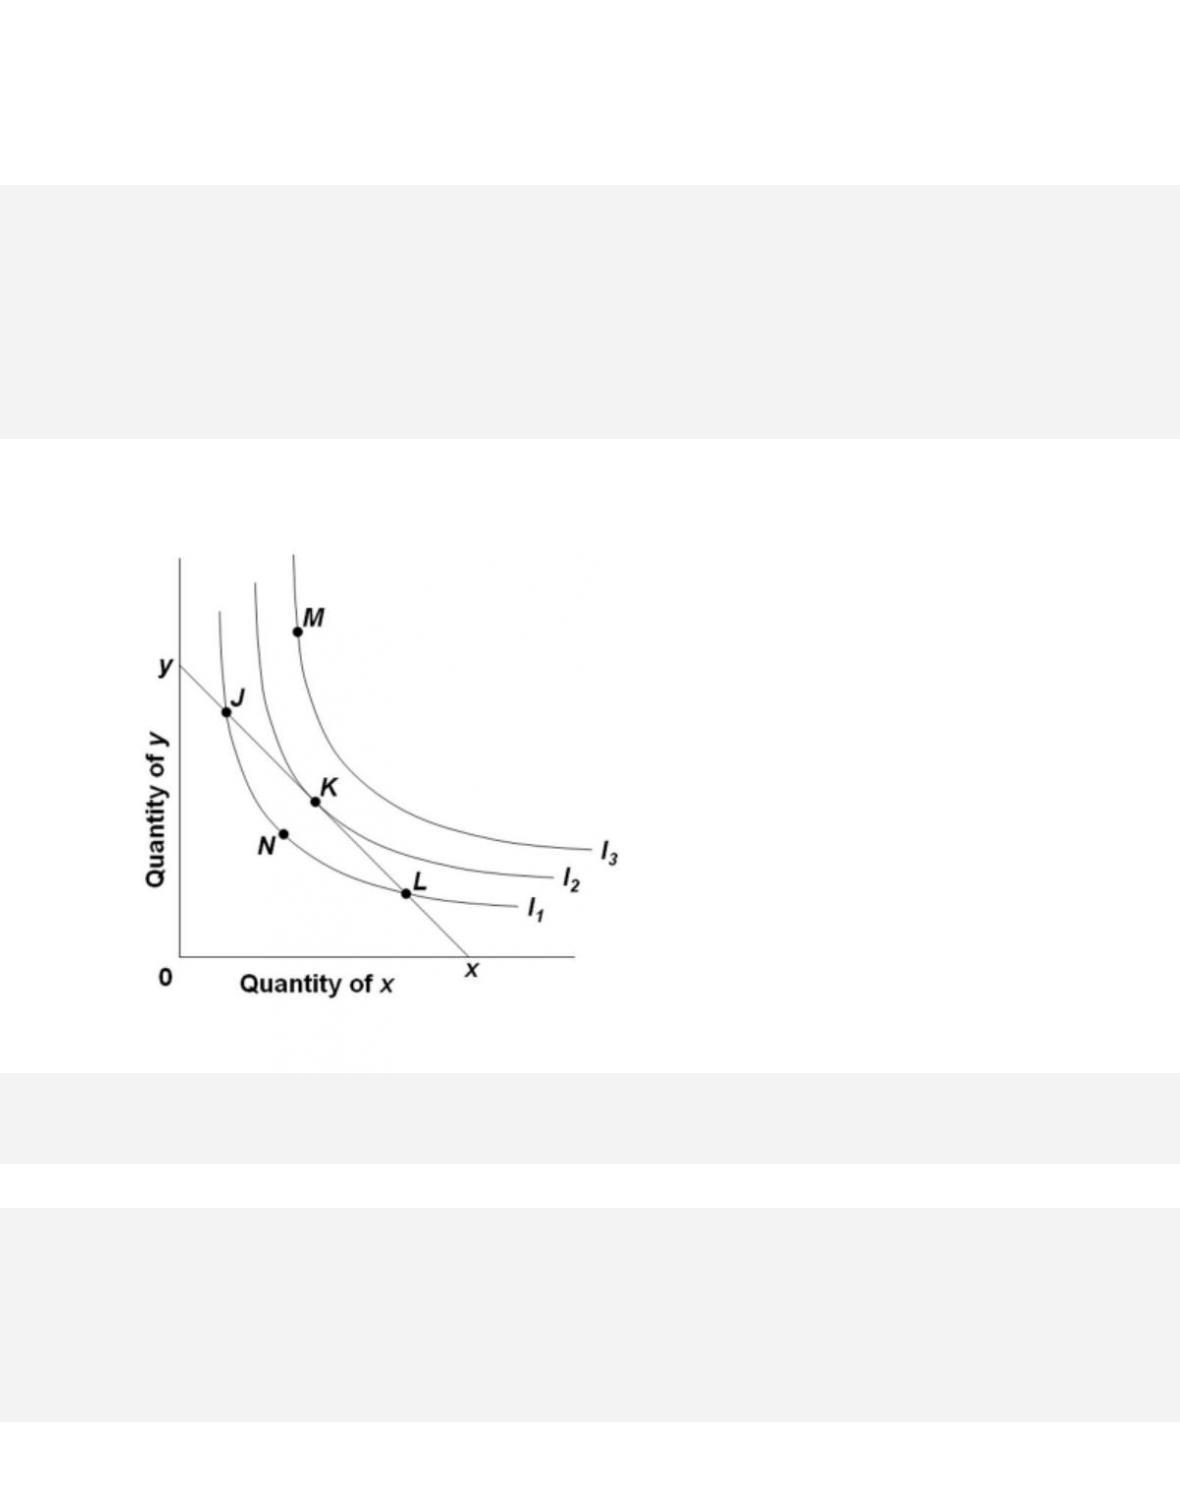
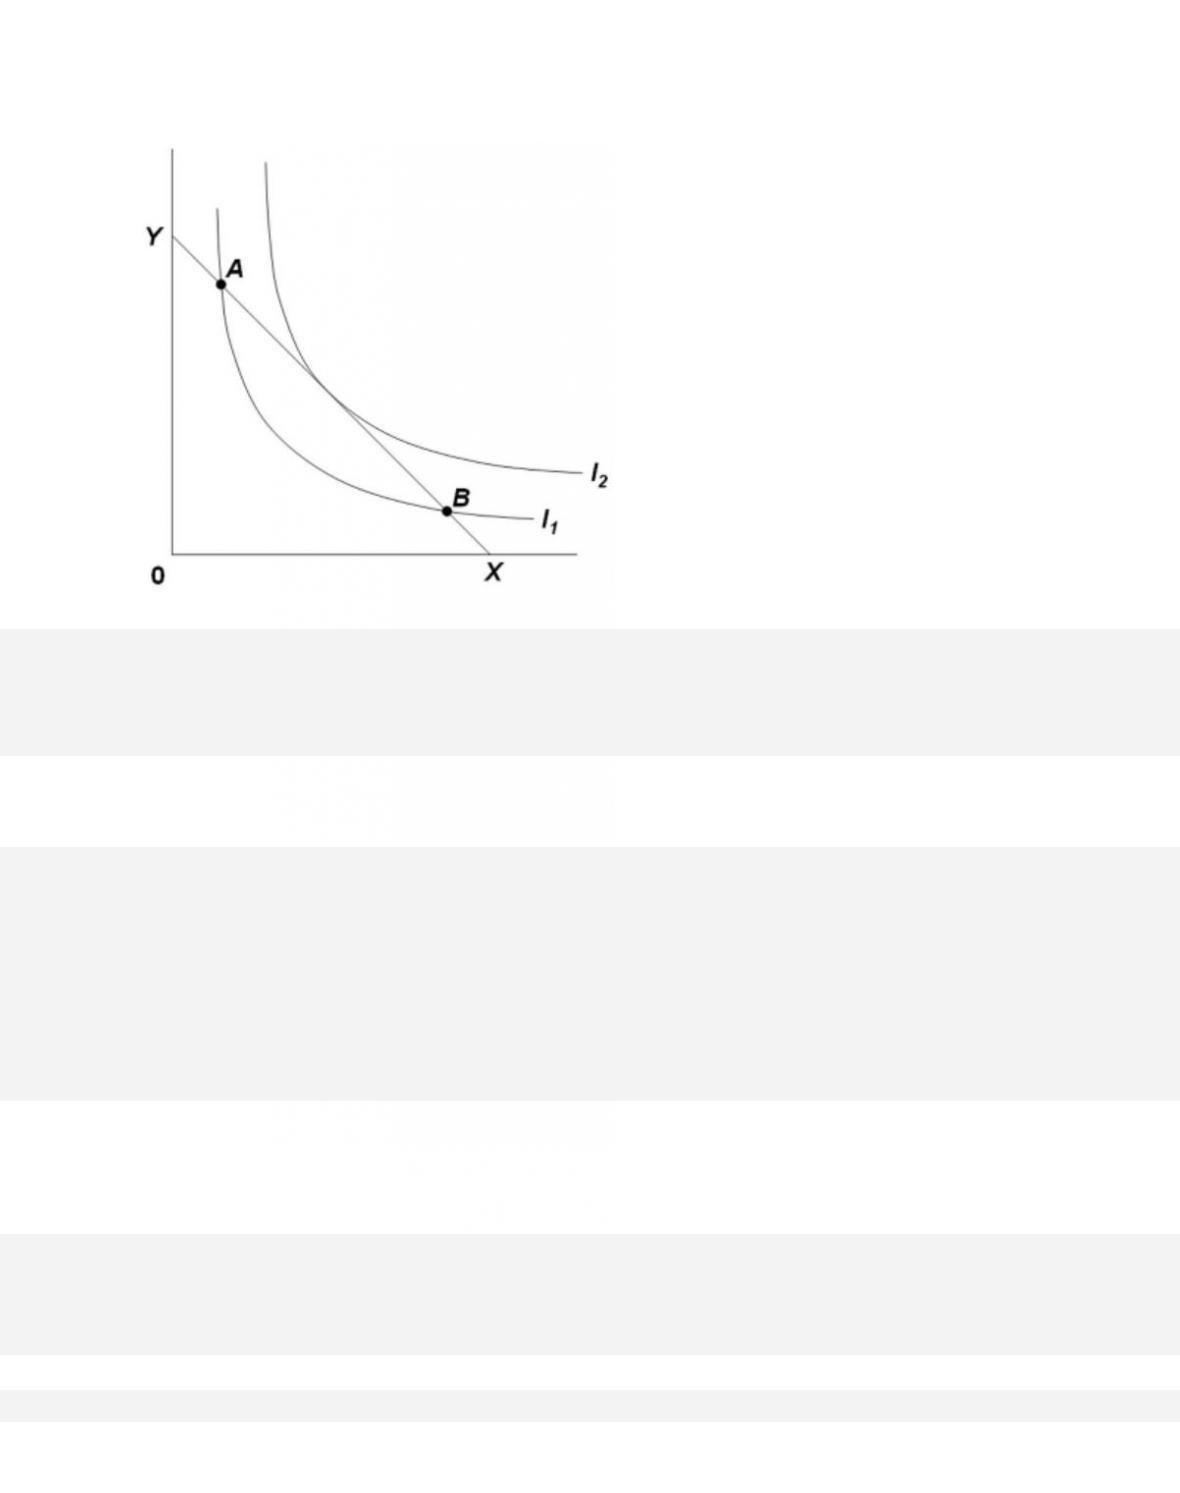
125. Refer to the diagram, where xy is the relevant budget line and I1, I2, and I3 are
indifference curves. The equilibrium position for the consumer is at
7-68
Copyright © 2018 McGraw-Hill Education. All rights reserved. No reproduction or distribution without the prior
written consent of McGraw-Hill Education.
consumer behavior derives demand curves from budget lines, indifference curves, and
utility maximization.
Test Bank: I
Topic: Indifference Curve Analysis
Type: Graph
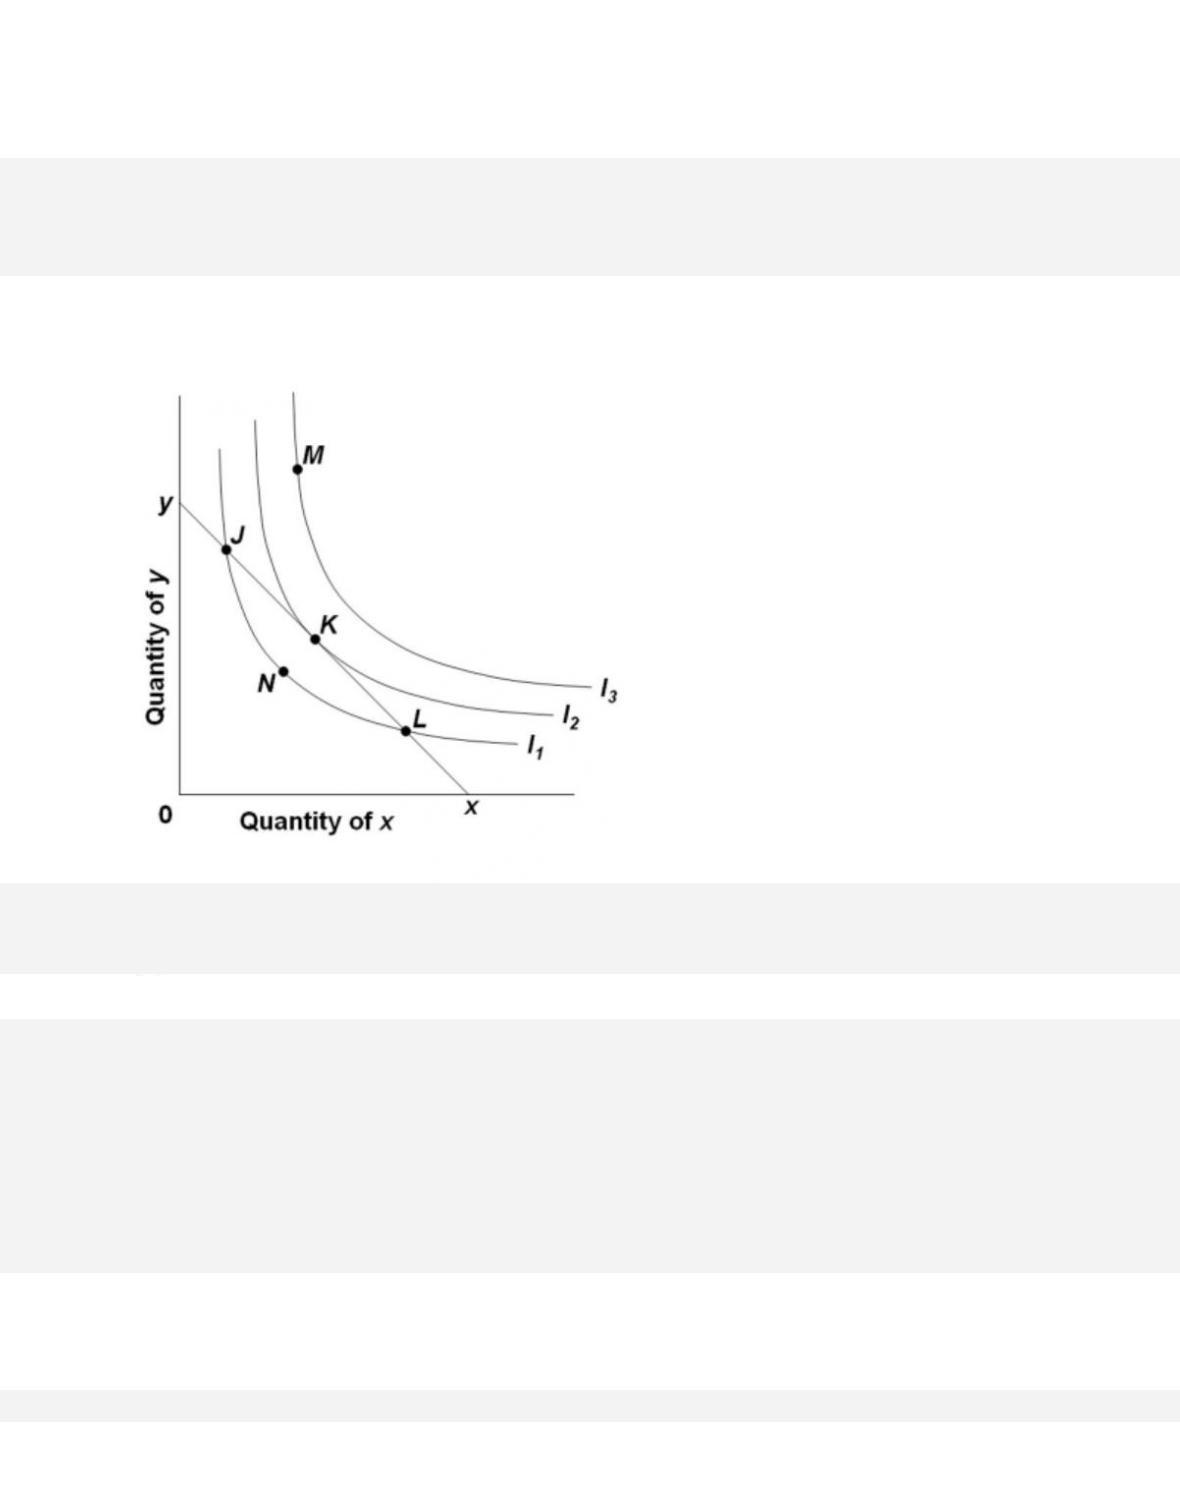
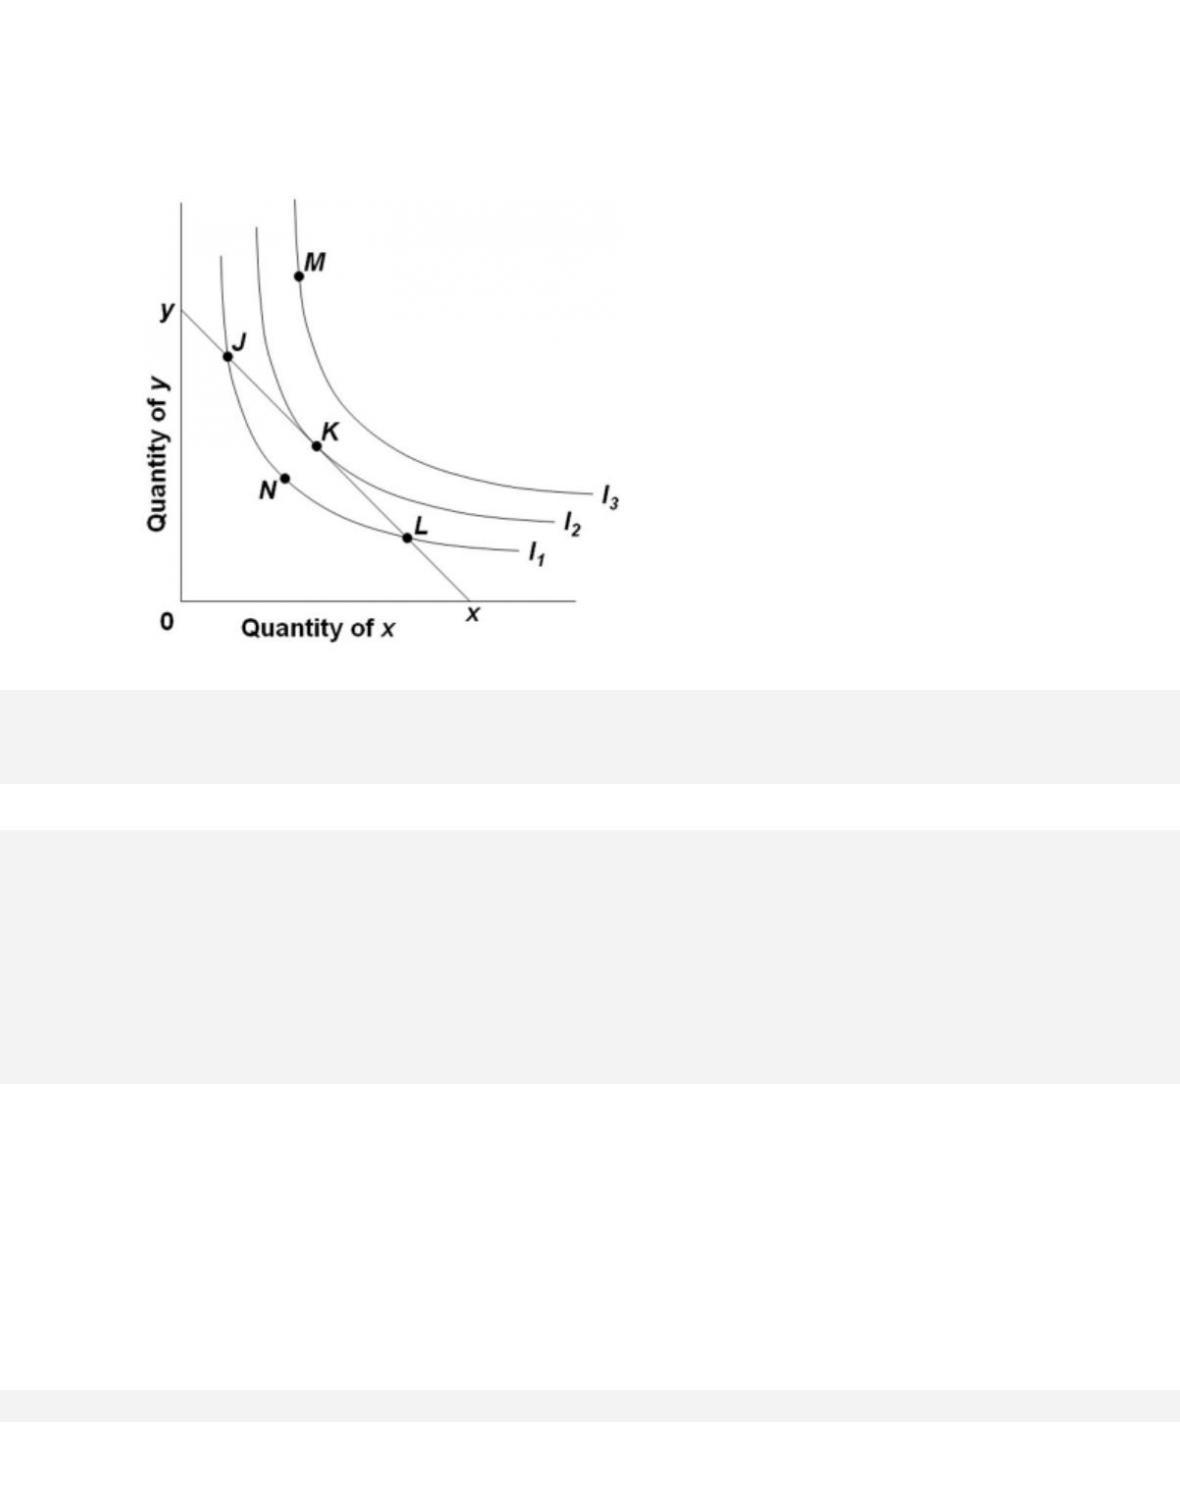
126. Refer to the diagram, where xy is the relevant budget line and I1, I2, and I3 are
indifference curves. If the consumer is initially at point L, he or she should
127. Refer to the diagram, where xy is the relevant budget line and I1, I2, and I3 are
7-69
indifference curves. At point K,
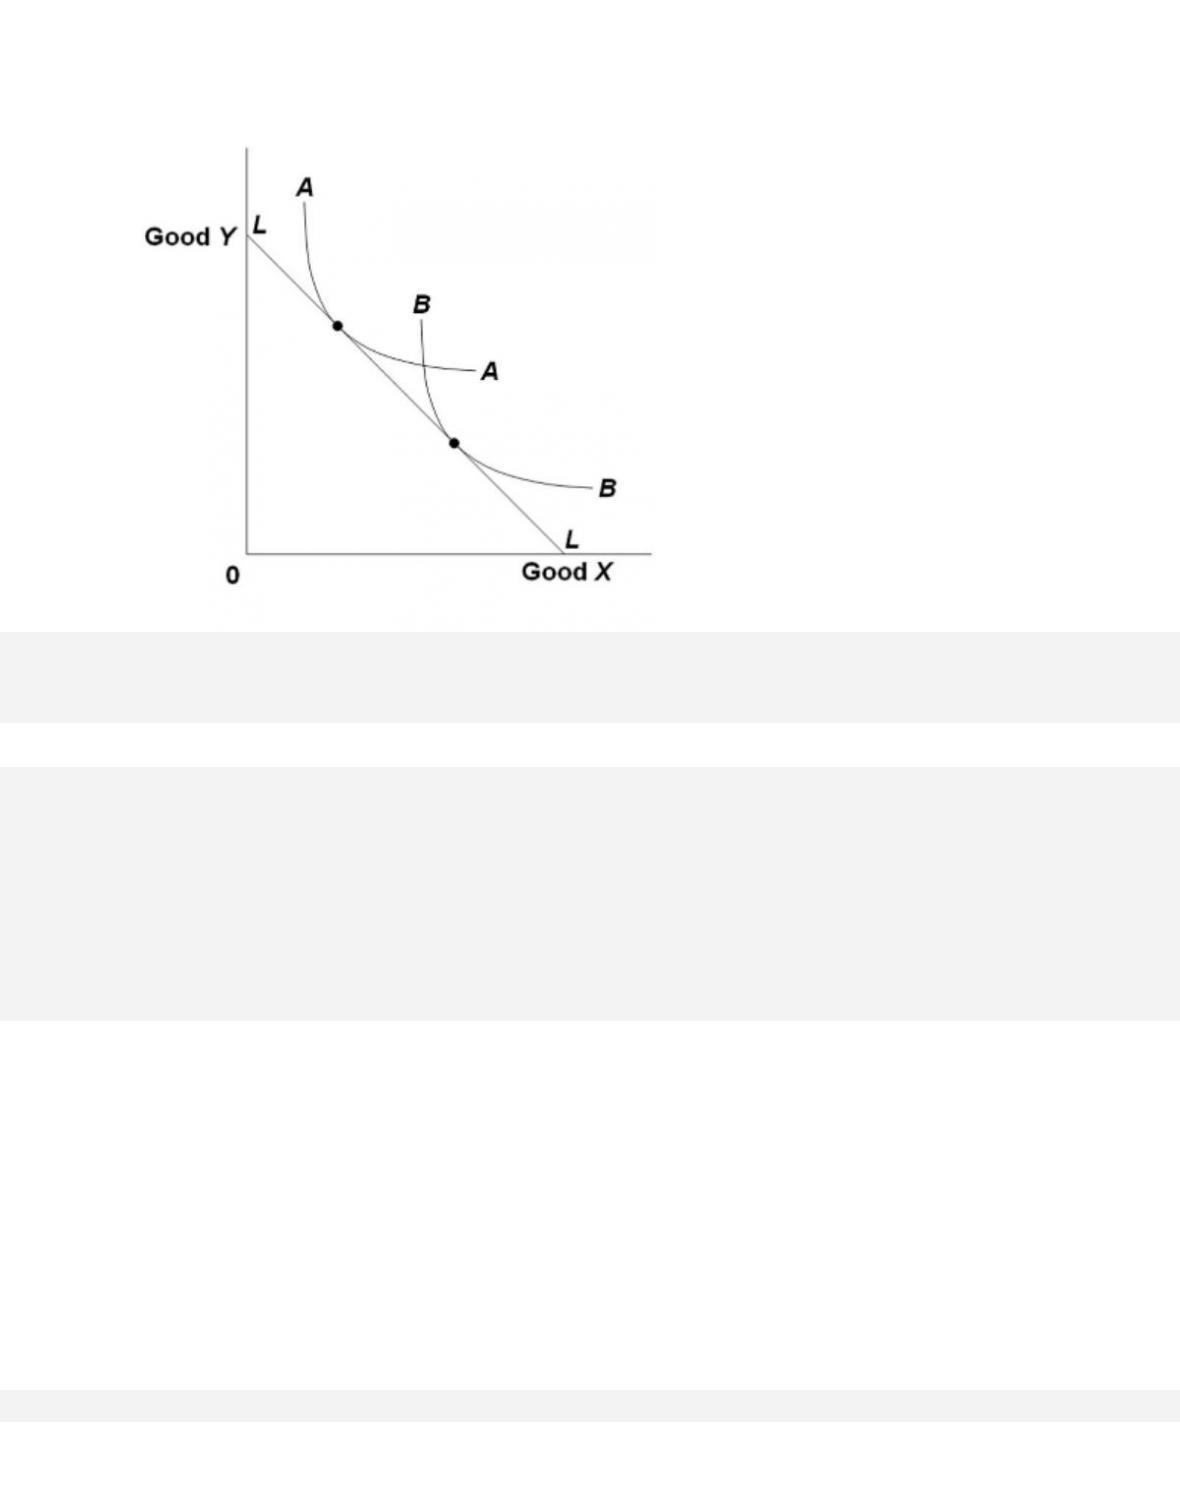
128. AA is Al’s indifference curve, and BB is Betty‘s. Al and Betty have the same budget line,
LL. This information implies that
7-70
129. In the diagram,
7-71
D. any combination of X and Y entailing more of X and less of Y than shown at A would be
preferred.
130. Assume a diagram in which a budget line is imposed on an indifference map. A consumer
will maximize her utility
A. at any point where the budget line and an indifference curve intersect.
7-72
Copyright © 2018 McGraw-Hill Education. All rights reserved. No reproduction or distribution without the prior
written consent of McGraw-Hill Education.
AACSB: Knowledge Application
Blooms: Understand
D i f f i c u l t y : 0 2 M e d i u m
G r a d a b l e : a u t o m a t i c
Learning Objective: 07–06 Appendix: Relate how the indifference curve model of
consumer behavior derives demand curves from budget lines, indifference curves, and
utility maximization.
Test Bank: I
Topic: Indifference Curve Analysis
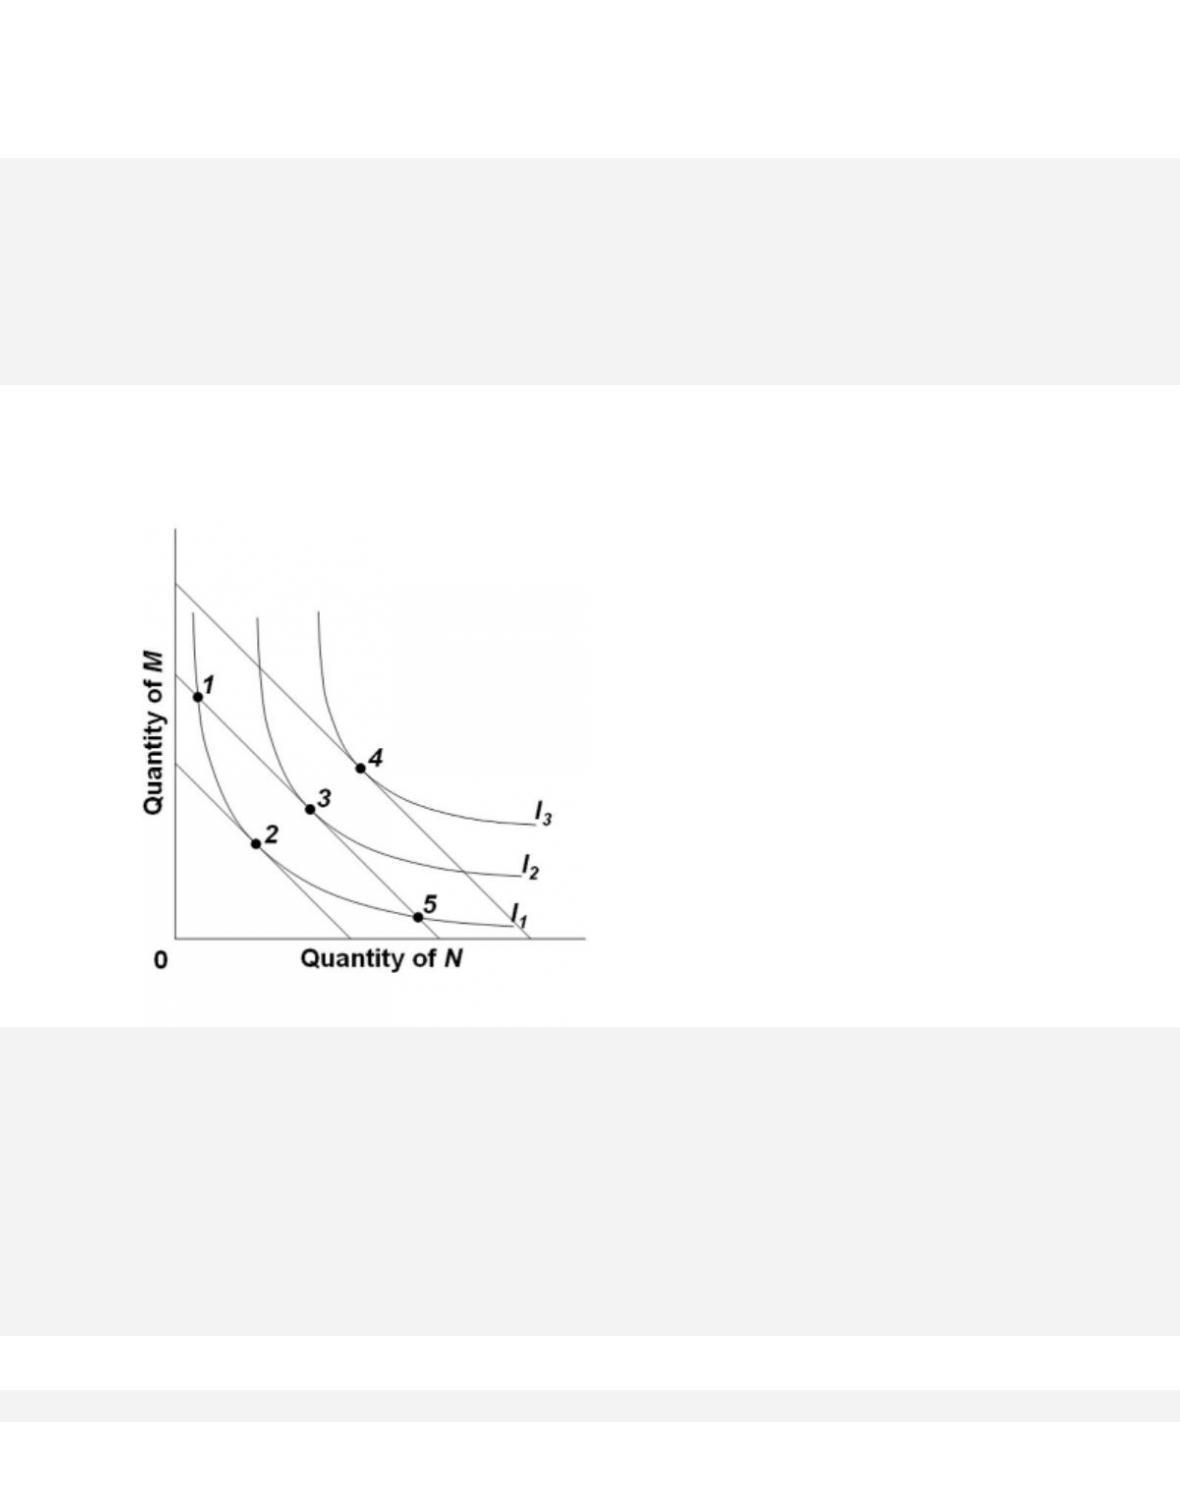
131. Refer to the diagram, in which the downsloping lines are budget lines and I1, I2, and I3
comprise an indifference map. The combinations of products M and N indicated by points 1, 2,
and 5 are such that
A. point 2 yields more utility than either 1 or 5.
7-73
Copyright © 2018 McGraw-Hill Education. All rights reserved. No reproduction or distribution without the prior
written consent of McGraw-Hill Education.
Test Bank: I
Topic: Indifference Curve Analysis
Type: Graph
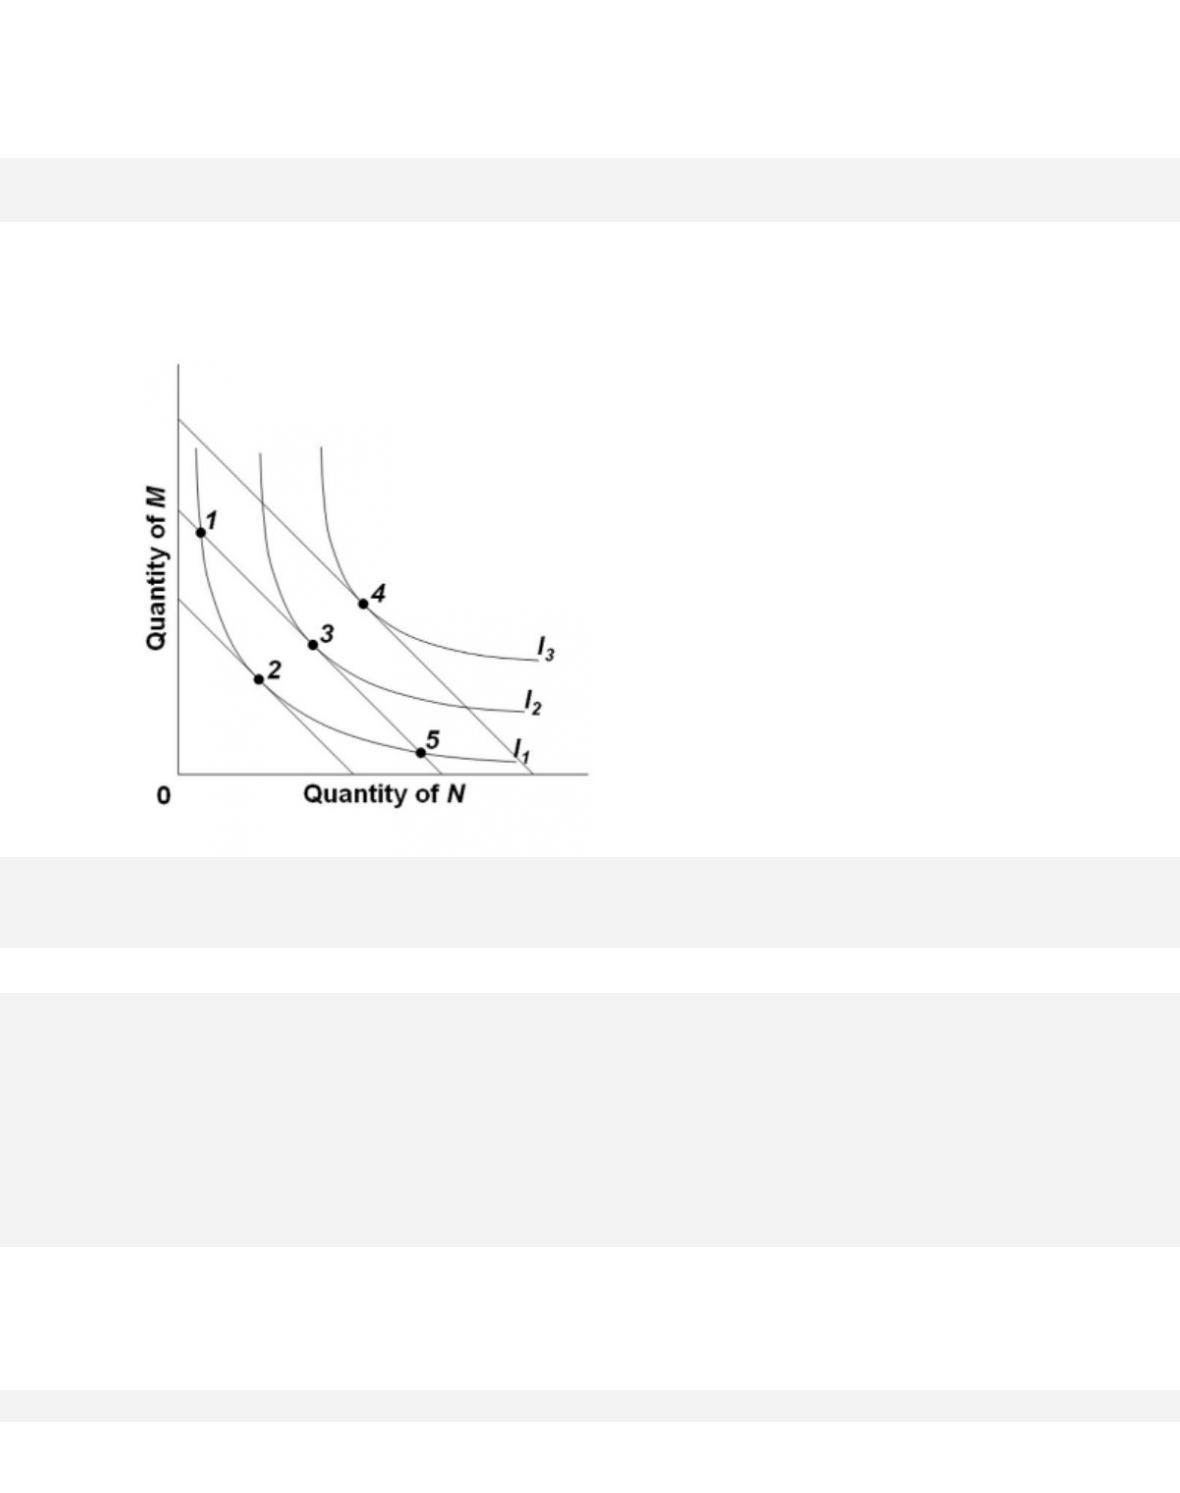
132. Refer to the diagram, in which the downsloping lines are budget lines and I1, I2, and I3
comprise an indifference map. The combinations of products M and N indicated by points 1, 3,
and 5 are such that
133. Refer to the diagram. If the budget line shifts from ab to ac, the
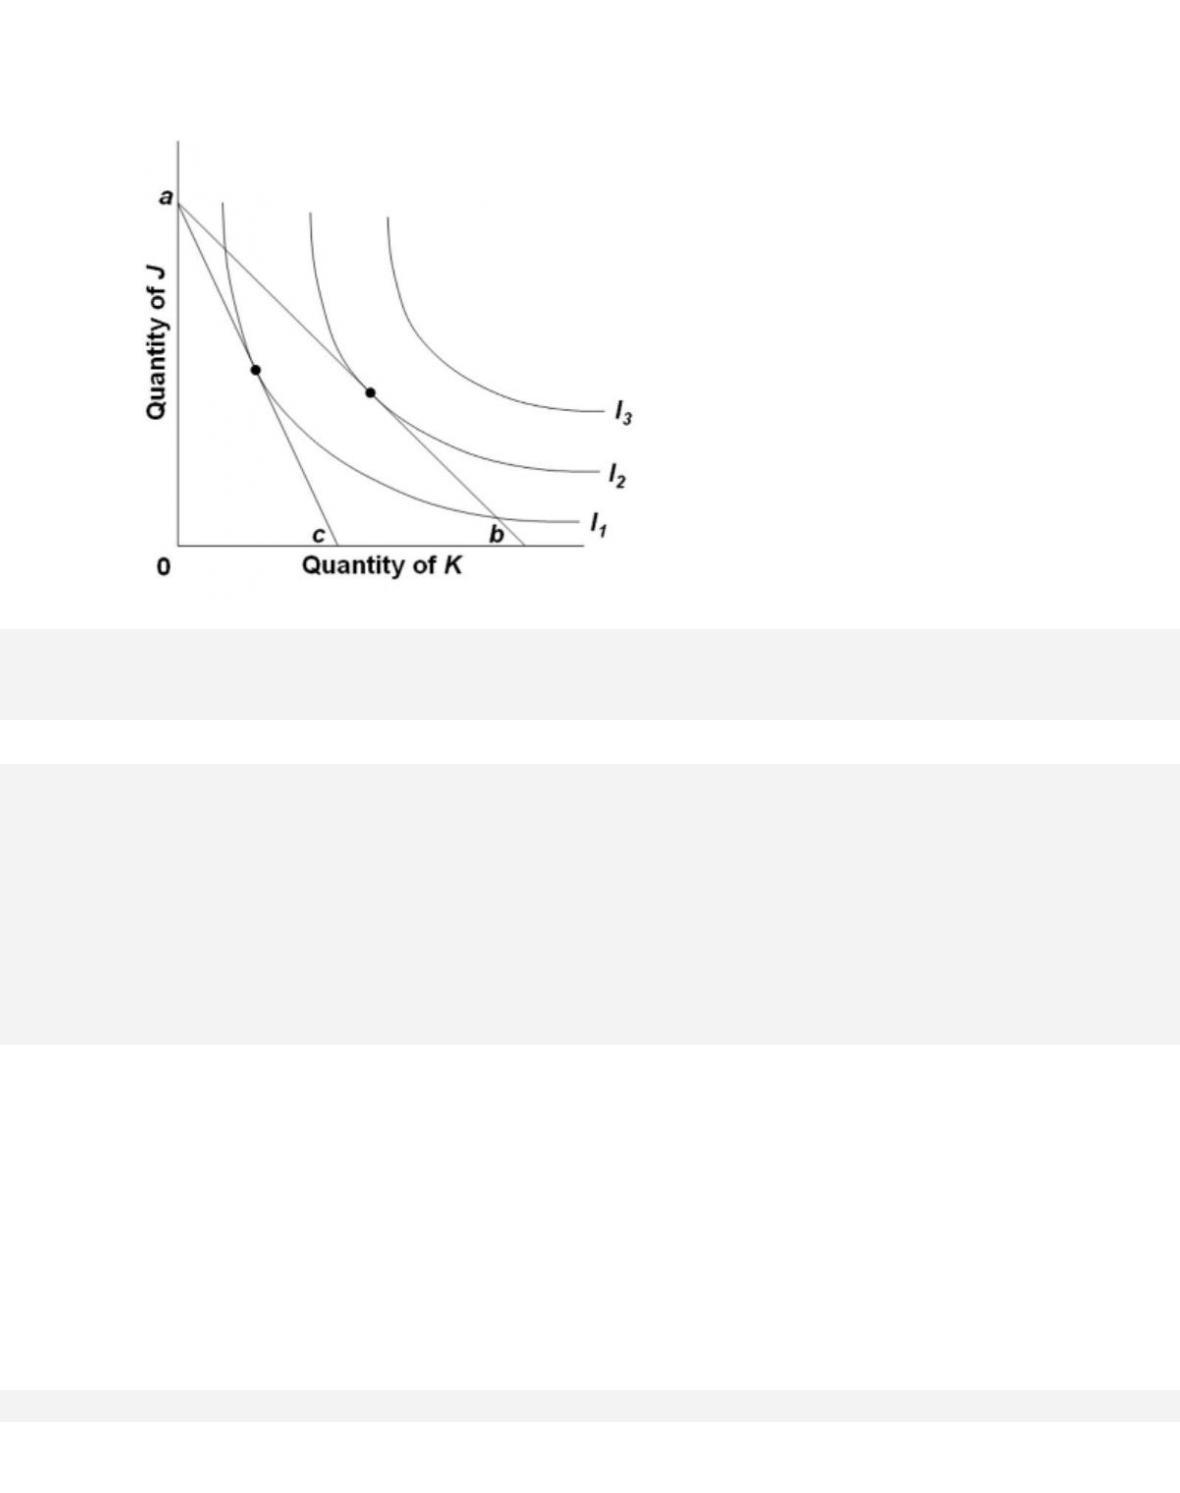
7-74
134. Refer to the diagram. If the budget line shifts from ab to ac, the
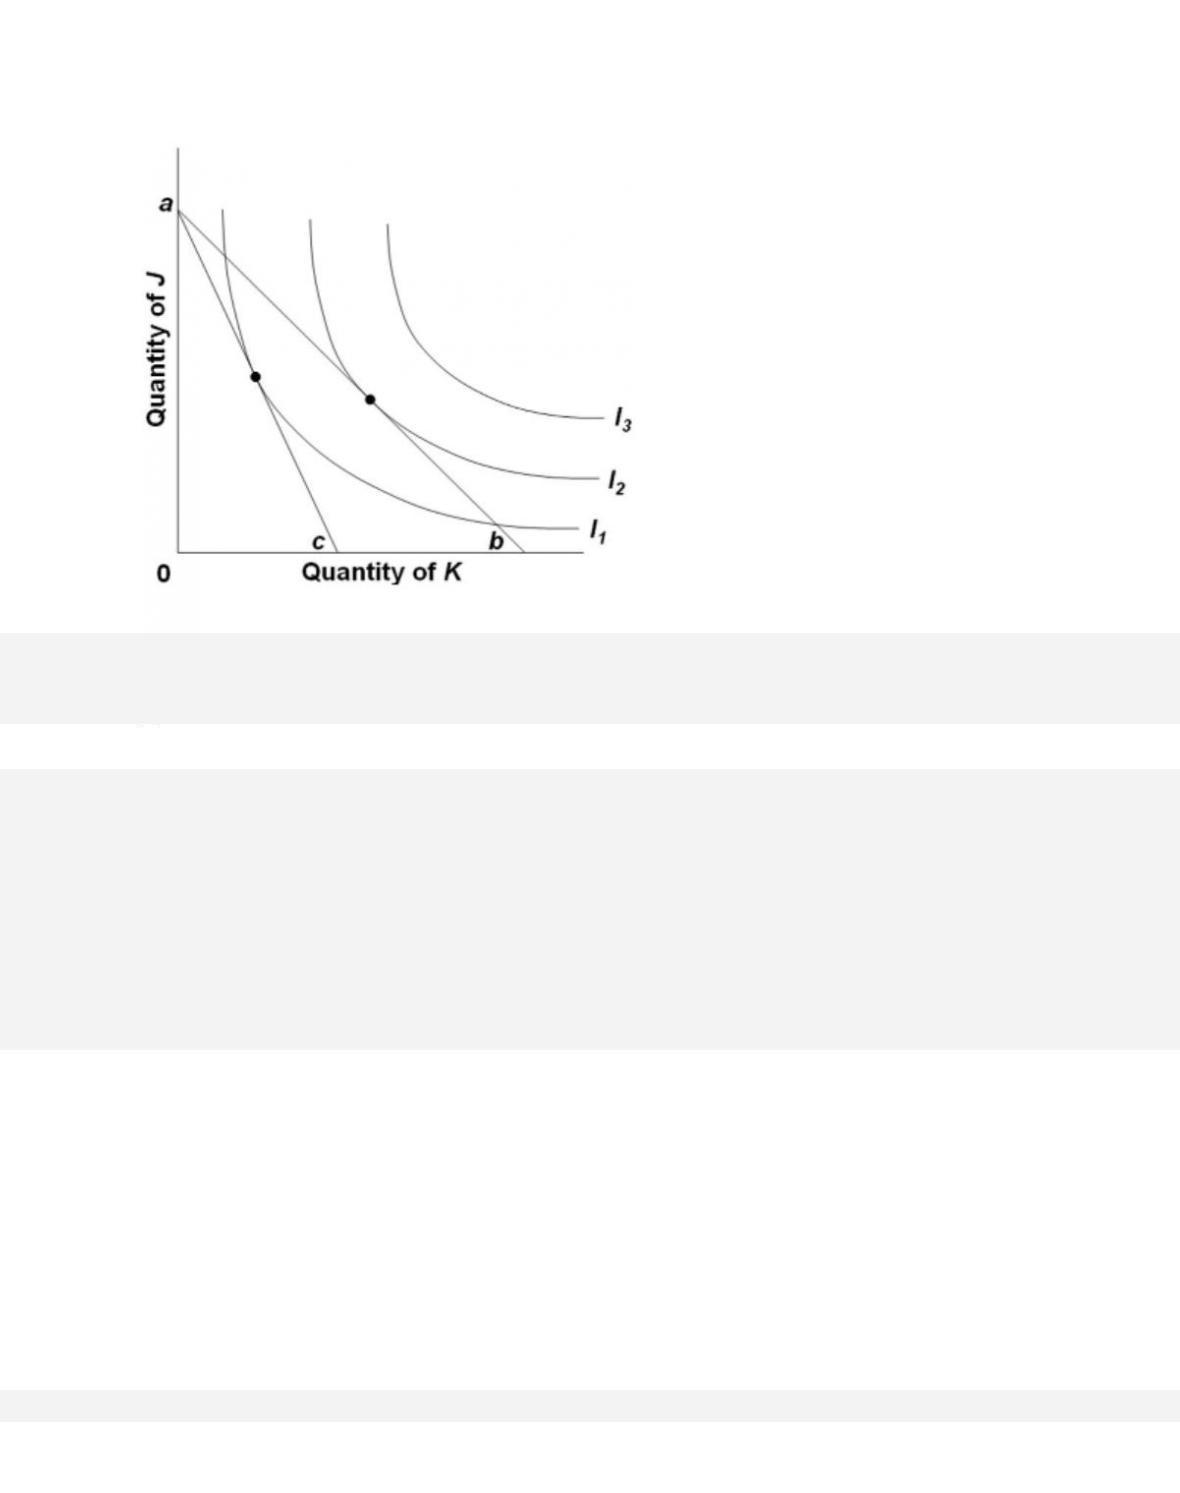
7-75
135. Refer to the diagram. The equilibrium points shown in the diagram, along with the price
change that produced the shift of the budget line from ab to ac,
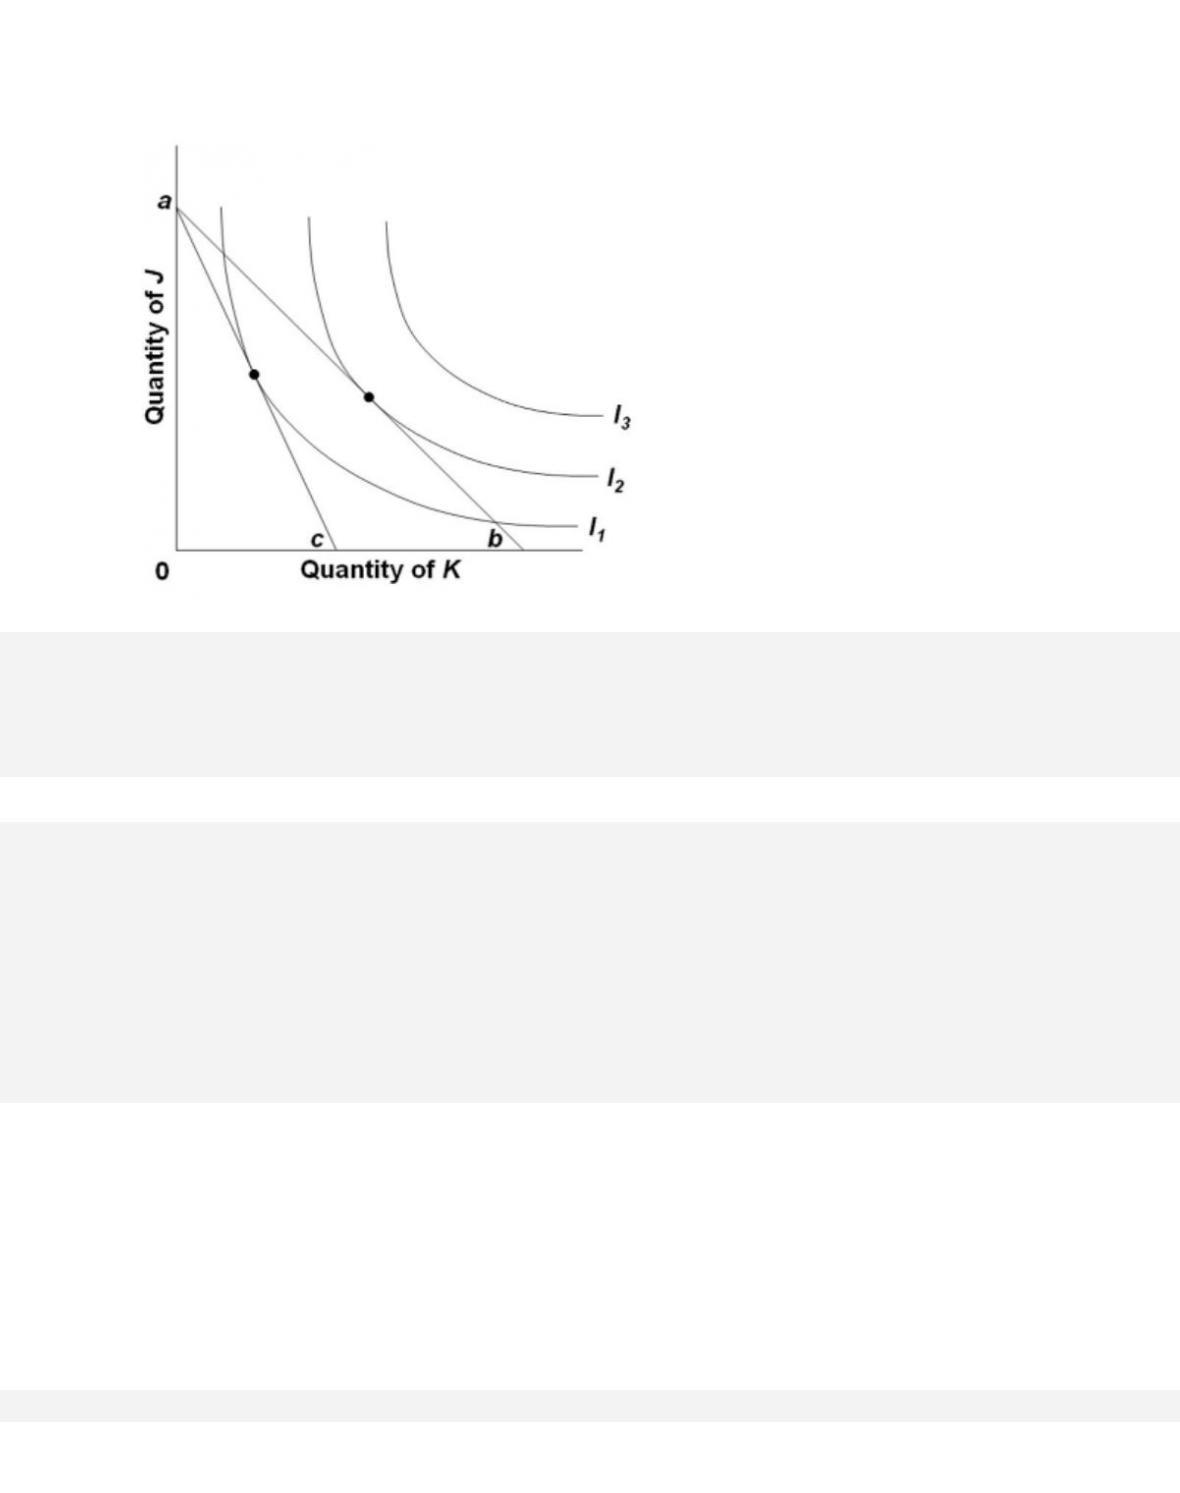
7-76
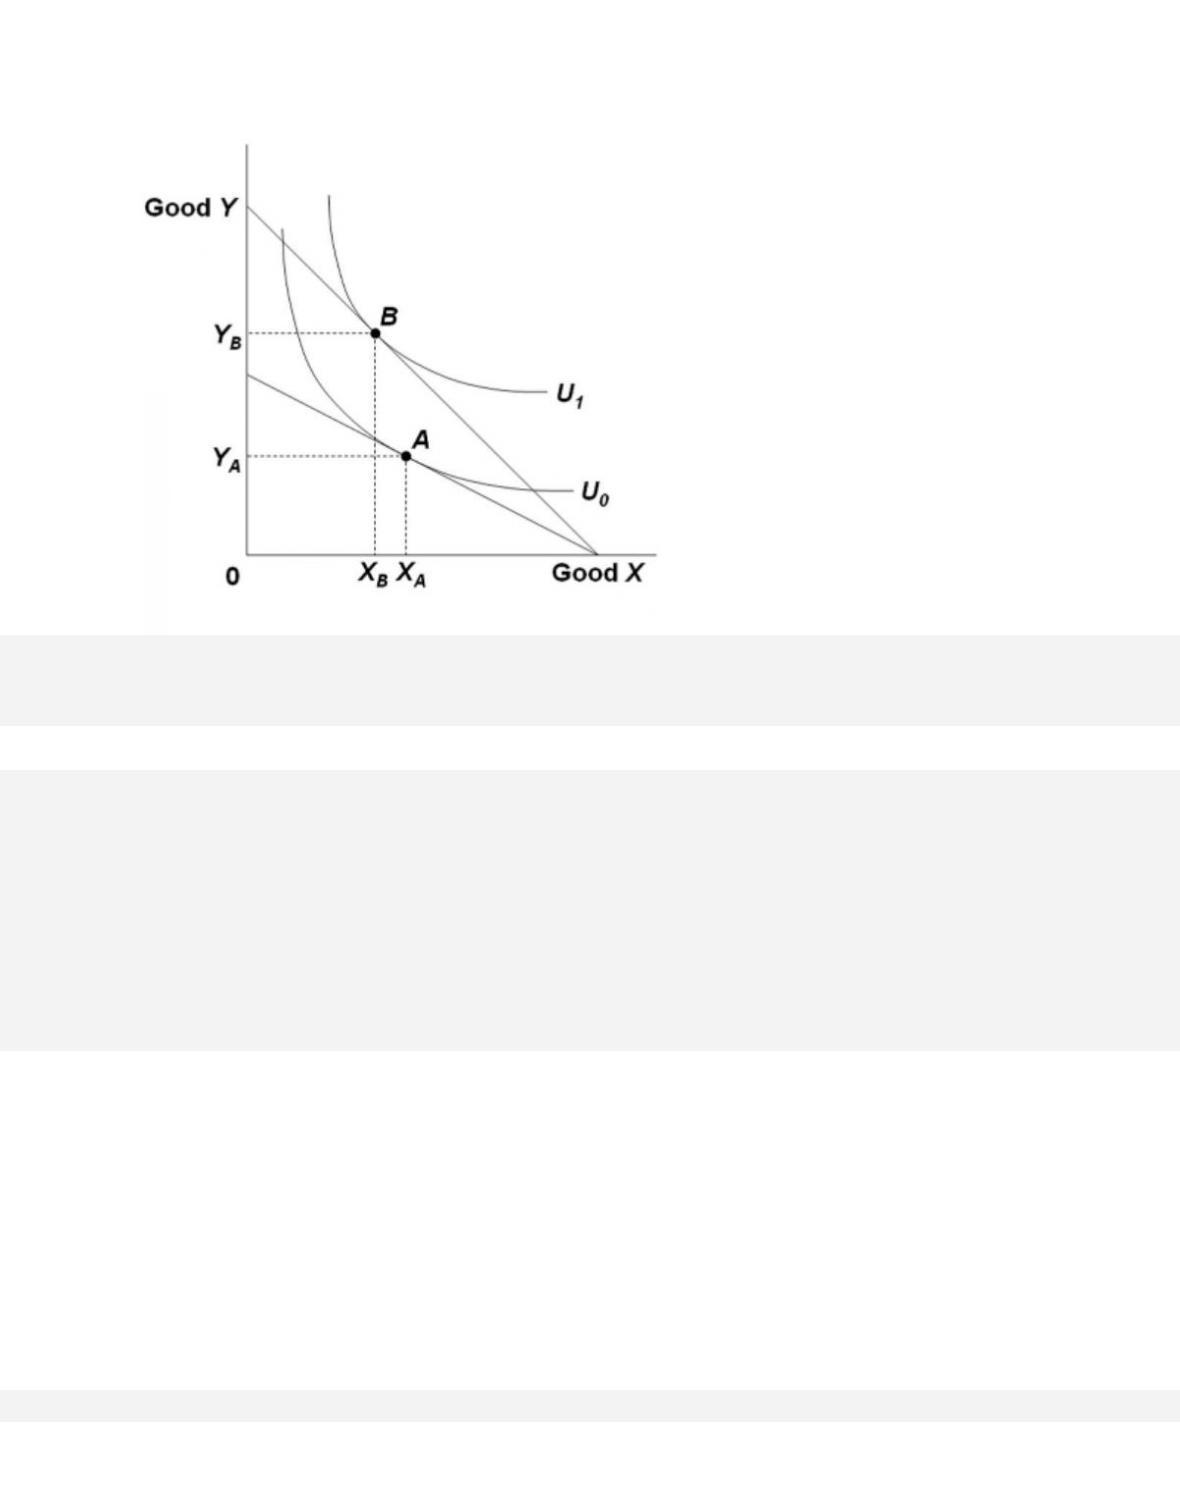
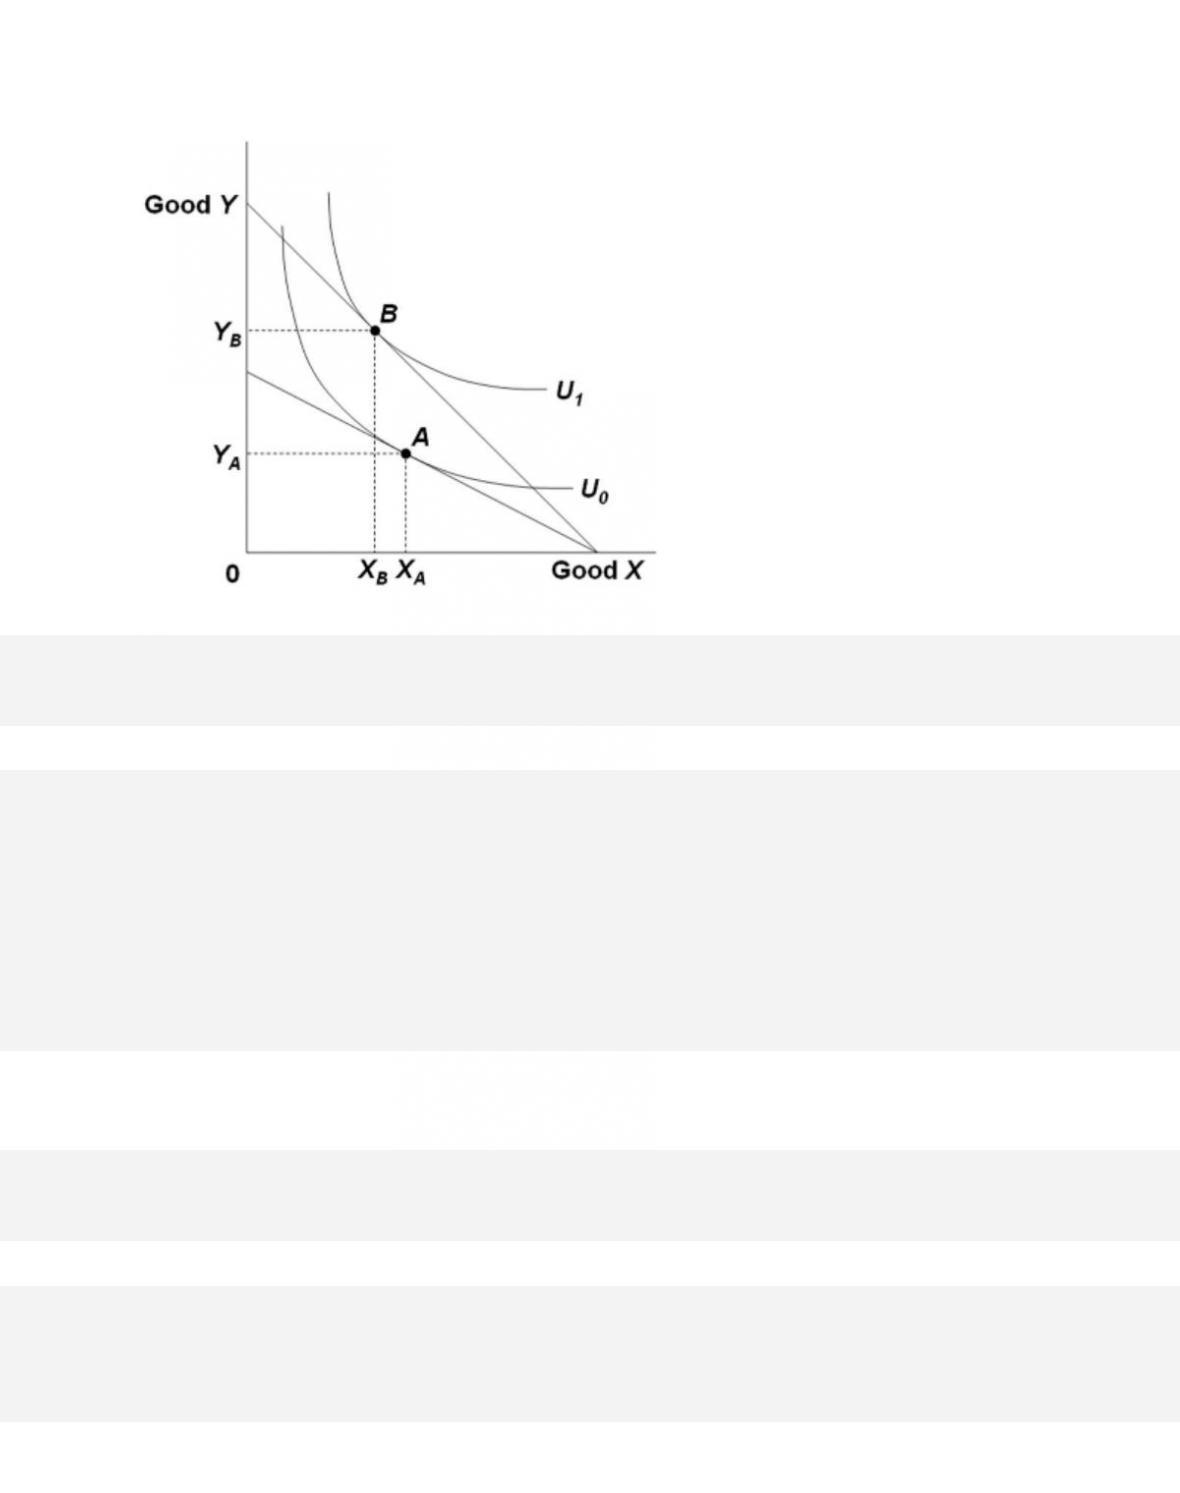
136. Refer to the diagram. Suppose the budget line shifts so that the consumer’s equilibrium
changes from point A to point B. This means that the
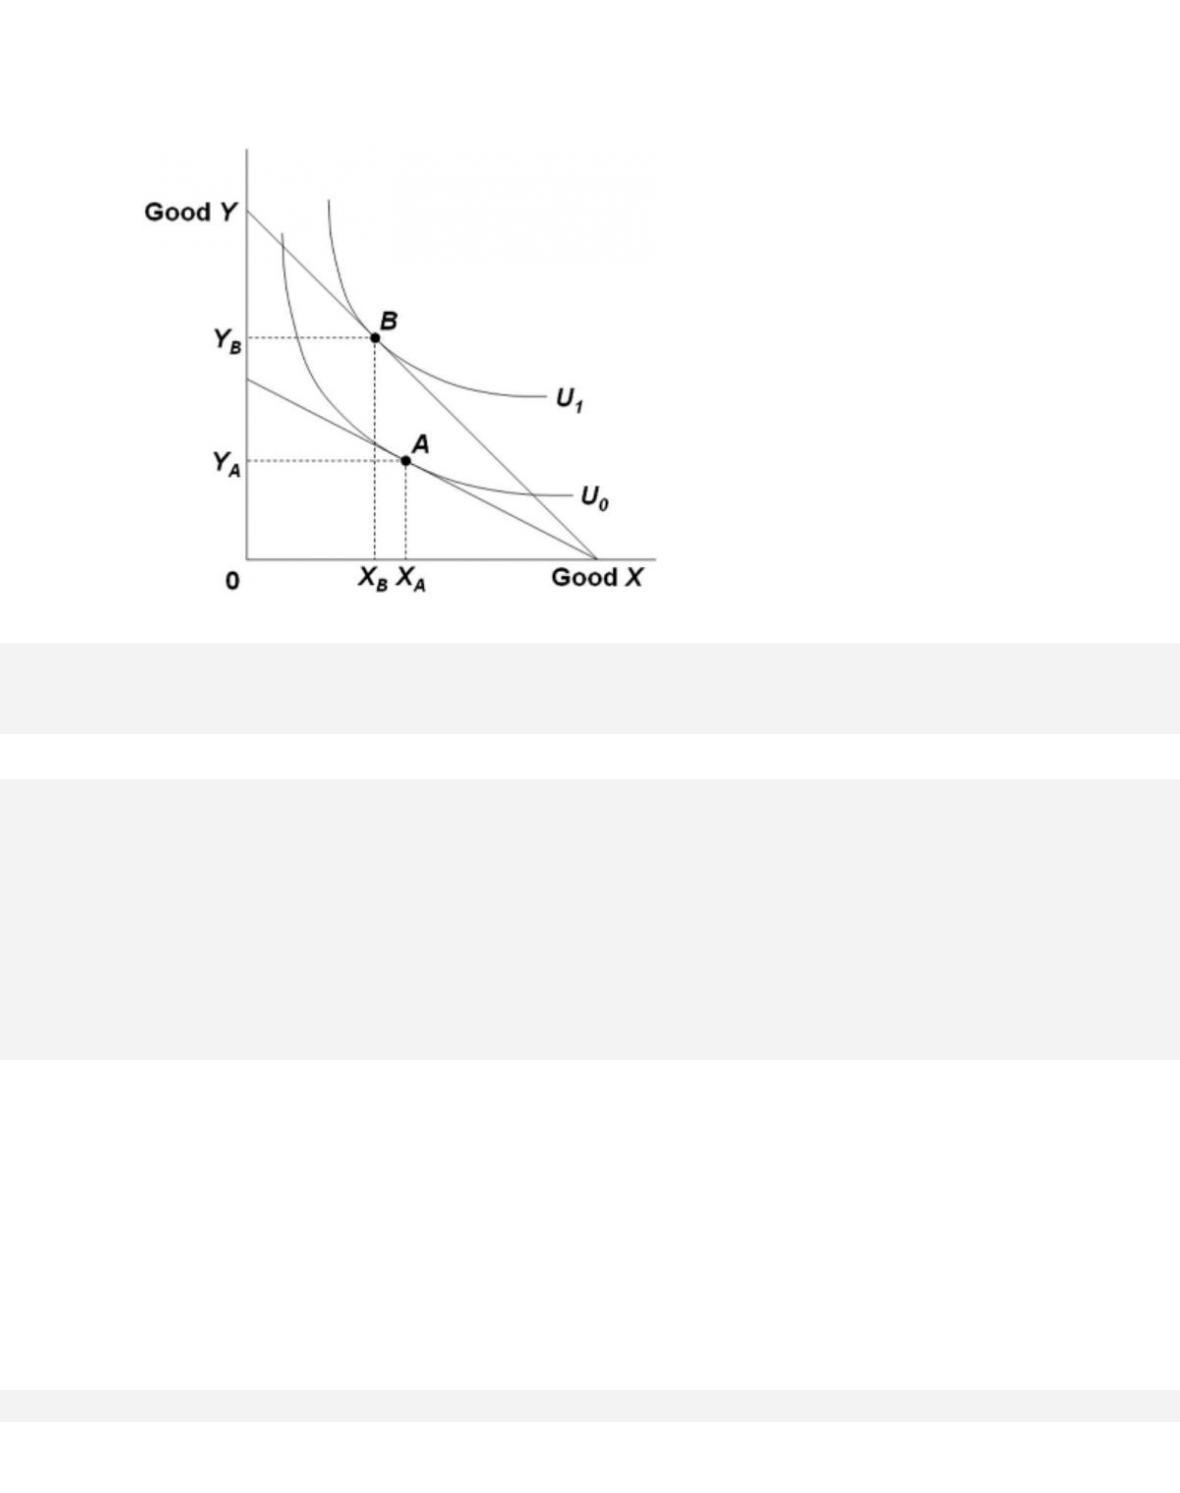
7-77
137. Refer to the diagram. The budget line shift that moves the consumer’s equilibrium from
point A to point B suggests
7-78
138. Refer to the diagram. The budget line shift that moves the consumer’s equilibrium position
from point A to point B suggests
139. (Consider This) The lines on a topographical map are analogous to a(n)

7-80
Copyright © 2018 McGraw-Hill Education. All rights reserved. No reproduction or distribution without the prior
written consent of McGraw-Hill Education.
D i f f i c u l t y : 0 2 M e d i u m
G r a d a b l e : a u t o m a t i c
Learning Objective: 07–06 Appendix: Relate how the indifference curve model of
consumer behavior derives demand curves from budget lines, indifference curves, and
utility maximization.
Test Bank: I
Topic: Indifference Curve Analysis
140. (Consider This) A topographical map shows successively higher equal-elevation lines,
whereas an indifference map shows successively higher levels of total
True / False Questions
141. Indifference curves are linear, and budget lines are convex to the origin.
142. Graphically, the consumer maximizes total utility where the budget line is tangent to an